

0 引言
航空重力布格改正中,一般使用1:25万或更大比例尺的数字高程模型 [1],对于大部分测区都能满足改正需求。但在重点勘探区内,多处大型新、老矿场的大规模采矿活动从未间断过,区内存在多处采空区、排土场和尾矿库等;又随着城镇化建设,区内的居民住宅、商业高楼拔地而起,这些因素在不同程度上改变和重塑着地质形态,像人类开发活动频繁、地表高程破坏严重的测区,若仍依靠传统搜集数字地形的方式,则会由其制作年代久远、地形高程改变速度太快或地形数据更新滞后等原因,使搜集的地形数据无法与航空重力测量数据进行同步匹配,贸然使用会带来极大的改正误差。
1 实验区概况与地形数据处理
1.1 实验区地形概况
实验区位于鞍山—本溪整装铁矿勘查区,该区属我国重点勘探地区,已知东西鞍山、齐大山等多个特大型铁矿,其分布范围广、规模大、矿体与围岩之间具有明显的密度差。测区中心位置为鞍山市,测区东南高、西北低,东南部为山区,最高峰位于测区中南部海拔520 m。西北部为低缓平原地带,一般高度在40~80 m。区内东西鞍山、齐大山、大孤山、小岭子和眼前山多处开采的铁矿区等在不断形变中,并且城市高层建筑也在陆续升起。
为验证多个不同时期的数字地形对实验区航空重力布格改正的影响,本文搜集了国家地理信息局的1:25万、1:5万DEM和3种全球典型的免费开放DEM数据(ASTER、SRTM和AW3D30),后3种数据的空间分辨率均为30 m,基本信息见表1。ASTER GDEM数据采用2019年发布的V3版产品,是世界上最先免费发布的全球30 m尺度的DEM数据,数据精度检验:在日本区域高程精度为12.6 m。SRTM DEM属于雷达产品,平面精度20 m,高程标称精度16 m,实际精度约9 m[9],于2000年由美国“奋进”号航天飞机采集,SRTM数据按精度可以分为SRTM1和SRTM3,对应的分辨率分别为30 m和90 m。AW3D30 DEM由日本宇宙航空研究机构(JAXA)研制,它源自ALOS卫星搭载的全色遥感立体测绘仪(PRISM)采集了300万个场景的光学立体像对数据,首先生成全球5 m的数字地表模型(DSM),平均精度为3.4 m,并以此重采成30 m尺度的数据于2015年5月免费发布,高程精度为5 m[10],实际精度约4.4 m,被称为30 m尺度上精度最高的全球免费DEM产品,并覆盖全球所有的土地尺度。
表1 全球公开版30 m分辨率DEM基本参数
Table 1
| ASTER | SRTM1 | AW3D30 | |
|---|---|---|---|
| 水平基准 | WGS84 | WGS84 | GRS80 |
| 高程基准 | EGM96 | EGM96 | EGM96 |
| 空间分辨率/m | 30 | 30 | 30 |
| 高程精度/m | 12.6 | 9 | 4.4 |
| 覆盖范围 | 83°N~83°S | 60°N~56°S | 84°N~84°S |
| 采集技术 | 立体像对 | InSAR | 立体像对 |
| 采集时间/年 | 1999~2008 | 2000 | 2006~2011 |
| 使用版本 | V3 | V3 | V2.2 |
图1为经过大孤山矿坑的测线L1710上部分搜集的DEM数据与实测地形的对比,图中可以看出1:25万数据存在多处阈值设置,分辨率和精度都比较差,实验中排除此项数据。1:5万数据具有25 m的最好分辨率,但从矿坑开采程度推测数据制作时间应早于2000年2月份采集的SRTM1。而L1710的Wxd100实测地形为直升机航空重磁勘查系统同步获取,它的作业时间为2013年12月。从1:5万、SRTM1和Wxd100数据中,可以观察到矿坑不断加深和排土场、尾矿库不断垒高的动态变化。鉴于地表形态在不同时期改变较大的情况,搜集滞后的数字地形进行布格改正显然变得不合理。
图1
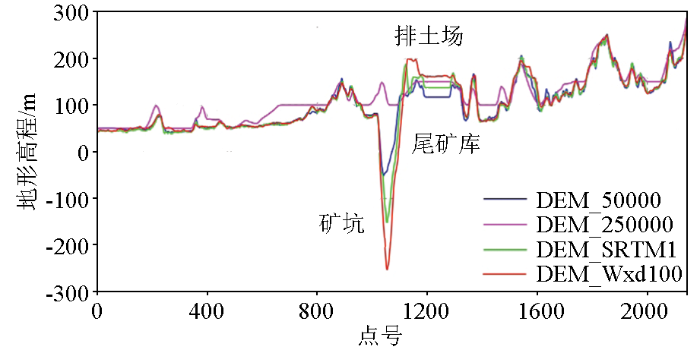
图1
测线L1710上部分搜集DEM数据与实测地形对比
Fig.1
Comparison of DEM data collected on survey line L1710 with actual topography
1.2 实测地形数据制作
1.2.1 实测地形测量原理
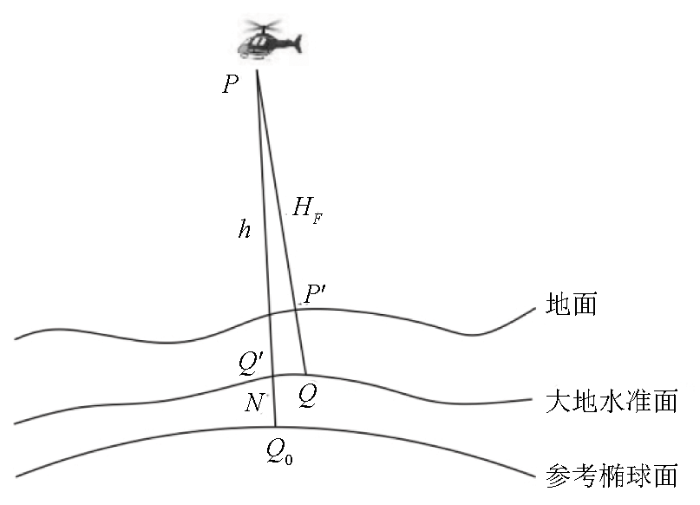
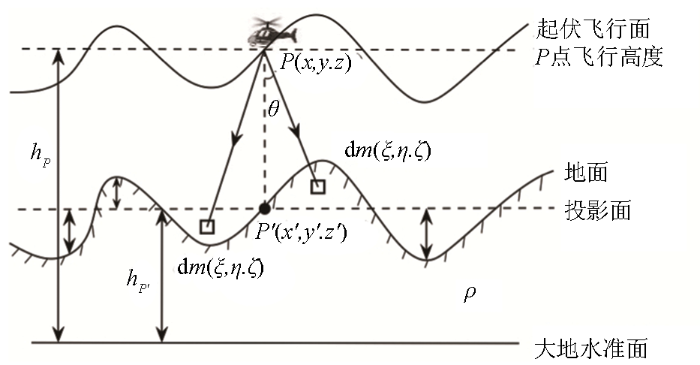
无线电雷达高度计作为指导飞机保持一定离地高度飞行的一种辅助设备,经常使用在航空物探低空起伏飞行中。它测得的是飞机离地面的高度,称为净空高度HF,它与正高H、大地高h、地形高HT及大地高到正高的改正值N之间的关系,如图2所示。P为测线上的一点,PP'=HF,PQ=H,P'Q=HT,PQ0=h,Q'Q0=N,若忽略垂线偏差的影响,几何关系如下:
式(2)表明,若测得飞机的GNSS大地高和离地净空高度,可获得飞机测点下方对应的地形高数据。然而,航空重力测量主要用于测定地面作业困难地区的地球重力场[16],而部分区域的DEM往往更新程度不够,难以实际应用。
图2
1.2.2 实测地形处理与实现
根据上述测量原理,首先从正、反方向重复测线的错位地形曲线中确定无线电高度数据的滞后时间,进行滞后校正后获得初步实测地形,见图3a。图中存在着明显的水平条带差异,与航空地球物理勘探中的航空磁法、航空重力等情况不尽相同,但均表现为一系列沿测线方向的条带状干扰,采用航空地球物理中常用的切割线调平和微调平方法,并设置适宜的调平参数,可以处理条带干扰问题。
图3
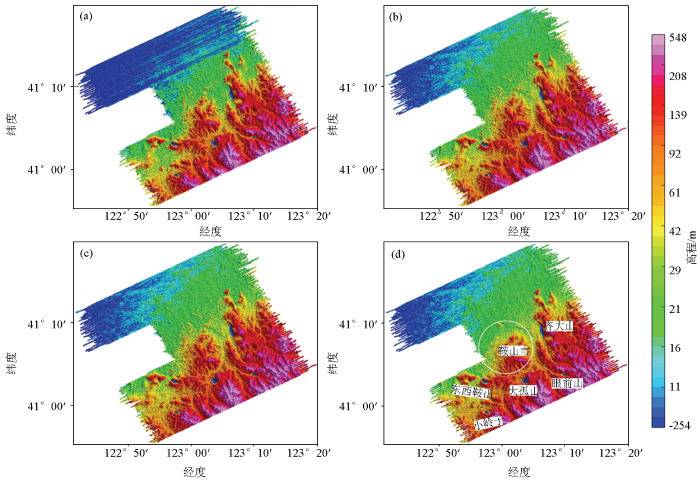
图3
实测地形处理过程
a— 初步实测地形;b—切割线调平后实测地形;c—微调平后实测地形;d—剥离城市高楼后实测地形
Fig.3
Actual surveyed terrain processing
a—initially obtain the actual surveyed terrain; b—actual surveyed terrain is levelled by the tie-line; c—actual surveyed terrain is levelled by microlevelling process; d—actual surveyed terrain after stripping off tall buildings
其中:式(3)是频率域α方向上n阶方向滤波器;式(4)是n阶高通巴特沃斯滤波器;θ、k分别是圆波数和波数;k0对应高通滤波的波数。α应选择沿测线方向,通常方向滤波器阶数取2,巴特沃斯滤波器阶数取6,波长为4~10倍测线间距(此处设置4,数据质量越差参数依次增大)。按照上述滤波器组合提取图3b中的剩余条带,图4则为提取的残留水平差,可以看出提取的并非只有条带干扰,还包含大量的低幅高频DEM信息,与图3b的DEM轮廓基本一致。由于噪声干扰和DEM信息所处的频带通过频率域滤波不可能彻底分离,还需进一步提取和分离条带干扰。此处使用Naudy等提出的非线性滤波处理方法[22],其中Naudy滤波长度为测线间距的5倍,高程幅值的滤波阈值设为2 m,如图5所示已剔除DEM高程轮廓信息的条带干扰,也可以通过多项式拟合、样条插值和中值滤波等方法处理[23]。经过一次微调平后,测线间尚残存少量的水平差,可重复上述过程直至获得合理的结果,如图3c。由于微调平处理并不针对特定航空地球物理资料,条带干扰不管是飞行高度差异还是仪器等其他因素引起,方法本身均适用。
通过无线电高度计测量获取的是地表高程,城市高楼和高大植被等地表信息也都包含在实测地形中,这些信息也会影响到地形改正。因此,参考多个不同时期的高分辨率DEM数据,以早期1:5万DEM和SRTM1数据为主,对鞍山市区超过20 m以上的小高层、高层建筑进行替换或剥离,如图3d所示。
图4
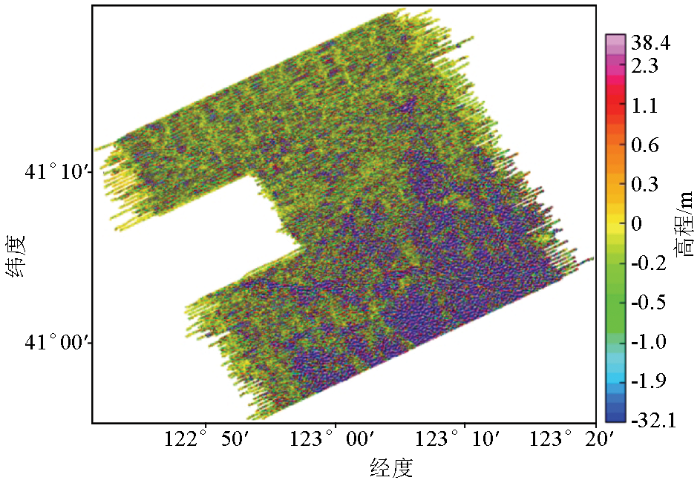
图5
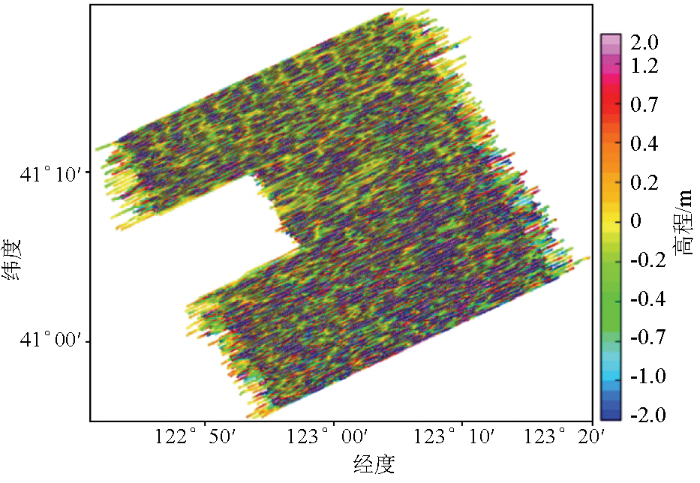
图5
Naudy非线性滤波提取条带干扰
Fig.5
Extracted striping patterns by Naudy non-linear filter
图6
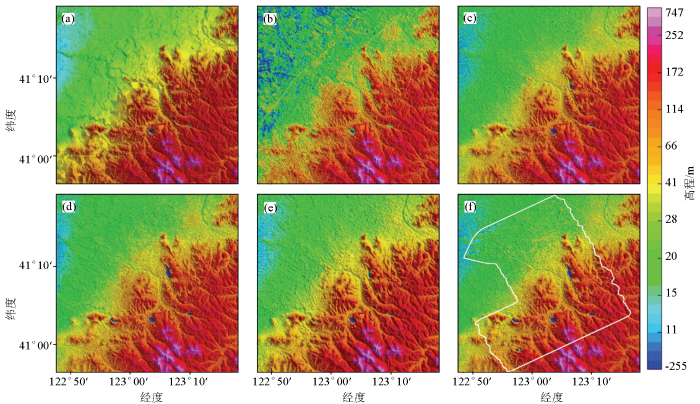
图6
多源DEM数据与缝合SRTM1后的实测地形数据
a—1:5万地形数据;b—ASTER数据;c—SRTM1数据;d—AW3D30数据;e—SRTM3数据;f—实测地形与SRTM1缝合
Fig.6
Multi-source DEM data and the actual surveyed terrain after stitching SRTM1
a— 1:50000DEM; b—ASTER; c—SRTM1; d—AW3D30; e—SRTM3; f—actual surveyed terrain was stitched with SRTM1
1.3 地形数据精度评价
1.3.1 实测地形测量分项评价
表2 定位静态观测标准差(STD)统计
Table 2
| 序号 | 东向距/m | 北向距/m | 高度/m | 水平面/m | |
|---|---|---|---|---|---|
| 单点GNSS基站 | 1 | 0.699 | 0.995 | 2.315 | 1.216 |
| 2 | 0.599 | 1.395 | 2.632 | 1.519 | |
| 3 | 0.565 | 1.390 | 2.366 | 1.500 | |
| 单点GNSS移动站 | 1 | 1.292 | 2.817 | 4.839 | 3.099 |
| 2 | 1.071 | 2.241 | 3.268 | 2.484 | |
| 3 | 1.061 | 1.817 | 3.456 | 2.104 | |
| DGNSS移动站 | 1 | 0.010 | 0.007 | 0.006 | 0.012 |
| 2 | 0.002 | 0.003 | 0.006 | 0.003 |
雷达高度计作为一种成熟的传感器在航空领域已经有70多年的应用历史,是通过无线电波的反射来测量高度的设备,它由发射、接收装置组成。本文测量系统中搭载美国Trimble公司TRA-3000雷达高度计,根据离地200 m起伏飞行高度,由说明书提供的7%离地误差公式推算,测量精度小于14 m。
1.3.2 实测地形动态测量评价
图7
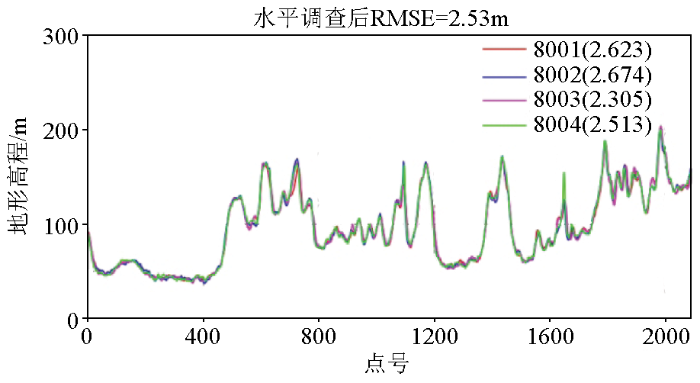
图7
地形高程重复线内符合精度统计
Fig.7
Internal accuracy statistics for repeated lines of elevation
表3 实测地形中测网交叉点统计
Table 3
| Wxd400 | Wxd100 | |
|---|---|---|
| 交叉点/个 | 609 | 4762 |
| Min/m | -33.15 | -91.7 |
| Max/m | 67.75 | 98.6 |
| ME/m | 0.03 | 0.61 |
| STD/m | 5.71 | 7.97 |
| RMSE/m | 5.71 | 7.99 |
| 总精度/m | 4.04 | 5.65 |
1.3.3 基于ICESat-2/ATLAS下的高程精度评价
ICESat-2/ATLAS是目前高程精度最高的星载激光数据,能够作为生产高精度全球地面参考高程的基础数据。2018年9月,美国国家航空航天局(NASA)发射了ICESat-2卫星,其搭载的激光载荷——先进地形激光测高系统(ATLAS),相比ICESat-1/GLAS具有更高的精度和更小的激光足印,足印直径约为17 m,沿轨足印间距0.7 m,采用6波束激光对地面探测,每两束强、弱一组,两束相间90 m,每组相间约3.3 km[28]。强弱光束形成交叉测量,能够有效提高对坡度和地表高程变化的检测能力[29],高程精度由1代的15 cm提升到10 cm,完全满足对搜集的多源DEM数据和实测地形高程精度评价的需求。
本文使用2021年4月发布的ICESat-2/ATL08高程V4版本,存储了陆地高程和冠层高度数据,覆盖范围为全球,下载网站
图8
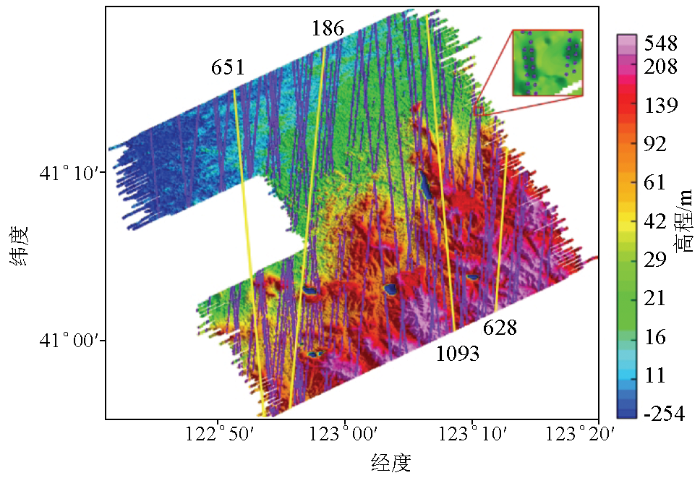
图8
轨道上ATL08激光数据在实验区分布
Fig.8
Map of ATL08 Laser data on the track in the experimental area
从激光束中提取ATL08高程后,分别与Wxd100、Wxd400、1:5万DEM和免费开放的DEM数据(SRTM1、AW3D30、ASTER和SRTM3)进行高程精度统计。ICESat-2测高数据的精度与成像时间、坡度、地表覆盖、信噪比等因素有关,其中高程精度随坡度的上升而显著下降;夜晚观测数据的高程精度高于白天;裸地的高程精度高于植被覆盖的区域,植被覆盖率越高,高程精度越低[30]。表4中调整前的统计结果,则保留了矿场周边和城市区域的ATL08数据,Wxd100表明实测数据质量确实好于所有收集的数据。为进一步验证实测数据与其余DEM的质量水平,剔除了形变大的区域和含有跳点的ATL08数据,保留率约87%;调整后统计Wxd100的高程精度(RMSE)好于ASTER,略低于其他DEM;Wxd400的高程精度与ASTER相当,低于其他DEM。
表4 基于ICESat-2/ATL08下的多源DEM数据统计
Table 4
| Wxd100 | Wxd400 | SRTM1 | AW3D30 | ASTER | 1:5万 | SRTM3 | ||
|---|---|---|---|---|---|---|---|---|
| 调整前 | 点数/个 | 22162 | 20456 | 22745 | 22745 | 22745 | 22745 | 22745 |
| Min/m | -116.87 | -111.62 | -125.98 | -123.49 | -125.37 | -142.56 | -123.73 | |
| Max/m | 149.7 | 149.24 | 230.99 | 228.2 | 226.68 | 284.35 | 229.89 | |
| ME/m | 1.54 | 2.42 | -0.75 | 2.1 | -4.2 | -0.46 | -0.31 | |
| STD/m | 9.79 | 12.33 | 14.88 | 11.24 | 14.59 | 17.86 | 14.92 | |
| RMSE/m | 9.91 | 12.56 | 14.90 | 11.43 | 15.18 | 17.87 | 14.93 | |
| 调整后 | 点数/个 | 19279 | 17720 | 19848 | 19848 | 19848 | 19848 | 19848 |
| Min/m | -27.13 | -83.83 | -24.84 | -21.56 | -55.45 | -38.24 | -27.56 | |
| Max/m | 44.9 | 80.03 | 37.94 | 49.86 | 39.72 | 53.54 | 35.72 | |
| ME/m | 1.37 | 2.4 | -0.51 | 2.08 | -4.09 | -0.05 | -0.06 | |
| STD/m | 5.15 | 8.60 | 3.66 | 3.78 | 7.84 | 4.39 | 4.07 | |
| RMSE/m | 5.33 | 8.93 | 3.69 | 4.31 | 8.84 | 4.39 | 4.07 | |
| 采集时间 | 2013.10~2014.1 | 2013.12~2014.1 | 2000.2 | 2006~2011 | 1999~2008 | 不详 | 2000.2 |
又经过地形分类,分别对平原、丘陵山区的区域进行了精度统计。表5表明,两个实测地形的平原地区精度好于3 m,远优于ASTER,与其他DEM精度相当;而实测地形的丘陵、山区地带的精度下降程度高于其他DEM。在丘陵、山区中,SRTM1<SRTM3<AW3D30<1:5万DEM,精度依次降低,但相差不大;Wxd100的高程精度略低于前4种地形数据,Wxd400的高程精度稍差于ASTER。
表5 基于ICESat-2/ATL08下的多源DEM数据分区统计
Table 5
| Wxd100 | Wxd400 | SRTM1 | AW3D30 | ASTER | 1:5万 | SRTM3 | ||
|---|---|---|---|---|---|---|---|---|
| 丘陵 及山区 | 点数/个 | 9894 | 9048 | 10220 | 10220 | 10220 | 10220 | 10220 |
| Min/m | -27.13 | -83.83 | -24.84 | -21.56 | -55.45 | -38.24 | -27.56 | |
| Max/m | 44.9 | 80.03 | 37.94 | 49.86 | 38.37 | 53.54 | 35.72 | |
| ME/m | 2.48 | 3.62 | 0.3 | 2.61 | -6.71 | 1.33 | 0.8 | |
| STD/m | 6.71 | 11.74 | 4.75 | 4.83 | 8.35 | 5.69 | 5.40 | |
| RMSE/m | 7.15 | 12.28 | 4.76 | 5.49 | 10.71 | 5.84 | 5.46 | |
| 平原 | 点数/个 | 9313 | 8613 | 9547 | 9547 | 9547 | 9547 | 9547 |
| Min/m | -10.45 | -15.84 | -14.84 | -9.24 | -25.31 | -15.87 | -14.98 | |
| Max/m | 35.01 | 49.27 | 16.46 | 46.54 | 39.72 | 20.52 | 17.1 | |
| ME/m | 0.21 | 1.13 | -1.35 | 1.54 | -1.21 | -1.49 | -0.96 | |
| STD/m | 2.14 | 2.23 | 1.52 | 2.07 | 6.08 | 1.20 | 1.29 | |
| RMSE/m | 2.15 | 2.50 | 2.03 | 2.57 | 6.20 | 1.91 | 1.60 |
2 航空布格重力改正及评价方法
2.1 航空重力地形改正原理
图9
其中G为万有引力常数;θ为P点与dm连线到Z轴的夹角,
上述公式计算复杂,一般采用近似积分的方法将投影测点P'为中心的四周地形再次分割成许多小块,计算出每一小块地形质量对测点P的重力改正值,然后累加求和便得到该点的地形改正值。
航空重力地形改正目前国内没有明确的要求,主要参考地面重力规范。本文使用加拿大商业地球物理软件Oasis Montaj地形改正模块处理,航空重力异常地形改正通常分为局部地形改正范围和区域地形改正范围,局部地改范围半径应在0~20 km,区域地改范围半径应在20~166.7 km之间不等,一般根据地形特点、任务要求选择最远半径 [31]。
2.2 航空布格重力计算
通过合并地形改正值和中间层改正值就获得布格重力改正值,采用直升机航空重力的波长分辨率(飞行速度除以2倍的滤波截止频率[32])对改正值进行滤波,航空重力异常减去改正值就获得航空布格重力异常。中间层改正和航空布格重力的计算公式来自Oasis Montaj地改模块说明书:
其中,gsb为布格改正值;ρ为岩石密度;ρw为水密度;ρi为冰密度;hs为观测点到平均海平面的高度;hw为水深(包括冰厚度);hi为冰厚度;gb为航空布格重力异常; g为航空重力异常值;gt为地形改正值。
2.3 航空布格重力质量评价
2.3.1 航空布格重力外符合精度评价
利用已认可仪器测量出的物理场或由地面物探仪器测量数据向上延拓到同一测量高度上,与测线上航空重力场值进行对比,评价测线航空重力质量[25]。具体做法:将某测线上测点的航空重力场值与其对应的地面标准场向上延拓到飞行高度后的差值,同时将测线对应标准场的水平均值作为基准去调整测线重力场的水平差,统计去水平后差值的均方根差,计算公式为:
(=1,2, …, ),
其中,n为测线与对应标准场的重复线公共段的测点数;Fi为测线上各测点的观测值;Pi为测线上各测点对应的标准场。
2.3.2 航空布格重力外符合总精度评价
上述外符合精度评价针对某条测线,而对所有测线或测区进行航空重力面积性外符合总精度评价,计算过程与式(8)类同,处理对象有所区别。其中,n为所有测线与对应标准场公共的测点数,Fi为所有测线上各测点的观测值,Pi为所有测线上各测点对应的标准场,
3 实验结果与分析
本文使用了1:5万DEM、ASTER、SRTM1、AW3D30和SRTM3地形数据,分别设为A1~A5;制作的实测地形Wxd100与上述地形数据进行缝合后,分别设为B1~B5;Wxd400与SRTM1缝合设为B6。分别对这些地形数据展开航空重力布格改正,对地面1:5万大比例尺重力数据采用快速傅里叶变换(FFT)向上延拓至200 m飞行高度,并进行外符合评价。
表6 不同地形数据改正下的航空布格重力外符合总精度
Table 6
| 序号 | 高程地形 | 分辨率/m | 外符合总精度/ (10-5m· | 采集时间 |
|---|---|---|---|---|
| A1 | 1:5万 | 25 | 1.159 | 早于2000 |
| A2 | ASTER | 30 | 1.305 | 1999~2008 |
| A3 | SRTM1 | 30 | 1.098 | 2000.2 |
| A4 | AW3D30 | 30 | 1.063 | 2006~2011 |
| A5 | SRTM3 | 90 | 1.097 | 2000.2 |
| B1 | 1:5万_Wxd100 | 25 | 1.056 | 测区同步 |
| B2 | ASTER_Wxd100 | 30 | 1.090 | 测区同步 |
| B3 | SRTM1_Wxd100 | 30 | 1.054 | 测区同步 |
| B4 | AW3D30_Wxd100 | 30 | 1.057 | 测区同步 |
| B5 | SRTM3_Wxd100 | 90 | 1.056 | 测区同步 |
| B6 | SRTM1_Wxd400 | 30/80 | 1.059 | 测区同步 |
表7 对应地形之间的布格重力差值统计
Table 7
| B1~A1 | B2~A2 | B3~A3 | B4~A4 | B5~A5 | A5~A3 | B6~B3 | |
|---|---|---|---|---|---|---|---|
| Min/(10-5m· | -5.281 | -2.329 | -3.800 | -1.356 | -3.746 | -0.122 | -0.562 |
| Max/(10-5m· | 4.887 | 2.646 | 3.693 | 1.194 | 3.728 | 0.019 | 0.524 |
| ME/(10-5m· | -0.206 | -0.608 | -0.201 | 0.063 | -0.177 | -0.048 | -0.061 |
| STD/(10-5m· | 0.589 | 0.581 | 0.420 | 0.242 | 0.412 | 0.007 | 0.126 |
图10
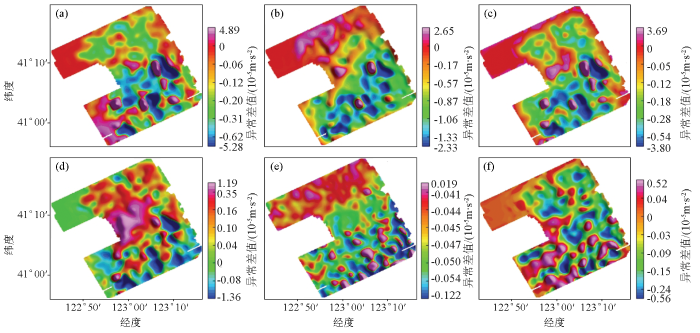
图10
对应地形之间的布格重力异常差值
Fig.10
Difference map of Bouguer gravity anomaly difference between two DEM data
a—B1~A1; b—B2~A2; c— B3~A3;d—B4~A4;e—A5~A3; f— B6~B3
表8 典型测线在不同地形数据改正下的航空布格重力外符合精度
Table 8
| 线号 | 1:5万 | SRTM1 | AW3D30 | 1:5万_Wxd100 | SRTM1_Wxd100 | AW3D30_Wxd100 | SRTM1_Wxd400 | 地形改变 |
|---|---|---|---|---|---|---|---|---|
| L1990 | 0.801 | 0.669 | 0.645 | 0.649 | 0.646 | 0.650 | 0.680 | 排土场 |
| L2070 | 1.077 | 0.863 | 0.811 | 0.785 | 0.786 | 0.786 | 0.800 | 矿坑、尾矿库 |
| L2110 | 1.080 | 0.913 | 0.874 | 0.862 | 0.862 | 0.861 | 0.870 | 矿坑、尾矿库 |
| L2230 | 1.126 | 0.915 | 0.677 | 0.644 | 0.645 | 0.645 | 0.672 | 尾矿库、城市建筑 |
| L2270 | 1.351 | 1.104 | 0.783 | 0.672 | 0.673 | 0.677 | 0.720 | 尾矿库、排土场 |
| L2550 | 1.870 | 1.592 | 1.141 | 1.044 | 1.041 | 1.047 | 0.905 | 矿坑、排土场 |
| L2590 | 1.849 | 1.565 | 1.059 | 0.947 | 0.945 | 0.951 | 0.933 | 矿坑、排土场 |
| T9130 | 1.561 | 1.361 | 0.974 | 1.064 | 1.036 | 1.056 | 1.084 | 两处矿坑 |
| T9140 | 1.699 | 1.308 | 0.747 | 0.672 | 0.672 | 0.676 | 0.665 | 排土场、尾矿库 |
图11
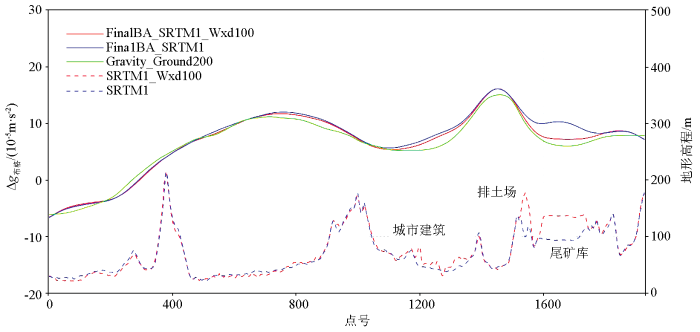
图11
测线L2270的航空布格重力异常对比
Fig.11
Comparison of airborne Bouguer gravity anomaly on L2270
4 结论
本文通过GNSS高度数据和雷达高度计获取地形数据,结合多源DEM数据进行质量评价后,并进行航空重力布格改正,得出以下结论:
1)采用GNSS高度数据和雷达高度计获取地形数据的方法,不仅作为航空重力测量中副产品没有额外成本,而且解决了航空重力地形改正中重力数据与地形数据同步匹配的难题。同时,对实测地形的调平处理中采用了Naudy非线性滤波分离了条带干扰,有效保留了低幅高频信息,提升了实测地形的高程精度。
2)实测地形的重复线内符合统计精度为2.53 m;Wxd100的测网交叉点的总精度为5.65 m,与基于高质量ICESat-2/ATL08下的RMSE为5.33 m较为接近;Wxd400的测网交叉点总精度为4.04 m,而基于激光数据下的RMSE为8.93 m,偏差较大的原因为Wxd400测线间距过稀网格插值所致。使用不同的评价方法有其适用性,评价结果较为可靠。
3)在实验区和丘陵、山区中实测地形精度,SRTM1<SRTM3<AW3D30<1:5万DEM<Wxd100,精度依次降低,分别为3.69、4.07、4.31、4.39、5.33 m和4.76、5.46、5.49、5.84、7.15 m,实测地形Wxd100的精度略低于前几种地形,但相差不大。SRTM3作为90 m分辨率地形数据的精度优于AW3D30和1:5万DEM,它们均可用于实测地形的外围数据中。而ASTER数据存在较多异常的高程值,对地形表达的准确性远不如前者们。
4)统计了地形数据1:5万DEM、ASTER、SRTM1、AW3D30和SRTM3,分别对应的航空布格重力外符合总精度,在高程精度相当的前提下,布格重力改正质量的高低与使用的地形数据生产时间离航空重力测量时间的远近有关。缝合实测地形Wxd100和Wxd400后,所有地形对应的布格重力质量都获得了一定的提升。SRTM3的分辨率比SRTM1降低了,但对应的布格重力质量没有降低。实测地形Wxd100和Wxd400在缝合SRTM1后,400 m测线距的实测地形对应的布格重力质量略低于前者。
5)本文使用实测地形进行航空重力地形改正和中间层改正后获得航空布格重力异常,采用向上延拓地面布格重力与全区和多条测线进行布格重力的外符合精度评价,验证了实测数据的可靠性。表明航空重力测量作业中同步获取地形数据用于布格改正的方法有效且实用,可以消除矿山周边布格重力的假异常现象。
6)航空重力布格改正的质量主要取决于地形数据的质量,而实测地形高程精度局限于雷达高度计的精度、测线间距设计等原因。将来搭载像机载激光雷达更高精度的测高设备时,势必会获取与航空重力数据同步的厘米级地形数据,可以大幅度地提升航空重力布格改正精度。
参考文献
An historical review of airborne gravity
[J].
基于捷联惯性导航系统/差分全球定位系统的航空重力测量技术
[J].
Technology of airborne gravimetry based on SINS/DGPS
[J].
Airborne gravity measurements over mountainous areas by using a Lacoste & Romberg air-sea gravity meter
[J].
DOI:10.1190/1.1484525
URL
[本文引用: 1]

This paper introduces a new approach to airborne gravity data reduction well‐suited for surveys flown at high altitude with respect to gravity sources (mountainous areas). Classical technique is reviewed and illustrated in taking advantage of airborne gravity measurements performed over the western French Alps by using a LaCoste & Romberg air‐sea gravity meter. The part of nongravitational vertical accelerations correlated with gravity meter measurements are investigated with the help of coherence spectra. Beam velocity has proved to be strikingly correlated with vertical acceleration of the aircraft. This finding is theoretically argued by solving the equation of the gravimetric system (gravity meter and stabilized platform). The transfer function of the system is derived, and a new formulation of airborne gravity data reduction, which takes care of the sensitive response of spring tension to observable gravity field wavelengths, is given. The resulting gravity signal exhibits a residual noise caused by electronic devices and short‐wavelength Eötvös effects. The use of dedicated exponential filters gives us a way to eliminate these high‐frequency effects. Examples of the resulting free‐air anomaly at 5100‐m altitude along one particular profile are given and compared with free‐air anomaly deduced from the classical method for processing airborne gravity data, and with upward‐continued ground gravity data. The well‐known trade‐off between accuracy and resolution is discussed in the context of a mountainous area.
Airborne gravimetry from a small twin engine aircraft over the long island sound
[J].
DOI:10.1190/1.1443170
URL
[本文引用: 1]
In January 1990, a test of the feasibility of airborne gravimetry from a small geophysical survey aircraft, a Cessna 404, was conducted over the Long Island Sound using a Bell Aerospace BGM-3 sea gravity meter. Gravity has been measured from large aircraft and specially modified de Havilland Twin Otters but never from small, standard survey aircraft. The gravity field of the Long Island Sound is dominated by an asymmetric positive 30 mGal anomaly which is well constrained by both marine and land gravity measurements. Using a Trimble 4000 GPS receiver to record the aircraft’s horizontal position and radar altimeter elevations to recover the vertical accelerations, gravity anomalies along a total of 65 km were successfully measured. The root mean square (rms) difference between the airborne results and marine measurements within 2 km of the flight path was 2.6 mGal for 15 measured values. The anomalies recovered from airborne gravimetry can also be compared with the gridded regional free air gravity field calculated using all available marine and land gravity measurements. The rms difference between 458 airborne gravity measurements and the regional gravity field is 2.7 mGal. This preliminary experiment demonstrates that gravity anomalies, with wavelengths as short as 5 km, can be measured from small aircraft with accuracies of 2.7 mGal or better. The gravity measurements could be improved by higher quality vertical and horizontal positioning and tuning the gravimeter’s stabilized platform for aircraft use.
Requirements for airborne vector gravimetry
[C]//
Comparison of AIRGrav and GT-1A airborne gravimeters for research applications
[J].
GT-1A and GT-2A airborne gravimeters:Improvements in design,operation,and processing from 2003 to 2010
[C]//
A global assessment of the SRTM performance
[J].DOI:10.14358/PERS.72.3.249 URL [本文引用: 1]
Precise global DEM generation by ALOS PRISM
[J].
2000国家大地坐标系椭球参数与GRS80和WGS84的比较
[J].
Parameters of the CGCS 2000 ellipsoid and comparisons with GRS 80 and WGS 84
[J].
1985国家高程基准相对于大地水准面的垂直偏差
[J].
The orgin vertical shift of national height datum 1985 with respect to the geoidal surface
[J].
1985国家高程基准与全球似大地水准面之间的系统差及其分布规律
[J].
The systematic difference and its distribution between the 1985 national height datum and the global quasigeoid
[J].
1985国家高程基准与全球高程基准之间的垂直偏差
[J].
The vertical shift between 1985 national height datum and global vertica datum
[J].
区域与全球高程基准差异的确定
[J].
Determination of vertical datum offset between the regional and the global height datum
[J].
航空重力测量中激光测高数据的处理与应用
[J].
Laser altimetric data for airborne gravimetry:processing and application
[J].
Statistical estimation of systematic errors at intersections of lines of aeromagnetic survey data
[J].DOI:10.1029/JB075i008p01507 URL [本文引用: 1]
Diurnal drift removal from aeromagnetic data using least squares
[J].
DOI:10.1190/1.1440884
URL
[本文引用: 1]
A relatively simple method of diurnal drift removal from aeromagnetic data which does not require the use of a base station is presented. The underlying assumption is that diurnal drift during flight is a smoothly varying low order polynomial in time. The polynomial coefficients are determined by minimizing residuals at flight‐line/tie‐line intersections using least squares. This procedure is applied to a conventional sensitivity aeromagnetic survey in northeastern Kansas. The results of the drift determinations compare favorably with independent knowledge of actual drifts such as the magnetic K indices and other measurements.
A comparison of adjustment procedures for leveling aeromagnetic survey data
[J].
DOI:10.1190/1.1441504
URL
[本文引用: 1]
Two techniques for leveling aeromagnetic survey data are compared. The first estimates a set of values for the magnetic intensity at each flight‐line/tie‐line intersection point. These are obtained after an intersection‐moving procedure to reduce loop closures and are subject to the constraint that the datums calculated from the differences between the raw data and the corrected data have minimum along‐line variation. The procedure (a least‐squares method) is equivalent to the older manual loop closure methods used for magnetic, gravimetric, and geodetic surveying. The second method involves the fitting of polynomials to the observed flight‐line/tie‐line intersection errors along each line in the survey. These are then subtracted from the raw data and intersection locations are adjusted to give minimum intersection errors. In the analysis of two surveys the least‐squares method was found to be superior as a leveling procedure. It produced datums which were similar in amplitude and had a high correlation with the base station magnetometer recordings. The polynomial method produced datums which had greater amplitudes and showed a tendency to fluctuate at the ends of lines.
Simple Micro-leveling for aeromagnetic data
[J].DOI:10.1071/EG991591 URL [本文引用: 1]
Microlevelling procedures applied to regional aeromagnetic data:An example from the transantarctic mountains (Antarctica)
[J].DOI:10.1046/j.1365-2478.1998.00080.x URL [本文引用: 2]
Essai de filtrage non-iineaire applique aux profils aeromagnetiques
[J].
航磁垂直梯度调整ΔT水平方法研究
[J].
Leveling total field aeromagnetic data with measured vertical gradient
[J].
数字地形模型数据获取方法及精度分析
[J].
The technique for acquisition of DTM data and an analysis of its precision
[J].
航空重力重复线测试数据质量评价方法研究
[J].
The research on quality evaluation method of test repeat lines in airborne gravity survey
[J].
航空重力测网交叉点的非遍历逼近方法
[J].
Non-ergodic approximation method for intersections of airborne gravity survey network
[J].
The ice,cloud and land elevation satellite-2 (ICESat-2):Science requirements,concept and implementation
[J].
ICESat-2机载试验点云滤波及植被高度反演
[J].
Point cloud filtering and tree height estimation using airborne experiment data of ICESat-2
[J].
ICESat-2/ATLAS全球高程控制点提取与分析
[J].
Extraction and analysis of global elevation control points from ICESat-2/ATLAS data
[J].
