Please wait a minute...
E-mail Alert Rss
 
物探与化探  2024, Vol. 48 Issue (3): 868-875    DOI: 10.11720/wtyht.2024.1060
  生态地质调查 本期目录 | 过刊浏览 | 高级检索 |
利用地面γ总量转换为空气吸收剂量率进行环境辐射水平评价——以桂阳县潘家村和永兴县土桥村实测数据为例
刘俊峰1(), 彭文彪1, 陶峰1, 孟繁星1, 韦光景1, 刘虹1, 邓居智2, 陈辉2, 付宸2, 王培建3
1.湖南省核地质调查所,湖南 长沙 410008
2.东华理工大学 地球物理与测控学院,江西 南昌 330013
3.核工业航测遥感中心,河北 石家庄 050000
Assessing radiation levels in the environment by converting total natural gamma radiation into the absorbed dose rate in air: A case study of measured data from Panjia Village, Guiyang County and Tuqiao Village, Yongxing County
LIU Jun-Feng1(), PENG Wen-Biao1, TAO Feng1, MENG Fan-Xing1, WEI Guang-Jing1, LIU Hong1, DENG Ju-Zhi2, CHEN Hui2, FU Chen2, WANG Pei-Jian3
1. Nuclear Geological Survey of Hunan, Changsha 410008, China
2. School of Geophysics and Measurement-Control Technology, East China University of Technology, Nanchang 330013, China
3. Airborne Survey and Remote Sensing Center of Nuclear Industry, Shijiazhuang 050000, China
全文: PDF(1798 KB)   HTML
输出: BibTeX | EndNote (RIS)      
摘要 

在长期的铀矿普查中,我国积累了海量的γ总量数据资料,但应用这些数据进行放射性环境评价的研究极少。本文从γ总量和空气吸收剂量率的测量原理出发,通过梳理γ总量、放射性核素含量与空气吸收剂量率之间的关系,建立起地面γ总量与空气吸收剂量率之间的联系,分析了仪器参数对测量误差的影响,认为γ总量仪器bK/bU=2.287、bTh/bU=0.430时,测量的γ总量与空气吸收剂量率满足严格线性关系,因此γ总量仪器的bK/bUbTh/bU值越接近这两个数值,测得的γ总量转换为空气吸收剂量率越准确;利用湖南省电离辐射计量站模型进行了γ总量转换为空气吸收剂量率的系数求解,并分析了误差,推测了仪器参数中钾的铀当量值、钍的铀当量值的大致范围;在郴州市桂阳县潘家村岩体和郴州市永兴县土桥村灰岩地区进行了γ总量、γ能谱、空气吸收剂量率的同点位实测,结果显示,当核素含量比CK/CU均值小于1、CTh/CU均值小于3时,利用γ总量(FD3013仪器测得)估算的空气吸收剂量率与利用Beck公式根据能谱估算的空气吸收剂量率的误差基本处于同等水平,均方根误差均小于15%。根据国内核素的CK/CUCTh/CU均值,认为国内大部分地区可以利用由FD3013仪器(或类似性能仪器)测得的γ总量数据估算空气吸收剂量率。利用已有铀矿普查资料中的γ总量数据转换计算有效空气吸收剂量率,为快速大面积评估环境天然放射性外照射水平提供了方法参考。

服务
把本文推荐给朋友
加入引用管理器
E-mail Alert
RSS
作者相关文章
刘俊峰
彭文彪
陶峰
孟繁星
韦光景
刘虹
邓居智
陈辉
付宸
王培建
关键词 γ总量γ能谱核素(铀、钍、钾)含量空气吸收剂量率    
Abstract

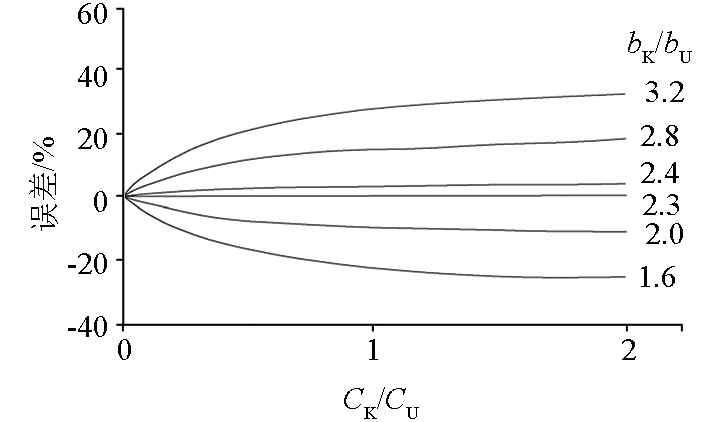
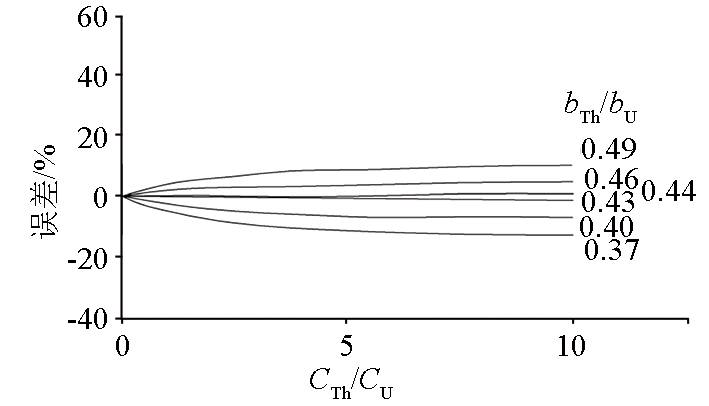
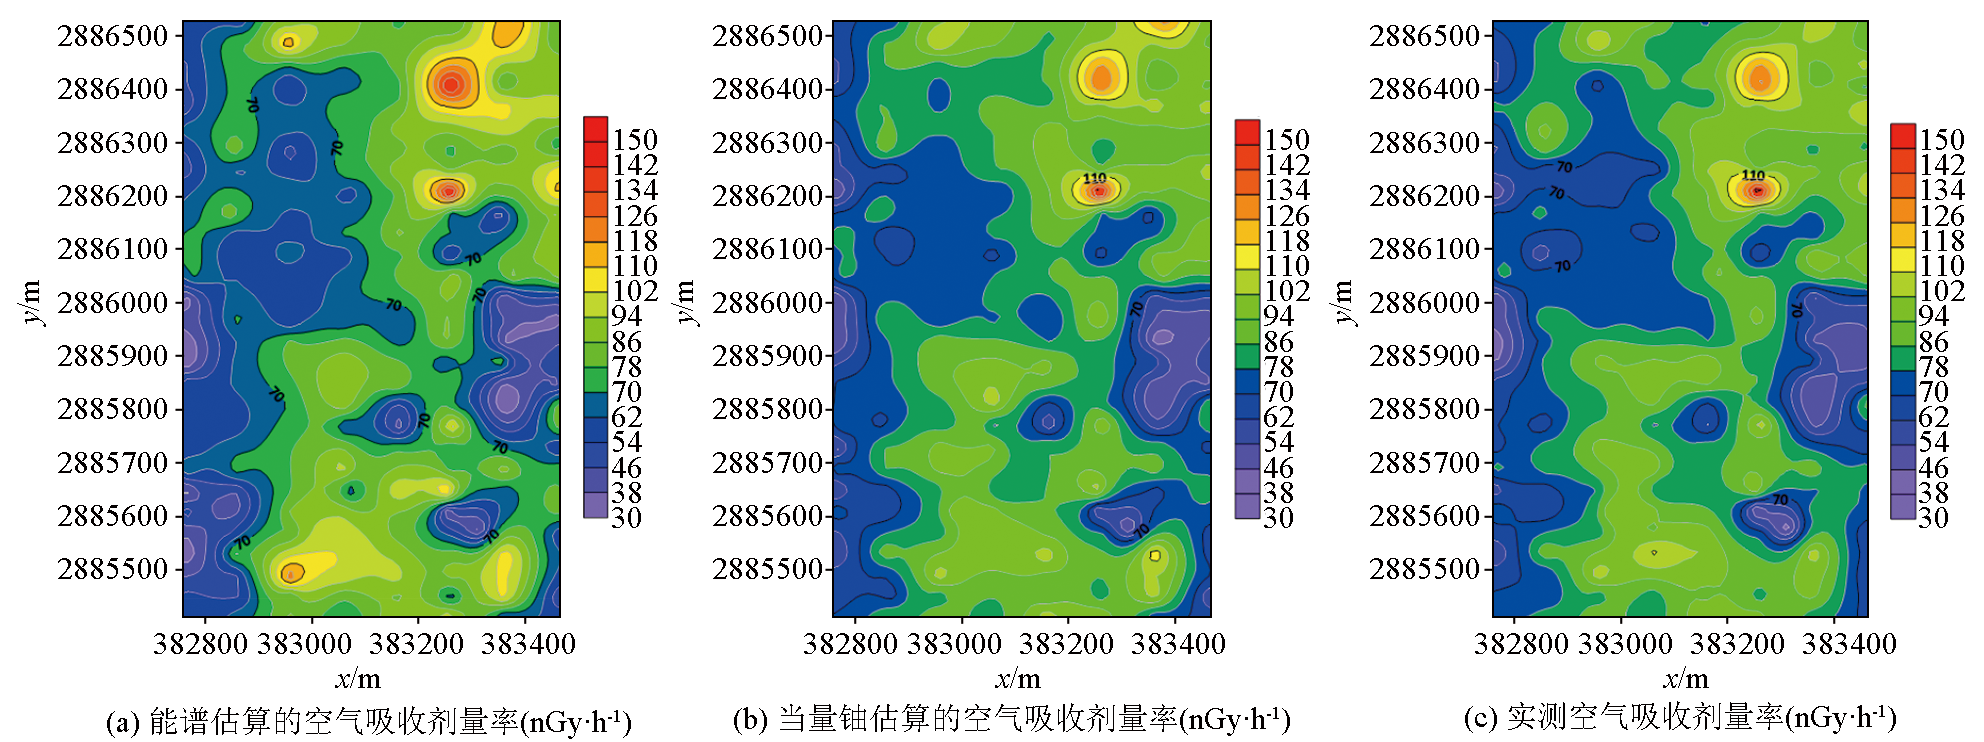
China has accumulated massive data on total gamma radiation (γ) from the prolonged extensive surveys of uranium deposits. However, there is a marked lack of studies on radioactive environment assessment using these data. Based on the measurement principles of total gamma radiation and the absorbed dose rate in air, this study ascertained the relationships of the absorbed dose rate in air with the total natural gamma radiation and nuclide content and, accordingly, established the relationship between total gamma radiation and the absorbed dose rate in air. Furthermore, it analyzed the effects of instrument parameters on the measurement error, concluding that there existed a strictly linear relationship between the measured total gamma radiation and the absorbed dose rate in the air when bK/bU = 2.287 and bTh/bU = 0.430. Therefore, the bK/bU and bTh/bU ratios closer to both values correspond to more accurate absorbed dose rates in air converted from the measured total gamma radiation. Using the model of the Hunan Ionizing Radiation Measuring Station, this study calculated the coefficient for converting total gamma radiation into the absorbed dose rate in air, analyzed the error, and deduced the approximate uranium equivalent ranges of potassium and thorium in the instrument parameters. Furthermore, for the rock mass in Panjia Village, Guiyang County, Chenzhou City and the limestone area of Tuqiao Village in Yongxing County of the city, this study measured the total gamma radiation, gamma spectra, and absorbed dose rates in the air at the same stations. The results show that when the average nuclide content ratio CK/CU was less than 1 and CTh/CU ratio was less than 3, the absorbed dose rates in air estimated based on the total gamma radiation (measured using the FD3013 instrument) shared roughly the same error levels with those estimated based on energy spectra using the Beck formula, both yielding root mean square errors below 15%. As inferred from the average CK/CU and CTh/CU ratios of nuclides in China, the absorbed dose rate in air in most areas of China can be estimated using the total gamma radiation measured using an FD3013 instrument (or an instrument with similar performance). Overall, converting the total gamma radiation data from available extensive surveys of uranium deposits into effective absorbed dose rates in the air provides a methodological reference for rapid, large-area assessment of the external exposure level of natural radioactivity in the environment.

Key wordstotal gamma radiation    gamma spectrum    content of nuclides (uranium, thorium, and potassium)    absorbed dose rate in air
收稿日期: 2023-02-13      修回日期: 2023-09-19      出版日期: 2024-06-20
ZTFLH:  TL751  
基金资助:湖南省地质院科研基金项目“铀矿区调资料在评价环境天然放射性水平中的应用研究”(HNGSTP202207)
作者简介: 刘俊峰(1986-),男,高级工程师,主要从事地质科研、生产工作。Email:563315851@qq.com
引用本文:   
刘俊峰, 彭文彪, 陶峰, 孟繁星, 韦光景, 刘虹, 邓居智, 陈辉, 付宸, 王培建. 利用地面γ总量转换为空气吸收剂量率进行环境辐射水平评价——以桂阳县潘家村和永兴县土桥村实测数据为例[J]. 物探与化探, 2024, 48(3): 868-875.
LIU Jun-Feng, PENG Wen-Biao, TAO Feng, MENG Fan-Xing, WEI Guang-Jing, LIU Hong, DENG Ju-Zhi, CHEN Hui, FU Chen, WANG Pei-Jian. Assessing radiation levels in the environment by converting total natural gamma radiation into the absorbed dose rate in air: A case study of measured data from Panjia Village, Guiyang County and Tuqiao Village, Yongxing County. Geophysical and Geochemical Exploration, 2024, 48(3): 868-875.
链接本文:  
https://www.wutanyuhuatan.com/CN/10.11720/wtyht.2024.1060      或      https://www.wutanyuhuatan.com/CN/Y2024/V48/I3/868
仪器 NaI(Tl)
晶体体积/cm3
能量阈值/
KeV
bK/bU bTh/bU
A 29 30 1.57 0.37
B 82 50 1.56 0.38
C 348 400 2.37 0.41
D 348 500 2.67 0.41
Table 1  不同体积的NaI(Tl)晶体探测器K、Th的铀当量[2]
Fig.1  仪器bK/bU值与核素CK/CU比对γ总量转换为空气吸收剂量率的误差影响[2]
Fig.2  仪器bTh/bU值与核素CTh/CU比对γ总量转换为空气吸收剂量率的误差影响[2]
模型类别 当量铀含量 空气吸收剂
量率(1m高)
含量
QeU/Ur (nGy·h-1) QK/
10-2
QU/
10-6
QTh/
10-6
YB-Ⅱ-ZN 10.72 34.94 0.40 2.50 5.11
YK-Ⅱ-ZN 20.04 98.65 5.36 3.23 8.66
YU2-Ⅱ-ZN 48.57 211.56 0.34 38.57 5.82
YU1-Ⅱ-ZN 158.25 706.40 0.31 140.61 8.79
YTh-Ⅱ-ZN 85.21 433.04 0.32 4.16 187.13
YM-Ⅱ-ZN 128.72 635.51 3.67 60.60 139.64
Table 2  湖南省电离辐射计量站模型标称数据
模型类别 贴近模型表面计算的总计数率/cps
仪器A 仪器B 仪器C 仪器D
YK-Ⅱ-ZN 14.74 14.88 19.48 21.09
YU2-Ⅱ-ZN 41.25 41.31 41.76 41.86
YU1-Ⅱ-ZN 144.34 144.43 144.95 145.04
YTh-Ⅱ-ZN 73.89 75.77 81.64 81.74
YM-Ⅱ-ZN 117.96 119.39 126.55 127.65
Table 3  利用标准模型K、U、Th 含量计算的总计数率
模型类别 贴近模型表面计算得到的当量铀含量/相对误差 标称当量铀/Ur
仪器A 仪器B 仪器C 仪器D
YK-Ⅱ-ZN 17.33/-13.52 17.32/-13.57 20.82/3.89 22.15/10.529 20.04
YU2-Ⅱ-ZN 48.49/-0.16 48.09/-0.99 44.64/-8.09 43.97/-9.47 48.57
YU1-Ⅱ-ZN 169.68/7.22 168.14/6.25 154.94/-2.09 152.36/-3.72 158.25
YTh-Ⅱ-ZN 86.86/1.94 88.21/3.52 87.26/2.41 85.87/0.77 85.21
YM-Ⅱ-ZN 138.67/7.73 138.99/7.98 135.27/5.09 134.09/4.17 128.72
均方根误差/% 5.46 4.99 3.12 4.40
Table 4  利用标准模型K、U、Th 含量计算的当量铀及误差
模型类别 当量铀估算离模型1m高的吸收剂量率/相对误差 标称空气吸收剂量
率/(nGy·h-1)
仪器A 仪器B 仪器C 仪器D
YK-Ⅱ-ZN 82.44/-16.43 82.38/-16.49 98.68/0.035 104.94/6.38 98.65
YU2-Ⅱ-ZN 230.7/9.05 228.69/8.1 211.55/-0.028 208.28/-1.55 211.56
YU1-Ⅱ-ZN 807.25/14.28 799.57/13.19 734.31/3.95 721.67/2.16 706.4
YTh-Ⅱ-ZN 413.24/-4.57 419.46/-3.14 413.58/-4.49 406.71/-6.08 433.04
YM-Ⅱ-ZN 659.72/3.81 660.95/4.00 641.1/0.88 635.14/-0.058 635.51
均方根误差/% 7.68 7.33 1.91 2.91
Table 5  根据系数将当量铀估算为空气吸收剂量率及误差
模型类别 当量铀QeU/Ur
仪器1316 仪器1299 仪器1320
YK-Ⅱ-ZN 20.33 19.97 19.66
YU2-Ⅱ-ZN 47.47 47.75 46.94
YU1-Ⅱ-ZN 156.62 156.71 158.67
YTh-Ⅱ-ZN 88.71 87.25 84.57
YM-Ⅱ-ZN 132.23 126.47 131.08
Table 6  仪器标定后在模型上的测值
模型类别 实测当量铀估算为离模型
1m高度的吸收剂量率/误差
标称空气吸
收剂量率/
(nGy·h-1)
1316 1299 1320
YK-Ⅱ-ZN 95.56/-3.13 95.32/-3.38 94.16/-4.55 98.65
YU2-Ⅱ-ZN 223.16/5.49 227.93/7.74 224.78/6.25 211.56
YU1-Ⅱ-ZN 736.39/4.25 748.02/5.89 759.89/7.57 706.4
YTh-Ⅱ-ZN 417.1/-3.68 416.49/-3.82 405.01/-6.47 433.04
YM-Ⅱ-ZN 621.71/-2.17 603.67/-5.01 627.76/-1.22 635.51
均方根误差/% 2.76 3.81 4.00
Table 7  根据系数将当量铀估算为空气吸收剂量率及误差
Fig.3  能谱、当量铀估算的空气吸收剂量率与实测空气吸收剂量率等值线
估算方式 测量地点 测量点位数量 |相对误差|/% 均方相对误差/%
最小值 最大值 平均值
利用Beck公式将γ能谱估算空气吸收剂量 桂阳县潘家村 257 0.0045 46.00 9.80 9.08
永兴县土桥村 244 0.22 45.24 12.94 9.26
利用FD3013测得的当量铀估算空气吸收剂量率 桂阳县潘家村 257 0.17 40.10 10.39 8.76
永兴县土桥村 244 0.06 46.76 12.01 10.20
Table 8  当量铀、γ能谱估算的空气吸收剂量率与实测空气吸收剂量率之间的误差分析
[1] Beck H L, DeCampo J, Gogolak C. In situ Ge(Li) and Na(Tl) gamma-ray spectrometry[R]. New York: Health and Safety Laboratory (AEC),1972.
[2] IAEA. The us of gamma ray data to definethe natural radiation environment[R]. Austria:IAEA,1990.
[3] Grasty R L. Airborne gamma ray spectrometer surveying[R]. Vienna:IAEA,1991.
[4] Podgorsak R B M B. Gamma-ray spectrometry in the environment[J]. Medical Physics, 1996, 23(2):281.
[5] 沈正新, 胡明考. 航放数据用于评价天然辐射水平的可行性研究[J]. 航测与遥感, 2002, 1(2):43-49.
[5] Shen Z X, Hu M K. Feasibility study on using airborne radiometric data to evaluate natural radiation levels[J]. Aerial and Remote Sensing, 2002, 1(2):43-49.
[6] 侯振荣, 顾仁康, 胡明考, 等. 利用已有航测找铀资料和技术方法评价天然辐射水平[J]. 辐射防护通讯, 2002, 22(3):23-26.
[6] Hou Z R, Gu R K, Hu M K, et al. Evaluatitlg natural radiation level by using existing airborne data for uranium prospecting[J]. Radiation Protection Bulletin, 2002, 22(3):23-26.
[7] 王南萍, 黄英, 肖磊, 等. 伽马能谱测量在陆地伽马空气吸收剂量率评价中的应用[J]. 物探与化探, 2004, 28(6):512-514,517.
[7] Wang N P, Huang Y, Xiao L, et al. The application of gamma-ray spectrometry to estimationg terrain gamma-ray dose in air[J]. Geophysical and Geochemical Exploration, 2004, 28(6):512-514,517.
[8] 黄元清. 城市环境天然放射性评价研究[D]. 成都: 成都理工大学, 2005.
[8] Huang Y Q. The Research on the evaluation of urban environmental natural radioactivity[D]. Chengdu: Chengdu University of Technology, 2005.
[9] 刘合凡, 曾兵, 侯克斌, 等. 成都市土壤天然放射性核素的外照射水平估算研究[J]. 环境监控与预警, 2009, 1(2):37-40.
[9] Liu H F, Zeng B, Hou K B, et al. Estimation of natural terrestrial external exposure levels of nuclides in soils in Chengdu[J]. Environmental Monitoring and Forewarning, 2009, 1(2):37-40.
[10] 葛良全, 赖万昌, 黄元清, 等. 运用1∶50 000化探数据评价天然放射性水平[J]. 成都理工大学学报:自然科学版, 2008, 35(3):323-327.
[10] Ge L Q, Lai W C, Huang Y Q, et al. Evaluation of natural radioactivity levels using 1∶50,000 geochemical data[J]. Journal of Chengdu University of Technology:Natural Science Edition, 2008, 35 (3):323-327.
[11] 李金凤, 刘合凡, 徐健, 等. 运用1∶25万化探数据进行区域天然放射性填图评价[J]. 铀矿地质, 2016, 32(2):110-116.
[11] Li J F, Liu H F, Xu J, et al. Regional evaluation and mapping of natural radioactivity with 1∶250,000 geochemical data[J]. Uranium Geology, 2016, 32(2):110-116.
[12] 余根锌. 福建省环境地表γ辐射剂量率估算与人居环境安全性评价[J]. 物探与化探, 2021, 45(1):192-199.
[12] Yu G X. The environmental terrestrial gamma-radiation dose rate estimation and the living environment safety evaluation in Fujian Province[J]. Geophysical and Geochemical Exploration, 2019, 45(1):192-199.
[13] 李家俊. 利用γ测量数据进行环境天然放射性水平调查研究[C]// 1995年中国地球物理学会第十一届学术年会论文集,1995:458.
[13] Li J J. Investigation of natural radioactivity level in the environment using gamma measurement data[C]// Proceedings of the 11th Annual Conference of Geophysical Society of China,1995:458.
[14] IAEA. Guidelines for radioelement mapping using gamma ray spectrometry data[R]. Austria:IAEA. 2013.
[15] 田义宗, 赵锋, 李钢. Beck公式在滨海新区辐射环境本底调查中的验证[J]. 中国辐射卫生, 2011, 20(3):336-337.
[15] Tian Y Z, Zhao F, Li G. Verification of Beck's formula in the background investigation of radiation environment in Binhai New Area[J]. China Radiation Health, 2011, 20 (3) :336-337.
[16] Beck H L, Adams J A S, Lowder W M, et al. Physics of environmental gamma radiation fields[J]. Natural Radiation Environment II, 1972, 9(1):120-125.
[17] Tanner A B. Radon migration in the ground:A supplementary review[J]. Natural Radiation Environment, 1978, 15(1):215-221.
[18] ICRU. Gamma-ray spectrometry in the environment[R]. Sweden:ICRU,1994.
[19] 罗国祯, 支仲骥, 王树明, 等. 中国环境天然放射性水平[M]. 北京: 地质出版社, 2005.
[19] Luo G Z, Zhi Z J, Wang S M, et al. Investigation of environmental natural radioactivity in China[M]. Beijing: Geological Publishing House, 2005.
[20] 程业勋, 王南萍, 候胜利. 核辐射场与放射性勘查[M]. 北京: 地质出版社, 2005.
[20] Cheng Y X, Wang N P, Hou S L. Nuclear radiation field and radioactive exploration[M]. Beijing: Geological Publishing House, 2005.
[21] 曹龙生, 杨亚新, 张叶, 等. 中国大陆主要省份土壤中天然放射性核素含量分布规律研究[J]. 东华理工大学学报:自然科学版, 2012, 35(2):167-172.
[21] Cao L S, Yang Y X, Zhang Y, et al. Distribution pattern of radionuclides in the soil of mainland China[J]. Journal of East China University of Technology:Natural Science Edition, 2012, 35(2):167-172.
[1] 陈元庆, 黄清波, 刘金尧, 王先贺, 黄亮, 吴伟军. 数字化γ能谱测井探管研制[J]. 物探与化探, 2024, 48(1): 210-215.
[2] 李敬敏, 米耀辉, 骆遥. NURE航空计划回顾与新时代航空γ能谱勘查启示[J]. 物探与化探, 2021, 45(2): 394-402.
[3] 王永飞, 李宝新, 曹云, 刘晨阳. 地球物理信息和控矿构造研究在乌克兰米丘林铀矿床中的应用[J]. 物探与化探, 2020, 44(1): 99-106.
[4] 金久强, 王金龙, 肖刚毅, 李健, 邓茂盛, 王志博, 蒋久明, 王启, 王鑫, 耿圣博. NASVD方法在航空γ能谱测量中的成图效果讨论[J]. 物探与化探, 2018, 42(4): 817-824.
Viewed
Full text


Abstract

Cited

  Shared   
  Discussed   
京ICP备05055290号-3
版权所有 © 2021《物探与化探》编辑部
通讯地址:北京市学院路29号航遥中心 邮编:100083
电话:010-62060192;62060193 E-mail:whtbjb@sina.com , whtbjb@163.com