

0 引言
传统高密度电阻率法的数据处理广泛采用二维反演技术[7-8]。该技术结合了2.5D正演与2D反演方案,以实现对实测视电阻率数据的快速稳健反演[9-10]。在2.5D正演模型中,通常假设电阻率在垂直于测线方向(y方向)上保持恒定,而电极则沿x方向线性布置,通过傅里叶变换进行高效的正演计算[11]。然而,在复杂地形条件下,电极的布置往往难以保持直线,这导致部分电极在y方向上的位置出现偏移。如果继续采用2.5D正演模型来近似实际的电极布置,可能会导致正演结果出现明显偏差,进而影响反演电阻率的准确性。随着计算机算力的快速增强,三维反演技术已逐步应用于高密度电阻率法的地质调查任务中[12-13]。三维反演方案通过有限元方法或有限差分方法实现三维正演,并利用平滑约束等先验信息优化反演过程[14]。该技术能够显著提升在实际地质调查中,任意电极布局下的视电阻率正演计算精度,并能有效处理更为复杂的地下结构的反演问题[15-16]。然而,算法的计算成本随着模型维度的增加而呈指数级增长,这使得其在时间消耗上面临较大挑战[17]。此外,当使用二维测线数据进行三维反演时,数据在y方向(垂直测线方向)的分辨率受限,这可能会影响到三维模型的准确性和可靠性。
本研究针对不规则测线反演问题的特点,提出了一种优化的三维反演方案。通过寻找测线最小包围面积矩形的坐标转换算法,实现3D模型的最少网格节点剖分,降低计算成本。此外,通过增加y方向平坦度矩阵的权重系数,提升反演结果的稳健性。数值模拟与白水河滑坡上的实测结果表明,该技术可有效提升在复杂地形条件下高密度电阻率法的应用效果。
1 不规则测线视电阻率数据的3D反演方法
1.1 最小化网格剖分节点
在实际调查中,滑坡体复杂的地形、广泛分布的植被和地表散落的巨石使得测线难以沿直线布置。此时,任意分布的电极节点在布置时必须使用GNSS RTK技术进行精确定位,其定位误差一般在10 cm以内[18]。在使用国内通用CGCS2000系统时,一系列电极的位置被记录为投影坐标(东坐标,北坐标)格式(见图1a)。此时,为了使模型尽可能小,需要寻找测线的最小包围面积矩形,并通过坐标转换将矩形的左下顶点平移至坐标原点,两条相邻边旋转至x方向与y方向(图1b)。然后,以新的坐标系统作为xy平面进行网格剖分(图1c)。其中,主要难点包括寻找最小包围面积矩形以及坐标转换。坐标旋转可通过构造旋转矩阵与线性算法实现,见式(1):
式中:x'、y'为新坐标;x、y为初始坐标最小包围面积矩形,可采用开源的Andrew's monotone chain算法实现[19]。在实际调查中,矩形也可根据地质情况选取,y方向应该选择电阻率变化更小的方向。
图1
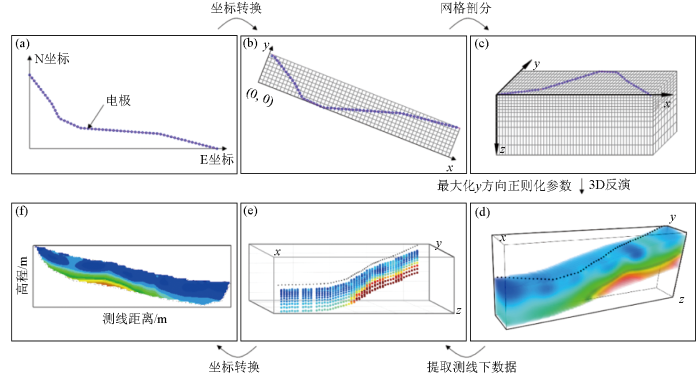
图1
不规则测线视电阻率数据的3D反演技术流程示意
a—投影坐标系下的电极分布;b—最小包围面积矩形与转换后的坐标系;c—转换坐标后的网格剖分;d—最大化y方向正则化参数后3D反演得到的电阻率模型;e—提取到的测线底部的电阻率数据;f—将e中坐标转为2D测线长度与高程的电阻率断面
Fig.1
Schematic of the 3D inversion process for resistivity data from irregular survey lines
a—the electrode distribution in the projected coordinate system; b—the minimum enclosing rectangular area and the transformed coordinate system; c—the grid division after coordinate transformation; d—the resistivity model obtained from 3D inversion after maximizing the regularization parameter in the y direction; e—the resistivity data extracted at the bottom of the survey line; f—the resistivity cross-section diagram where the coordinates in e are converted into 2D survey line length and elevation
1.2 3D反演方法
式中:J为雅克比矩阵,可通过互易定理计算。λ为阻尼系数向量,g为数据残差。FR为平坦度矩阵,可写为式(3):
2 数值模拟
2.1 模型建立
建立滑坡体模型如图2所示,滑坡体可分为堆积层与基岩两部分,其中堆积层电阻率设置为30 Ω·m,基岩电阻率设置为100 Ω·m。堆积层在滑坡上缘厚度较小,约为1.25 m,在下缘厚度逐渐增大至11 m。滑坡3D模型的x方向长度20 m,y方向长度2.5 m,假定滑坡结构电阻率在y方向上是无变化的。模型共设置电极21个,极距为1.03 m。受地形与障碍物的影响,测线在x=10 m,y=0 m位置处未能继续沿直线布置,转角约38°。
图2
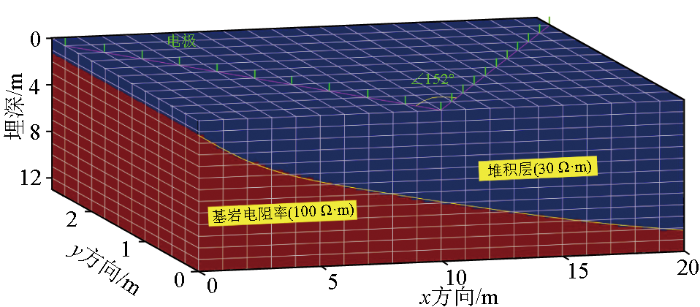
图2
滑坡体数值模型与不规则测线示意
Fig.2
Schematic of numerical model of landslide bodies and irregular survey lines
2.2 模型计算
图3
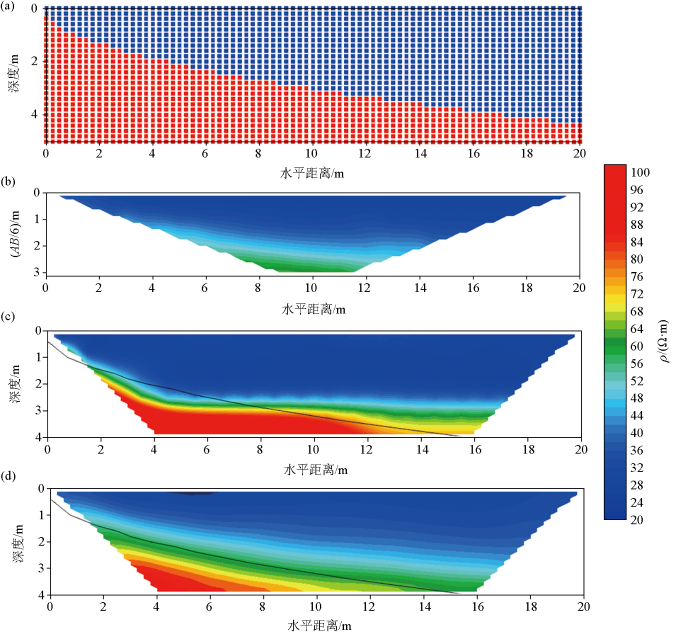
图3
数值模拟结果
a—测线底部电阻率模型,其中蓝色区域为30 Ω·m,红色为100 Ω·m;b—将3D正演视电阻率数据转为2D断面显示;c—平滑约束2D反演断面,其中黑色线条为滑带位置在反演断面上投影位置;d—本研究中3D反演方法得到的电阻率断面
Fig.3
Numerical simulation results
a—shows the resistivity model at the bottom of the survey line, where the blue area represents 30 Ω·m and the red area represents 100 Ω·m; b—shows the 2D cross-sectional display of the 3D forward modeling apparent resistivity data; c—shows the smooth-constrained 2D inversion cross-section, where the black lines represent the projected positions of the fault zones on the inversion cross-section; d—shows the resistivity cross-section obtained by the 3D inversion method in this study
3 工程实例
白水河滑坡是三峡库区内典型的堆积型滑坡,位于湖北省宜昌市秭归县沙镇溪乐丰村。滑坡位于百福坪背斜北翼与秭归向斜交汇的长江南岸向斜坡上。出露岩层主要为侏罗系下统香溪组(J1x)中厚层状粉砂岩、夹薄层状泥质粉砂岩。滑坡整体形态呈“舌”状(见图4),后缘以岩性分界为界限(高程约400 m),前缘直抵长江。滑坡剖面上陡下缓,总体坡度约为30°,主滑方向为N32°E。钻孔资料显示,白水河滑坡发育有两层滑带,浅层滑带为坡体堆积物(碎石土或块石)与下部块裂岩的接触带,厚度一般为2 m左右,埋深一般在16 m左右。滑带物质为碎石土,结构紧实,不透水。深部滑层为块裂岩与下伏基岩(粉砂岩)的接触面,厚度一般在1 m左右,埋深在20~35 m左右[22]。
图4
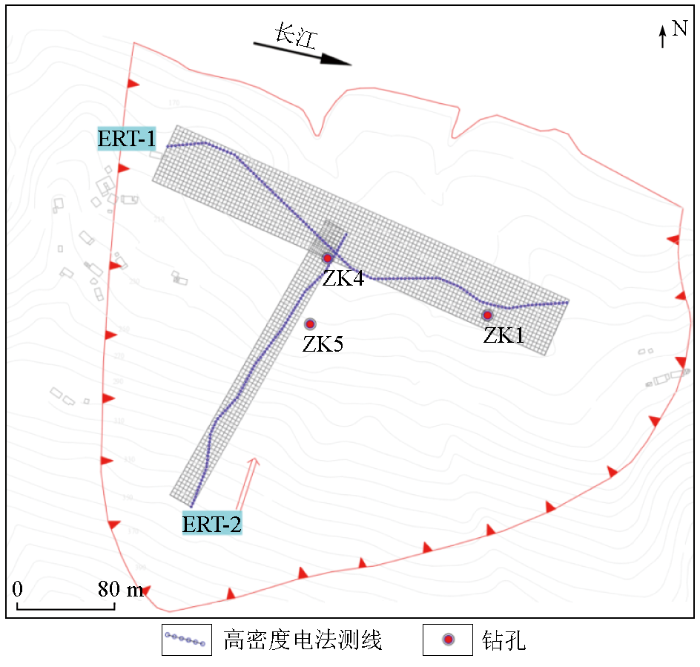
图4
白水河滑坡地表地形与实测测线位置
Fig.4
Surface topography of the Baishui River landslide and positions of actual survey lines
为了调查滑坡结构,2条高密度电阻率法测线被布置于滑坡体上,受滑体上广泛分布的植被与复杂地形影响,测线扭曲严重,测线详见图4。ERT-1测线沿垂直于滑动方向布置,测线极距为5 m,全长595 m。ERT-2测线沿滑动方向布置,测线极距为5 m,全长445 m。图5为本研究提出的3D反演方法对扭曲测线实测数据的反演结果。结果显示,反演电阻率断面从浅到深可以被划分为3个电性层。其中,第一层大致位于地表到大约20 m的深度,电阻率通常在30~80 Ω·m之间,主要对应于浅层的碎石土层。第二电性层深度大致位于15~30 m,电阻率通常在80~200 Ω·m之间,主要对应了块裂岩层。第三电性层埋深一般大于30 m,电阻率值200~400 Ω·m,对应基岩层。反演电阻率断面的电性分层特征与测线周边ZK1、ZK4、ZK5揭露的地层情况吻合良好。
图5
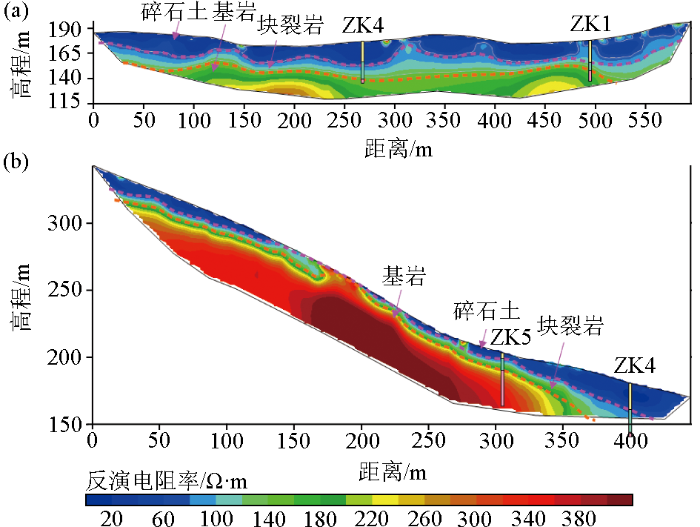
图5
不规则测线实测数据反演结果
a—ERT-1测线结果;b—ERT-2测线结果
Fig.5
Inversion results of actual measured data from irregular survey lines
a—shows the results for ERT-1 survey line; b—shows the results for ERT-2 survey line
4 结论
针对复杂地形滑坡上的不规则测线视电阻率数据的处理问题,提出了一种基于3D反演的处理方案。通过数值模拟与工程实例研究,得到如下结论:
1)数值模拟结果表明,扭曲测线会导致视电阻率数据出现明显偏差,影响传统2D反演效果,使电性分层出现虚假扭曲异常,最多可偏差1倍极距以上。本研究提出的3D反演方法,可显著改善滑坡体结构的成像效果,避免虚假扭曲异常出现。
2)现场实测结果表明,本研究提出的3D反演方法在处理白水河滑坡上不规则测线实测数据时,反演结果可清晰识别碎石土、块裂岩、基岩的分界面信息。测线周边的3个钻孔验证了电阻率结果的准确性。
参考文献
高密度电阻率法研究进展
[J].
Research progresses of the high-density resistivity method
[J].
高密度电阻率成像
[J].
High-density resistivity image
[J].
A review of electrical resistivity tomography applications in underground imaging and object detection
[J].
利用高密度电阻率法确定滑坡面研究
[J].
Application of multi-electrodes electrical method to detection of slide-face position
[J].
不同类型滑坡体的高密度电阻率法勘察电性特征
[J].
Electrical characteristics of different types of landslide bodies investigated by high-density electrical method
[J].
高密度电法在黄土滑坡结构探测与三维建模中的应用
[J].
Application of high-density electrical method in detecting and 3D modeling of loess landslide
[J].
PSBP在高密度电阻率法二维反演中的应用
[J].
Application of PSBP method in high-density two-dimensional resistivity inversion
[J].
高密度电阻率法二维层析成像研究与应用
[J].
Research and application of two-dimensional high density resistivity tomography
[J].
Evaluation of slope susceptibility using 2D electrical resistivity tomography supplemented with spatial resistivity change
[J].
2D data modelling by electrical resistivity tomography for complex subsurface geology
[J].
2.5D direct-current resistivity forward modelling and inversion by finite-element-infinite-element coupled method
[J].
基于高密度电法温纳装置的三维电阻率反演应用
[J].
Application of 3D resistivity inversion based on Winner device of high density electricity method
[J].
基于二维高密度电阻率勘探数据的三维反演及应用
[J].
3D inversion of high density resistivity method based on 2D exploration data and its application
[J].
基于混合网格有限元的直流电阻率法三维正演研究
[J].
3D forward modeling of DC resistivity method based on finite element with mixed grid
[J].
Application of 3D electrical resistivity tomography in the yeoncheon titanomagnetite deposit, south Korea
[J].
High-resolution quasi-3D electric resistivity tomography for deciphering groundwater potential zones in lateritic terrain
[J].
DOI:10.1007/s11053-021-09888-4
[本文引用: 1]

Groundwater is under constant threat of exploitation with increasing demands. Therefore, there is a need for more advanced methods for exploring potential groundwater zones to meet people requirements. Groundwater in hard terrain areas is present in fractured zones, whereas in lateritic terrain it occurs in layered strata. Electrical resistivity tomography (ERT) is an advanced geophysical technique used in our present study; a quasi-3D ERT survey was conducted using different arrays. 2D Geophysical data were acquired along 18 ERT profiles of Wenner and Wenner-Schlumberger arrays and 13 ERT profiles of Dipole-Dipole array. Each profile of 200 m length was kept parallel to each other at 5 m spacing in the E-W direction. The inverted response was generated and, based on resistivity distribution, different geological layers of clay, sand and laterite were delineated using various ERT arrays. A conductive zone was marked as a potential aquifer zone at depths of 7-10 m below ground level. Thus, the quasi-3D geoelectrical approach was applied successfully in a lateritic environment for deciphering potential groundwater zones.
Evaluation of the 3D topographic effect of homogeneous and inhomogeneous media on the results of 2D inversion of electrical resistivity tomography data
[J].
GNSS-RTK物探测量独立工程坐标系统的建立
[J].
The construction of independent engineering coordinate system in GNSS-RTK geophysical measurements
[J].
The inversion of data from very large three-dimensional electrical resistivity tomography mobile surveys
[J].
DOI:10.1111/1365-2478.13008
[本文引用: 1]
New developments in mobile resistivity meter instrumentation have made it possible to survey large areas with dense data coverage. The mobile system usually has a limited number of electrodes attached to a cable that is pulled along behind an operator so that a large area can be covered within a short time. Such surveys can produce three-dimensional datasets with hundreds of thousands of electrodes positions and data points. Similarly, the inverse model used to interpret the data can have several hundred thousand cells. It is impractical to model such large datasets within a reasonable time on microcomputers used by many small companies employing standard inversion techniques. We describe a model segmentation technique that subdivides the finite-element mesh used to calculate the apparent resistivity and Jacobian matrix values into a number of smaller meshes. A fast technique that optimizes the calculation of the Jacobian matrix values for multi-channel systems was also developed. A one-dimensional wavelet transform method was then used to compress the storage of the Jacobian matrix, in turn reducing the computer time and memory required to solve the least-squares optimization equation to determine the inverse model resistivity values. The new techniques reduce the calculation time and memory required by more than 80% while producing models that differ by less than 1% from that obtained using the standard inversion technique with a single mesh. We present results using a synthetic model and a field dataset that illustrates the effectiveness of the proposed techniques.
The use of a semi-structured finite-element mesh in 3-D resistivity inversion
[J].
库水下降作用下滑坡动态变形机理分析——以三峡库区白水河滑坡为例
[J].
Study on dynamic deformation mechanism of landslide in drawdown of reservoir water level:Take Baishuihe landslide in Three Gorges Reservoir area for example
[J].
