不规则测线视电阻率数据的3D反演方法
A 3D inversion method for apparent resistivity data along irregular survey lines under complex terrain
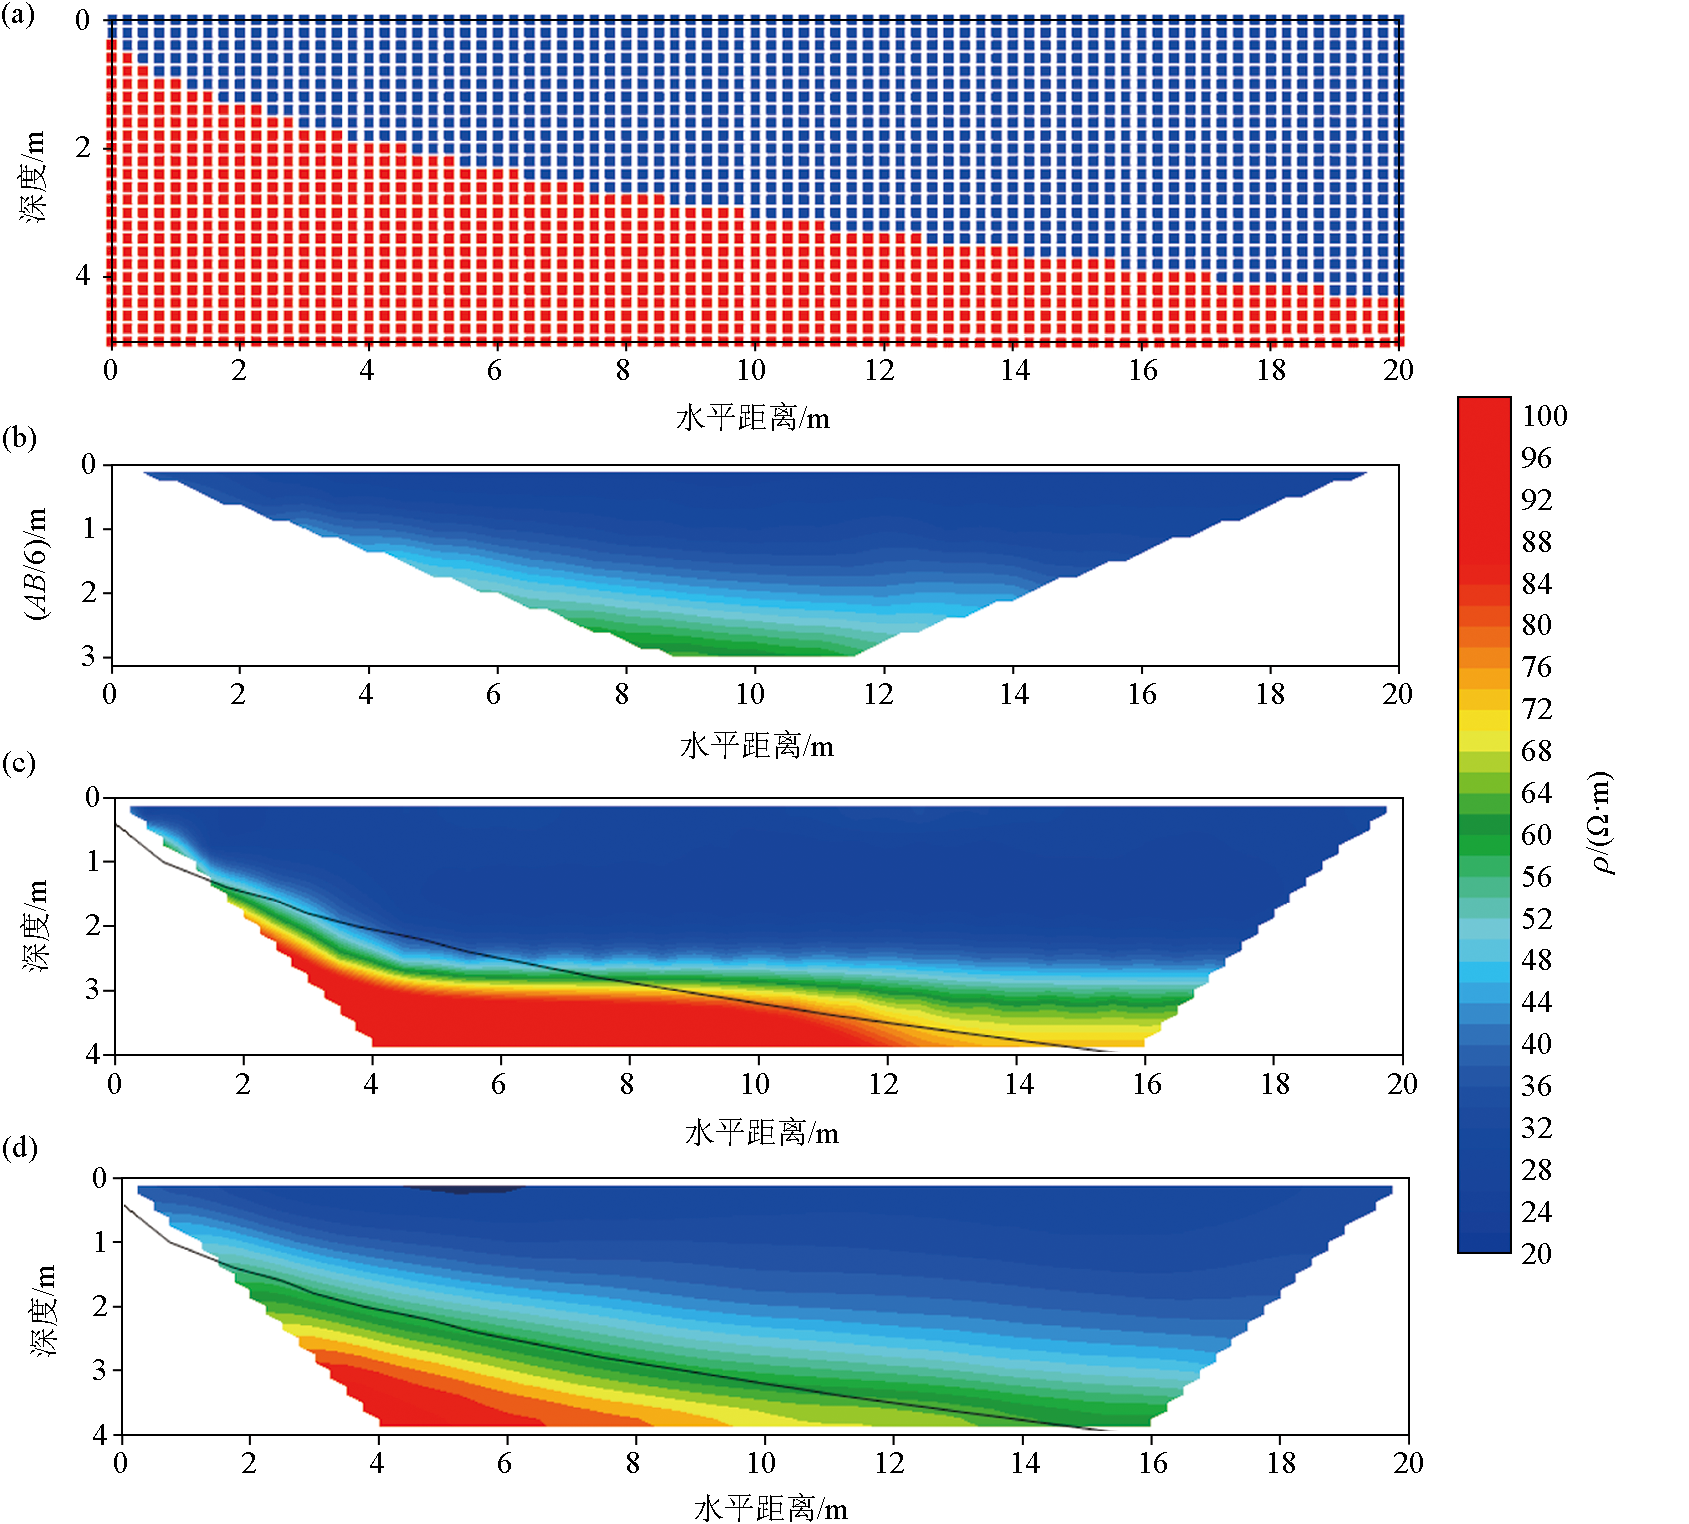
a—测线底部电阻率模型,其中蓝色区域为30 Ω·m,红色为100 Ω·m;b—将3D正演视电阻率数据转为2D断面显示;c—平滑约束2D反演断面,其中黑色线条为滑带位置在反演断面上投影位置;d—本研究中3D反演方法得到的电阻率断面
a—shows the resistivity model at the bottom of the survey line, where the blue area represents 30 Ω·m and the red area represents 100 Ω·m; b—shows the 2D cross-sectional display of the 3D forward modeling apparent resistivity data; c—shows the smooth-constrained 2D inversion cross-section, where the black lines represent the projected positions of the fault zones on the inversion cross-section; d—shows the resistivity cross-section obtained by the 3D inversion method in this study