

0 引言
东北黑土区是中国最大的商品粮基地,黑土区的土壤环境质量问题已经引起了许多科学工作者的普遍关注[1⇓⇓⇓⇓⇓⇓-8]。土壤中重金属元素的迁移转化是地球关键带物质循环的重要组成,元素通过生物地球化学过程迁移到水圈、生物圈和食物链,最终对人类健康产生影响[9⇓-11]。经典的道库恰耶夫学说认为,土壤是由母质、气候、生物、地形和时间五大自然因素综合作用的产物,在很大程度上,土壤中的元素分布与成土母质具有明显的继承关系[12-13],同时也不同程度的受到人类活动的影响[14-15]。因此,研究土壤中重金属元素的来源首先应该弄清土壤中元素和成土母质间的关系,在此基础上,确定人为因素对重金属元素分布的影响程度。
三江平原在保障国家粮食安全中具有举足轻重的地位。但是人类快速增长的农业及工业活动,都可能会引起某些重金属元素在耕地土壤中的积累。由于主要人类活动是农业,这里的土壤受到现代工业的污染较少,所以分析深层土壤中的微量含量对于表层土壤的研究非常重要。目前对三江平原耕地土壤重金属元素的特征研究较少,重金属元素的种类研究也不全,利用表层和深层土壤对比研究更是鲜有报道。本研究利用2018年最新获得的1:25万表层和深层土壤重金属元素数据,运用地统计学和多元数据分析的方法[20-21],对比研究三江平原表层和深层土壤中As、Cd、Cr、Cu、Hg、Ni、Pb、Zn的特征及相关性,分析8种重金属元素的来源,对于摸清东北黑土地家底,保护东北大粮仓,实现黑土资源的可持续利用具有重要意义。
1 研究区概况
三江平原,又称三江低地,位于东北平原东北部,是我国最大的淡水沼泽分布区。三江平原的“三江”即黑龙江、乌苏里江和松花江,3条大江浩浩荡荡,汇流、冲积而成了这块低平的沃土。区内水资源丰富,气候属温带湿润、半湿润大陆性季风气候,土壤类型主要有黑土、白浆土、草甸土、沼泽土等,而以草甸土和沼泽土分布最广。这里是我国重要的商品粮生产基地,粮食商品化程度和农业机械化程度全国第一,在保障国家粮食安全中具有举足轻重的地位。
2 材料与方法
2.1 样品采集和分析方法
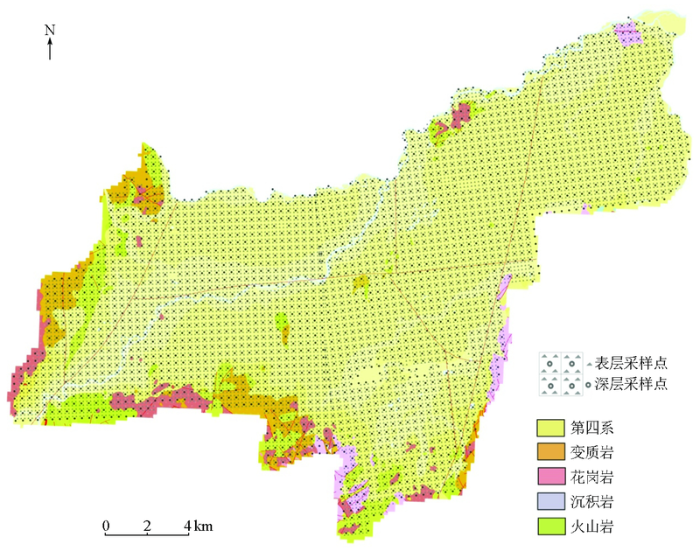
研究区样品来源于中国地质调查局实施的“东北黑土地1:25万土地质量调查”项目,在研究区网格化部署采样点,表层土壤样品采样密度为1个点/km2,主要采集耕层土,采样深度为0~20 cm,4 km2组合成一个样品进行分析测试;深层土壤样品采样密度为1个点/4 km2,深度为150~200 cm,16 km2组合成一个样品分析。三江平原共取得9 873件表层和2 697件深层土壤地球化学样品(图1)。样品分析测试由吉林省地质科学研究所和黑龙江省地质矿产测试应用研究所完成,其中Cd、Ni采用等离子体质谱法,As、Hg采用原子荧光光度法,Cr、Cu、Pb、Zn采用X射线荧光光谱法测定。采用国家标准物质监控分析测试准确度,采用密码样监控分析测试的精密度,所有监控样元素分析准确度和精密度均在允许监控限内,数据可靠。
图1
2.2 数据处理及评价方法
表层和深层土壤样品的描述性统计分析及Pearson相关性分析均在SPSS 21.0软件中完成,采用Arcgis 10.2软件绘制克里格元素空间分布图。
式中:q为富集系数;Ci表、Ci深分别为表层和深层土壤中重金属元素的含量;CSc表、CSc深分别为表层和深层土壤中Sc元素的含量。
表1 三江平原耕地表层和深层土壤重金属元素含量统计
Table 1
| 参数 | As | Cd | Cr | Cu | Hg | Ni | Pb | Zn | Sc | |||||||
|---|---|---|---|---|---|---|---|---|---|---|---|---|---|---|---|---|
| 全部表层土壤,N=9873 | ||||||||||||||||
| 平均值/10-6 | 8.85 | 0.083 | 65.09 | 21.76 | 0.034 | 25.69 | 25.62 | 63.52 | 11.75 | |||||||
| 中位数/10-6 | 8.40 | 0.075 | 65.30 | 21.90 | 0.031 | 24.90 | 25.5 | 62 | 11.9 | |||||||
| 变异系数/% | 37.26 | 50.83 | 18.78 | 22.16 | 54.73 | 22.73 | 10.70 | 20.87 | 15.51 | |||||||
| 数据范围/10-6 | 1.80~116.8 | 0.009~1.740 | 16.5~281 | 4~74 | 0.013~1.25 | 5.8~147 | 2.3~68.3 | 24.4~225.1 | 2.3~21.9 | |||||||
| (平均值±标准离差)/10-6 | 8.41±1.30 | 0.076±1.39 | 64.27±1.18 | 21.38±1.24 | 0.032±1.282 | 25.06±1.22 | 25.53±1.10 | 62.09±1.21 | 11.72±1.16 | |||||||
| 黑龙江省A层背景值[24]/10-6 | 7.3 | 0.086 | 58.6 | 20 | 0.037 | 22.8 | 24.2 | 70.7 | 10.79 | |||||||
| 全部深层土壤,N=2697 | ||||||||||||||||
| 平均值/10-6 | 11.16 | 0.075 | 71.40 | 21.98 | 0.036 | 28.42 | 25.97 | 71.33 | 12.17 | |||||||
| 中位数/10-6 | 10.80 | 0.072 | 75.30 | 23.6 | 0.035 | 29.50 | 26.3 | 73.6 | 13.1 | |||||||
| 变异系数/% | 51.07 | 36.60 | 29.75 | 30.27 | 34.43 | 38.45 | 12.84 | 20.67 | 24.11 | |||||||
| 数据范围/10-6 | 1.82~225 | 0.013~0.36 | 9.6~371.6 | 2.5~98.25 | 0.006~0.274 | 3.4~294.4 | 10.75~49.6 | 13.8~142.5 | 1.6~24.6 | |||||||
| (平均值±标准离差)/10-6 | 10.50±1.34 | 0.071±1.40 | 73.11±1.19 | 21.78±1.32 | 0.034±1.34 | 27.48±1.31 | 25.82±1.13 | 72.44±1.19 | 12.42±1.22 | |||||||
| 黑龙江省C层背景值[24]/10-6 | 11.4 | 0.078 | 59.5 | 21 | 0.040 | 24.3 | 24.4 | 69.9 | 无 | |||||||
| 第四系表层,N=8383 | ||||||||||||||||
| 平均值/10-6 | 8.21 | 0.079 | 65.50 | 21.88 | 0.032 | 25.43 | 25.18 | 60.47 | 11.65 | |||||||
| 中位数/10-6 | 8.00 | 0.072 | 65.70 | 22.40 | 0.031 | 24.80 | 25.10 | 58.00 | 11.80 | |||||||
| 变异系数/% | 27.55 | 44.36 | 18.15 | 21.39 | 47.43 | 19.61 | 9.16 | 20.45 | 15.93 | |||||||
| 数据范围/10-6 | 1.80~43.45 | 0.009~1.167 | 16.5~121.6 | 4~49.4 | 0.013~0.986 | 8.08~47.9 | 9.2~61.75 | 27.4~212.1 | 2.9~19.1 | |||||||
| (平均值±标准离差)/10-6 | 7.96±1.26 | 0.074±1.42 | 64.86±1.19 | 21.52±1.24 | 0.031±1.253 | 25.00±1.21 | 25.12±1.08 | 59.16±1.21 | 11.61±1.16 | |||||||
| 变质岩表层,N=454 | ||||||||||||||||
| 平均值/10-6 | 10.32 | 0.093 | 69.98 | 21.64 | 0.034 | 27.11 | 27.90 | 72.45 | 12.29 | |||||||
| 中位数/10-6 | 9.98 | 0.083 | 70.00 | 21.45 | 0.030 | 26.50 | 27.40 | 71.05 | 12.40 | |||||||
| 变异系数/% | 41.44 | 59.11 | 20.61 | 24.02 | 50.82 | 23.00 | 12.39 | 21.32 | 13.01 | |||||||
| 数据范围/10-6 | 1.84~59.70 | 0.023~0.790 | 31.40~197.8 | 9.15~55.15 | 0.015~0.258 | 10.40~62.10 | 19.40~53.20 | 42.00~213.4 | 6.76~17.2 | |||||||
| (平均值±标准离差)/10-6 | 9.71±1.32 | 0.083±1.30 | 68.39±1.17 | 20.94±1.23 | 0.031±1.303 | 26.61±1.23 | 27.67±1.11 | 70.47±1.18 | 12.27±1.14 | |||||||
| 沉积岩表层,N=481 | ||||||||||||||||
| 平均值/10-6 | 10.15 | 0.085 | 68.78 | 21.52 | 0.035 | 25.71 | 27.29 | 66.42 | 12.32 | |||||||
| 中位数/10-6 | 10.40 | 0.077 | 68.80 | 21.30 | 0.032 | 24.60 | 27.10 | 63.90 | 12.40 | |||||||
| 变异系数/% | 24.45 | 44.98 | 18.45 | 18.35 | 37.57 | 24.55 | 11.78 | 18.10 | 13.10 | |||||||
| 数据范围/10-6 | 4.32~19.4 | 0.032~0.445 | 29.85~167.7 | 9~39 | 0.018~0.180 | 9.3~67.2 | 19.9~46.6 | 44~119.7 | 6.58~18 | |||||||
| (平均值±标准离差)/10-6 | 9.89±1.29 | 0.077±1.34 | 67.45±1.15 | 21.23±1.18 | 0.032±1.265 | 24.94±1.22 | 27.04±1.12 | 65.16±1.18 | 12.25±1.13 | |||||||
| 花岗岩表层,N=251 | ||||||||||||||||
| 平均值/10-6 | 10.03 | 0.085 | 69.16 | 20.40 | 0.039 | 26.73 | 28.03 | 71.55 | 12.06 | |||||||
| 中位数/10-6 | 9.70 | 0.081 | 68.10 | 20.10 | 0.032 | 25.60 | 27.80 | 69.90 | 12.20 | |||||||
| 变异系数/% | 38.19 | 30.83 | 21.65 | 20.20 | 198.07 | 22.73 | 14.36 | 15.21 | 12.20 | |||||||
| 数据范围/10-6 | 3.80~33.05 | 0.030~0.255 | 36.9~170 | 11.5~33.8 | 0.016~1.25 | 13.1~56.2 | 20.2~46 | 46.7~108.7 | 8.26~15.4 | |||||||
| (平均值±标准离差)/10-6 | 9.31±1.37 | 0.081±1.27 | 66.99±1.17 | 20.0±1.23 | 0.032±1.309 | 25.88±1.21 | 27.67±1.14 | 70.80±1.16 | 11.97±1.14 | |||||||
| 参数 | As | Cd | Cr | Cu | Hg | Ni | Pb | Zn | Sc | |||||||
| 火山岩表层,N=304 | ||||||||||||||||
| 平均值/10-6 | 10.85 | 0.083 | 73.79 | 23.18 | 0.033 | 28.20 | 26.69 | 67.84 | 12.86 | |||||||
| 中位数/10-6 | 9.99 | 0.080 | 69.85 | 22.90 | 0.031 | 26.15 | 26.40 | 67.05 | 12.70 | |||||||
| 变异系数/% | 50.85 | 28.56 | 25.29 | 21.77 | 29.46 | 31.06 | 11.73 | 16.48 | 14.02 | |||||||
| 数据范围/10-6 | 4.76~63.80 | 0.041~0.20 | 45~163.3 | 13.05~43.2 | 0.019~0.095 | 15.8~65.50 | 17.3~37.60 | 43.35~105.3 | 7.51~21.8 | |||||||
| (平均值±标准离差)/10-6 | 9.84±1.30 | 0.079±1.31 | 71.45±1.25 | 22.65±1.23 | 0.032±1.276 | 26.92±1.31 | 26.49±1.12 | 66.99±1.18 | 12.74±1.13 | |||||||
| 第四系深层,N=2214 | ||||||||||||||||
| 平均值/10-6 | 10.98 | 0.074 | 69.61 | 21.88 | 0.036 | 27.99 | 26.09 | 70.11 | 12.02 | |||||||
| 中位数/10-6 | 10.65 | 0.070 | 76.30 | 24.30 | 0.036 | 30.30 | 26.60 | 72.60 | 13.20 | |||||||
| 变异系数/% | 45.32 | 37.47 | 25.88 | 29.19 | 27.86 | 27.32 | 12.53 | 21.29 | 25.19 | |||||||
| 数据范围/10-6 | 2.35~225 | 0.013~0.22 | 9.6~262 | 2.5~38.9 | 0.006~0.095 | 3.4~146.9 | 14~49.6 | 13.8~120.8 | 1.6~24.6 | |||||||
| (平均值±标准离差)/10-6 | 10.30±1.31 | 0.070±1.45 | 71.78±1.22 | 21.63±1.35 | 0.034±1.33 | 27.42±1.32 | 26.00±1.13 | 70.80±1.21 | 12.05±1.28 | |||||||
| 变质岩深层,N=115 | ||||||||||||||||
| 平均值/10-6 | 12.58 | 0.075 | 84.87 | 23.53 | 0.037 | 30.04 | 28.17 | 77.15 | 12.84 | |||||||
| 中位数/10-6 | 11.20 | 0.073 | 83.50 | 23.4 | 0.032 | 30.50 | 28 | 78.70 | 13.40 | |||||||
| 变异系数/% | 140.56 | 31.04 | 33.76 | 40.02 | 41.26 | 45.93 | 12.75 | 16.17 | 19.40 | |||||||
| 数据范围/10-6 | 2.27~225 | 0.028~0.18 | 12.9~301.3 | 3.5~98.25 | 0.011~0.128 | 5.2~154.4 | 10.75~40.3 | 21~117.5 | 2.96~24.6 | |||||||
| (平均值±标准离差)/10-6 | 10.94±1.28 | 0.071±1.32 | 82.04±1.16 | 22.18±1.29 | 0.034±1.38 | 28.91±1.23 | 28.18±1.11 | 76.56±1.18 | 12.91±1.16 | |||||||
| 沉积岩深层,N=131 | ||||||||||||||||
| 平均值/10-6 | 11.32 | 0.073 | 80.62 | 23.03 | 0.038 | 29.63 | 27.32 | 74.15 | 12.91 | |||||||
| 中位数/10-6 | 11.30 | 0.071 | 79.80 | 23.6 | 0.037 | 29.20 | 27.3 | 75.00 | 13.20 | |||||||
| 变异系数/% | 28.61 | 30.57 | 20.99 | 22.93 | 32.25 | 26.65 | 11.71 | 14.90 | 17.76 | |||||||
| 数据范围/10-6 | 2.66~28.4 | 0.017~0.20 | 15.75~180.7 | 4.7~40.6 | 0.013~0.115 | 6.9~68.00 | 17.80~40.3 | 39.5~108.3 | 3.96~19.2 | |||||||
| (平均值±标准离差)/10-6 | 10.99±1.24 | 0.070±1.30 | 79.62±1.16 | 22.86±1.24 | 0.036±1.32 | 28.45±1.27 | 27.23±1.11 | 73.45±1.17 | 12.97±1.17 | |||||||
| 花岗岩深层,N=134 | ||||||||||||||||
| 平均值/10-6 | 10.43 | 0.072 | 83.90 | 22.62 | 0.038 | 32.09 | 27.50 | 77.39 | 12.96 | |||||||
| 中位数/10-6 | 11.0 | 0.071 | 80.60 | 21.60 | 0.035 | 29.40 | 27.7 | 78.6 | 13.1 | |||||||
| 变异系数/% | 27.39 | 26.53 | 32.29 | 34.66 | 37.41 | 68.26 | 11.76 | 15.79 | 17.73 | |||||||
| 数据范围/10-6 | 3.72~21.3 | 0.041~0.16 | 24.9~251.1 | 8.1~76.1 | 0.015~0.128 | 9.9~202.9 | 14.2~35.1 | 48.4~117.7 | 7.28~24.3 | |||||||
| (平均值±标准离差)/10-6 | 10.26±1.32 | 0.070±1.29 | 78.52±1.16 | 21.33±1.27 | 0.035±1.32 | 28.84±1.23 | 27.48±1.12 | 76.38±1.17 | 12.79±1.16 | |||||||
| 火山岩深层,N=105 | ||||||||||||||||
| 平均值/10-6 | 11.47 | 0.081 | 93.37 | 26.93 | 0.037 | 41.64 | 25.72 | 80.67 | 14.30 | |||||||
| 中位数/10-6 | 10.95 | 0.079 | 81.20 | 24.80 | 0.036 | 32.60 | 26.1 | 80.6 | 14.2 | |||||||
| 变异系数/% | 31.55 | 36.26 | 41.49 | 36.68 | 29.78 | 88.93 | 12.25 | 17.21 | 19.78 | |||||||
| 数据范围/10-6 | 2.39~28.4 | 0.032~0.33 | 45.4~262.6 | 10.2~76.1 | 0.013~0.115 | 15.5~294.4 | 14.2~40.5 | 42.8~142.5 | 6.15~24.3 | |||||||
| (平均值±标准离差)/10-6 | 11.09±1.23 | 0.076±1.34 | 82.99±1.27 | 24.83±1.21 | 0.036±1.27 | 33.19±1.37 | 25.88±1.10 | 80.17±1.15 | 14.19±1.15 | |||||||
3 结果与讨论
3.1 统计分析和地球化学特征
3.2 表层土壤重金属元素含量分布
表层土壤中元素的含量特征一般反映人类活动及自然因素双重影响下土壤中元素的分布状态,受人类活动因素的影响较明显。本次统计三江平原8种重金属元素平均值、变异系数以及黑龙江省背景值列于表1,为了进一步描述重金属元素的分布特征,利用SPSS 21.0软件分别绘制了表层8种重金属元素的直方图和箱形图(图2、图3)。三江平原表层土壤中As、Ni、Cr、Cu、Pb、Zn、Cd和Hg的平均含量分别为8.85×10⁻⁶、25.69×10⁻⁶、65.09×10⁻⁶、21.76×10⁻⁶、25.62×10⁻⁶、63.52×10⁻⁶、0.083×10⁻⁶和0.034 ×10⁻⁶,与黑龙江省土壤A层背景值相比, Cd、Hg、Zn的平均值较黑龙江省略低,而As、Cr、Cu、Ni、Pb平均值大于黑龙江省背景值。在对数转换后,基本均显示服从正态分布。
图2
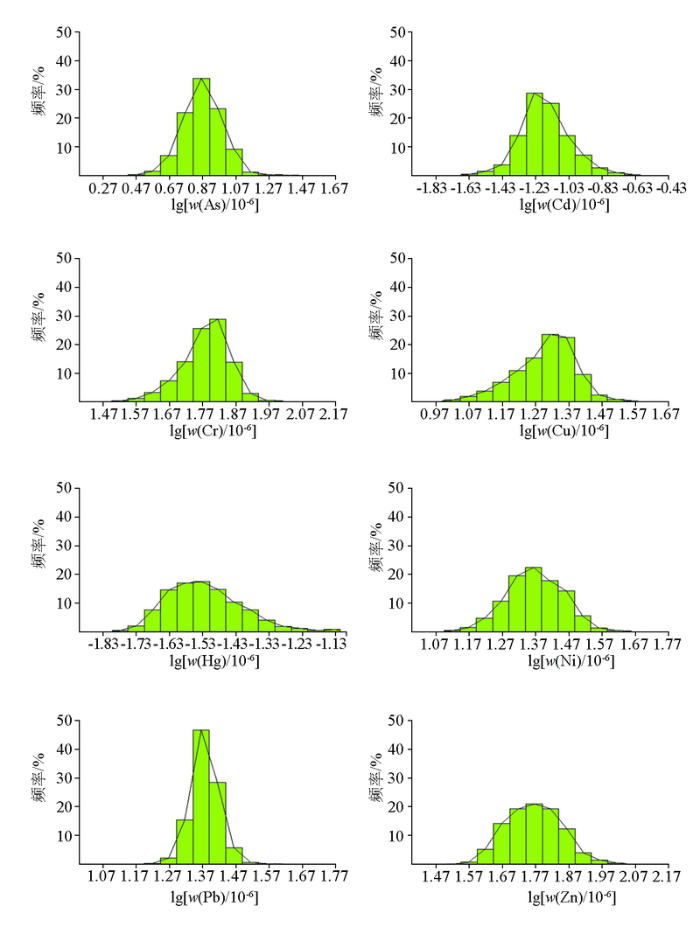
图2
表层土壤元素含量分布直方图
Fig.2
Histograms for heavy metal elements in topsoils from Sanjiang Plain
图3
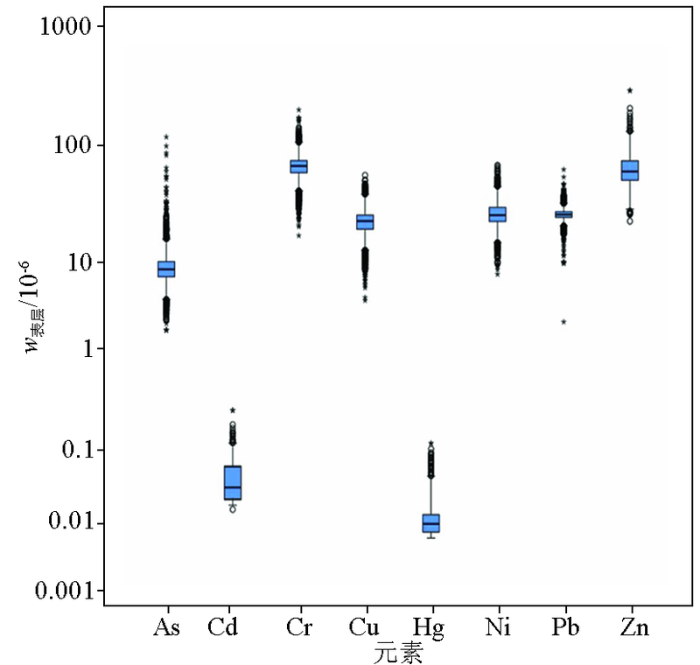
图3
表层土壤元素含量分布箱型图
Fig.3
Box-plot diagram for heavy metal elements in topsoils from Sanjiang Plain
按照不同母质类型分别对表层土壤中8种元素进行描述性统计。如表1所示,母质为变质岩的土壤中As、Cd、Zn含量分别为10.32×10⁻⁶、0.093×10⁻⁶、72.45 ×10⁻⁶,较其他母质土壤含量高;母质为花岗岩的土壤中Pb含量为28.03×10⁻⁶,远高于其他母质土壤;母质为火山岩的土壤中Cr、Cu、Ni含量分别为73.79×10⁻⁶,、23.18×10⁻⁶、28.20×10⁻⁶,也较其他母质土壤较高;表明成土母质的岩性对土壤中重金属元素的含量有明显影响。
3.3 深层土壤重金属元素含量分布
深层土壤由于受人类活动的影响较小,更能代表成土母质中元素的含量特征。深层土壤中8种重金属元素的含量分布特征如图4所示。从箱型图中可以看出,研究区内,Cr平均含量最高(71.40 ×10⁻⁶),其次是Zn(71.33×10⁻⁶)、Ni(28.42×10⁻⁶)、Pb(25.97×10⁻⁶)、Cu(21.98 ×10⁻⁶) 、 As(11.16×10⁻⁶)、Cd(0.075×10⁻⁶)和Hg(0.036×10⁻⁶)。变质岩母质的土壤中As、Cr、Pb含量分别为12.58×10⁻⁶、84.87×10-6,28.17×10-6,较其他母质土壤高;火山岩母质的土壤中Cr、Ni、Zn含量分别为93.37×10⁻⁶、41.64×10⁻⁶、80.67×10⁻⁶,明显高于其他母质土壤。深层土壤除Cd外,其他7种元素均表现为表层土壤含量低于深层土壤含量。与表层土壤中的分布相似,深层土壤中8 种元素在对数转换后,基本均显示服从正态分布(图5)。
图4
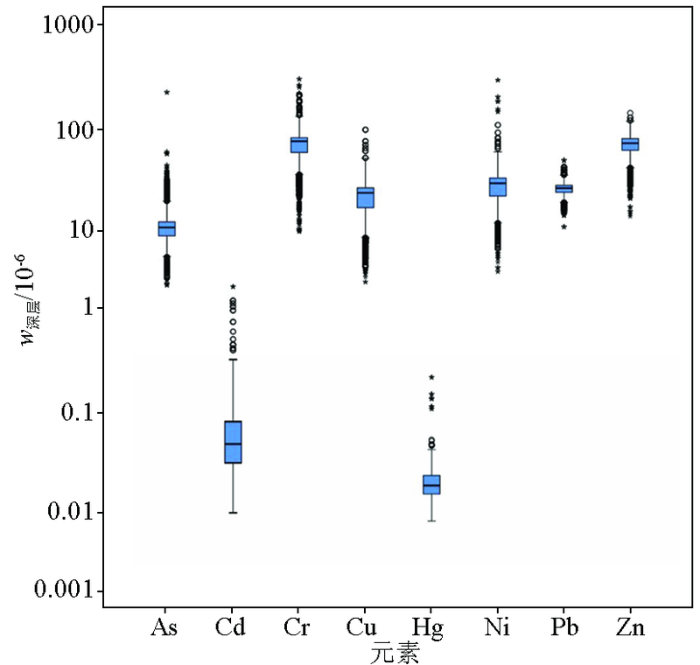
图4
深层土壤元素含量分布箱型图
Fig.4
Box-plot diagram for heavy metal elements insubsoils from Sanjiang Plain
图5
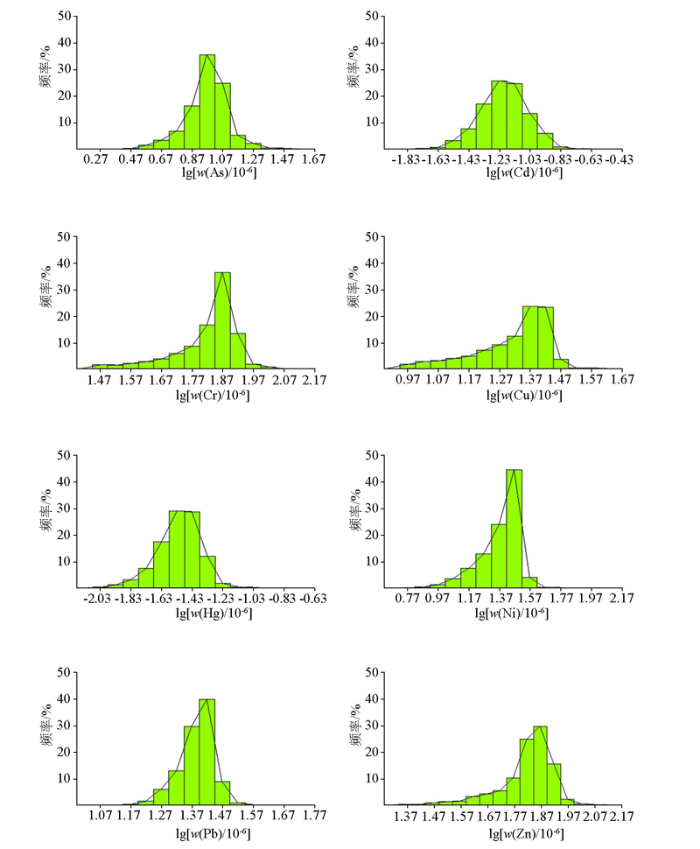
图5
深层土壤元素含量分布直方图
Fig.5
Histograms for heavy metal elements in subsoils from Sanjiang Plain
3.4 深层土壤重金属元素空间分布
表层土壤反映了地球关键带中物质的相互作用及循环过程,而深层土壤则反映成土母质的地质背景。表层和深层土壤的重金属元素空间分布显示见图6、图7,总体上,表层和深层土壤重金属元素高值区分布较一致,以松花江为界,左侧低、右侧高,形成明显的分界线,与深层元素分布比较,总体上表层土壤均未受到明显的重金属元素污染,说明三江平原土壤环境质量依然优越,仅发现同江市东北部土壤As、Cd、Cu、Ni表层较深层稍偏高,有轻微富集的趋势,佳木斯市表层土壤Hg较深层有富集的趋势,推测可能受到了人为活动的影响,这可能与城市化发展密切相关[25⇓-27]。表层土壤中变质岩区Cd、Zn均值含量高,火山岩区As、Cr、Cu、Ni含量高,花岗岩区Pb含量高;深层土壤在火山岩区中As、Cr、Cu、Ni、Zn含量高,变质岩区Cd、Pb含量高,这与表层分布相似,可以推断三江平原土壤中重金属元素主要来源主要是成土母质。
图6
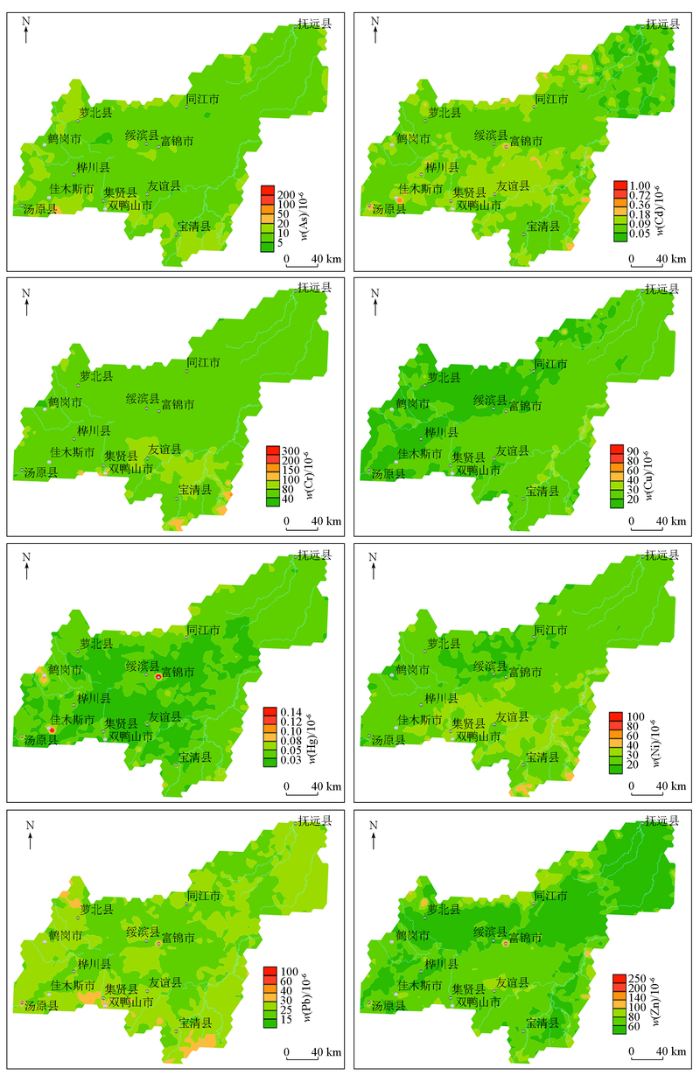
图6
三江平原表层土壤重金属元素空间分布
Fig.6
Spatial distribution of heavy metal elements concentrations in the top soil from Sanjiang Plain
图7
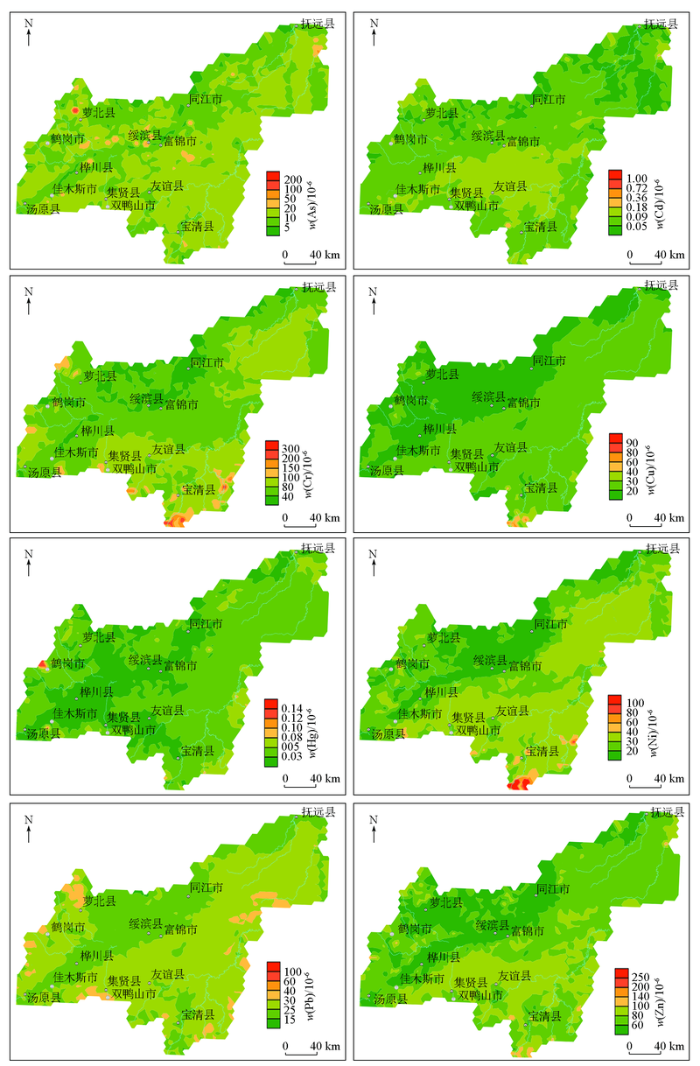
图7
三江平原深层土壤重金属元素空间分布
Fig.7
Spatial distribution of heavy elements concentrations in the deep soil from Sanjiang Plain
区域上,影响三江平原表层土壤中重金属元素分布的主要因素是成土母质和少量的人类活动。8种重金属元素富集系数均小于2(表1),表明三江平原表层土壤中8种重金属元素均无潜在污染风险,仅有某些点位的表层土壤中Cd、Hg、As元素的富集系数存在较大的值,说明在部分地区可能受到人类活动的影响稍大。
岩石风化是土壤中重金属元素的主要自然来源,土壤中的元素分布与成土母质具有明显的继承关系。本次利用Pearson相关性分析分别计算了三江平原所有类型的成土母质区域内,表层和深层土壤中重金属元素之间的相关系数(表2),结果显示Cr、Cu、Ni和Zn分别呈显著正相关(相关系数0.3~0.6,P<0.01),说明表层土壤中这些重金属元素主要来源于深层土壤(成土母质),较少受到人类活动的干扰。但是,As、Cd、Hg和Pb在不同的母岩区均显示相关性较弱,表明三江平原表层土壤中的As、Cd、Hg和Pb可能受到人类活动的影响,如农业生产中的农药和化肥的施用等。
表2 三江平原表层及深层土壤中重金属元素间相关系数
Table 2
| 元素 | Pearson相关系数 | ||||
|---|---|---|---|---|---|
| 第四系 | 变质岩 | 沉积岩 | 花岗岩 | 火山岩 | |
| As | 0.018 | 0.009 | 0.380** | 0.266** | 0.216** |
| Cd | 0.332** | 0.178** | 0.176** | 0.091 | 0.140* |
| Cr | 0.602** | 0.185** | 0.480** | 0.395** | 0.625** |
| Cu | 0.584** | 0.308** | 0.440** | 0.512** | 0.414** |
| Hg | 0.137** | 0.250** | 0.218** | 0.100 | 0.249** |
| Ni | 0.500** | 0.252** | 0.527** | 0.488** | 0.449** |
| Pb | 0.264** | 0.206** | 0.268** | 0.367** | 0.045 |
| Zn | 0.314** | 0.333** | 0.299** | 0.203** | 0.470** |
注:“**”表示在0.01级别相关性显著,“*”表示在0.05级别上相关性显著。
4 结论
1)三江平原土壤总体上表现为环境质量依然优越,除Cd外,表层土壤中重金属元素As、Cr、Cu、Hg、Ni、Pb和Zn含量(8.85×10⁻⁶、65.09×10⁻⁶、21.76×10⁻⁶、0.034×10⁻⁶、25.69×10⁻⁶、25.62×10⁻⁶、63.52×10⁻⁶)均略低于深层土壤。
2)表层和深层土壤的重金属元素Cd、Cr、Cu、Ni、Pb和Zn空间分布较一致,表现为以松花江为界,左侧低、右侧高,形成明显的分界线。
3)表层相对于深层土壤的重金属元素富集系数均小于2,仅个别点位的表层Cd、Hg、As富集系数存在相对较高的值,在部分地区可能受到人类活动的叠加影响。
4)在不同成土母质区域,表层和深层土壤中重金属元素Cr、Cu、Ni和Zn均呈显著正相关(相关系数0.3~0.6,P<0.01),表明表层土壤中这些重金属元素主要物质来源于成土母质。
参考文献
东北松辽平原35年来耕地土壤全氮时空变化最新报道
[J],
Spatio-temporal variation of total N content in farmland soil of Songliao Plain in Northeast China during the past 35 years
[J].
松嫩平原东部典型黑土剖面孢粉组合及其时代和古气候意义
[J].
Palynological assemblages of typical black soil profile in the eastern Songliao Plain and their age and paleoclimatic significances
[J].
东北松辽平原典型黑土—古土壤剖面AMS14C年龄首次报道
[J].
The first reported of the AMS14C age of typical black soil mollisol—paleosol profile of Songliao Plain
[J].
典型农业区土壤 6 种重金属的人为污染情况及健康风险评价
[J].
Anthropogenic pollution and health risk assessment of six heavy metals in soil of a typical agricultural area
[J].
Temporal and spatial change of soil organic matter and pH in cultivated land of the Songliao Plain in Northeast China during the past 35 years
[J].
黑龙江省讷河市土壤某些微量元素地球化学特征
[J].
Trace element geochemistry of the soil in Nehe city,Heilongjiang Province
[J].
三江平原农田土壤重金属含量的空间变异与来源分析
[J].
Spatial variability and source analysis of heavy metal content of agricultural soil in Sanjiang Plain
[J].
三江平原地区农田土壤中几种重金属空间分布状况
[J].
Spatial distribution of heavy metals in agricultural soil in Sanjiang Plain
[J].
海南岛表层及深层土壤重金属分布特征及源解析
[J].
Distribution characteristics and source identification of heavy metals in topsoils and subsoils of Hainan Island
[J].
北京市不同功能区土壤黑碳的含量特征及其来源分析
[J].
Concentration and sources of black carbon in different function zones of Beijing,China
[J].
Multivariate and geostatistical analyses of the spatial distribution and origin of heavy metals in the agricultural soils in Shunyi,Beijing,China
[J].DOI:10.1016/j.scitotenv.2012.03.003 URL [本文引用: 1]
Background levels of trace elements and soil geochemistry at regional level in NE Italy
[J].DOI:10.1016/j.gexplo.2010.07.008 URL [本文引用: 1]
Heavy metals contents in agricultural topsoils in the Ebro basin (Spain):Application of the multivariate geostatistical methods to study spatial variations
[J].
In this work the content of seven heavy metals (Cd, Cr, Cu, Hg, Ni, Pb and Zn) and other parameters (the pH, organic matter, carbonates and granulometric fraction) in agricultural topsoil in the Ebro basin are quantified, based on 624 samples collected according to an 8 by 8 km square mesh. The average concentrations (mg/kg) obtained were: Cd 0.415+/-0.163, Cr 20.27+/-13.21, Cu 17.33+/-14.97, Ni 20.50+/-22.71, Pb 17.54+/-10.41, Zn 17.53+/-24.19 and Hg 35.6+/-42.05 microg/kg. The concentration levels are relatively low in areas of high pH and low organic matter content concentration. The results of factor analysis group Cd, Cu, Hg, Pb and Zn in F1 and Cr y Ni in F2. The spatial heavy metals component maps based on geostatistical analysis, show definite association of these factors with the soil parent material. The local anomalies (found in Cu, Zn and Pb) are attributed to anthropogenic influence.
北京平原区土壤地球化学特征及影响因素分析
[J].
Soil geochemical characteristics and influencing factors in Beijing Plain
[J].
Factorial kriging and stepwise regression approach to identify environmental factors influencing spatial multi-scale variability of heavy metals in soils
[J].
Elemental and gamma-ray surveys in the volcanic soils of Ischia island,Italy
[J].DOI:10.1144/1467-7873/06-105 URL [本文引用: 1]
Importance of geomorphology and sedimentation processes for metal dispersion in sediments and soils of the Ganga Plain:Identification of geochemical domains
[J].DOI:10.1016/S0009-2541(99)00073-X URL [本文引用: 1]
Trace metal concentrations in lake and overbank sediments in southern Norway
[J].
The heavy elements: Chemistry,environmental impact and health effects
[J].
中国粮食主产区耕地土壤重金属时空变化与污染源分析
[J].
Spatial temporal trends and pollution source analysis for heavy metal contamination of cultivated soils in five major grain producing regions of China
[J].
Source identification and ecological risk assessment of heavy metals in topsoil using environmental geochemical mapping:Typical urban renewal area in Beijing,China
[J].DOI:10.1016/j.gexplo.2013.10.002 URL [本文引用: 1]
厦门某旱地土壤垂直剖面中微量迁移规律及来源解析
[J].
Migration and source analysis of heavy metals in vertical soil profiles of the drylands of Xiamen City
[J].
Anthropogenic mercury enrichment factors and contributions in soils of Guangdong Province,South China
[J].DOI:10.1016/j.gexplo.2014.01.031 URL [本文引用: 1]
河北省重点城市土壤重金属污染评价与防治对策——以石家庄市为例
[J].
Pollution assessments and prevention countermeasures of heavy metals of soil in main cities of Hebei Province:Taking Shijiazhuang as an example
[J].
福建龙海土壤垂向剖面元素分布特征
[J].
Distribution characteristics of elements in vertical soil profile in Longhai,Fujian province
[J].
黑龙江海伦地区垦殖前后典型黑土剖面主要养分元素垂直分布特征
[J].
Vertical distribution characteristics of main nutrient elements in typical black soil profile before and after reclamation in Helun Area, Heilongjiang Province
[J].
