|
|
|
| Carbon sink in farmland soils in Luoyang City, China |
XIA Yan( ), WANG Run-Tao, DU Qian-Qian, WANG Xi-Kuan(), Lyu Hong-Jie, HOU Jin-Kai, LI Bing-Hui ), WANG Run-Tao, DU Qian-Qian, WANG Xi-Kuan(), Lyu Hong-Jie, HOU Jin-Kai, LI Bing-Hui |
| Henan First Geology and Mineral Survey Institute Co., Ltd., Luoyang 471023, China |
|
|
|
|
Abstract This study investigates the spatial distribution characteristics, temporal changes, and influencing factors of total carbon density, organic carbon density, and reserves in the farmland soils in Luoyang City based on repeated sampling data from multi-purpose regional geochemical survey points over different periods. The results indicate that in 2005, the topsoils in the multi-purpose survey area exhibited an average total carbon content of 1.57%, an average total carbon density of 44.74 t/hm2, an average organic carbon content of 1.12%, and an average organic carbon density of 34.27 t/hm2. With annual average increases in the total carbon density and organic carbon density of 0.709 t/hm2 and 6.643 t/hm2, respectively, this year witnessed increases in the total carbon and organic carbon of 41.73 kg/(hm2·a) and 390.75 kg/(hm2·a), respectively. The respective reserves of total carbon and organic carbon were 12.511 3 million tons and 8.879 59 million tons, with respective increases of 198.28 thousand tons and 1.857 8 million tons. In 2018, the topsoils in the multi-purpose survey area displayed an average total carbon content of 1.18%, an average total carbon density of 34.27 t/hm2, an average organic carbon content of 1.07%, and an average organic carbon density of 30.94 t/hm2. With annual average increases in the total carbon density and organic carbon density of 9.642 t/hm2 and 4.727 t/hm2, respectively, this year witnessed increases in the total carbon and organic carbon of -2,410.5 kg/(hm2·a) and 1,181.75 kg/(hm2·a), respectively. The respective reserves of total carbon and organic carbon were 1.963 5 million tons and 1.772 61 million tons. The total carbon reserves in topsoils in the whole study area were 14.474 81 million tons, including organic carbon reserves of 10.652 2 million tons. The total carbon reserves decreased by 552.41 thousand tons, while the organic carbon reserve increased by 270.82 thousand tons. Overall, the study area experienced a total carbon decrease of 354.13 thousand tons and an increase in the organic carbon reserves of 2.128 62 million tons. The total carbon showed significant positive correlations with the contents of organic carbon, CaO, MgO, N, and P, the organic carbon displayed significant positive correlations with the contents of total carbon, N, and P, and there was a significant positive correlation between pH and the CaO content. Fertilization led to an increase in the organic carbon and total carbon contents in farmland soils, with total carbon being significantly affected by the CaO content. In the carbonate areas, alkaline soil environments exhibited carbon sink characteristics. In the southern regions with acidified soil environments, the decomposition of carbonates in soils led to carbon loss and reduced calcium content. The results of this study provide important scientific evidence for research on peak carbon dioxide emissions and carbon neutrality of Luoyang City.
|
|
Received: 19 July 2023
Published: 26 February 2025
|
|
|
|
|
|
|
The scope of 1∶250,000 multi-target regional geochemical surveys in 2005 and 2018 and the repeated sampling sites in 2022 in Luoyang City
|
| 时间 | 项目 | CaO | TC | Corg | 项目 | CaO | TC | Corg | | 2005年 | ΔlgCB | -0.003 12 | 0.001 58 | -0.002 3 | 精密度
(RSD)/% | 4.28 | 5.03 | 5.18 | | 2018年 | -0.003 17 | 0.001 67 | -0.002 5 | 4.75 | 5.63 | 5.89 | | 2022年 | -0.003 2 | 0.001 68 | -0.002 6 | 4.88 | 5.39 | 5.36 | | 2005年 | ΔlgCB
合格率 | 100% | 100% | 100% | 合格率 | 100% | 100% | 100% | | 2018年 | 100% | 100% | 100% | 100% | 100% | 100% | | 2022年 | 100% | 100% | 100% | 100% | 100% | 100% | | 2005年 | 抽样及重复
样合格率 | 100% | 100% | 100% | 报出率 | 100% | 100% | 100% | | 2018年 | 100% | 100% | 100% | 100% | 100% | 100% | | 2022年 | 100% | 100% | 100% | 100% | 100% | 100% |
|
Statistics of sample analysis quality at different times
|
| 项目 | 北部2005年多目标调查区(n=145) | 南部2018年多目标调查区(n=36) | | 时间 | 最小值 | 最大值 | 均值 | 变异系数 | 时间 | 最小值 | 最大值 | 均值 | 变异系数 | | pH | 2005年 | 6.95 | 8.32 | 7.89 | 0.03 | 2018年 | 5.90 | 9.26 | 7.59 | 0.13 | | 2022年 | 5.31 | 8.56 | 7.91 | 0.05 | 2022年 | 5.74 | 7.86 | 6.90 | 0.06 | | 全碳 | 2005年 | 0.77 | 2.61 | 1.53 | 0.27 | 2018年 | 0.70 | 2.45 | 1.51 | 0.29 | | 2022年 | 0.67 | 3.31 | 1.57 | 0.27 | 2022年 | 0.49 | 2.57 | 1.18 | 0.44 | | 有机碳 | 2005年 | 0.41 | 2.73 | 0.89 | 0.36 | 2018年 | 0.51 | 1.60 | 0.90 | 0.27 | | 2022年 | 0.47 | 3.21 | 1.12 | 0.3 | 2022年 | 0.46 | 2.47 | 1.07 | 0.44 | | CaO | 2005年 | 0.98 | 11.28 | 4.30 | 0.49 | 2018年 | 1.55 | 11.17 | 3.86 | 0.64 | | 2022年 | 1.11 | 11.89 | 4.57 | 0.42 | 2022年 | 0.89 | 6.98 | 2.28 | 0.50 |
|
Content characteristics of pH, total carbon, organic carbon and CaO in soil of Luoyang City
|
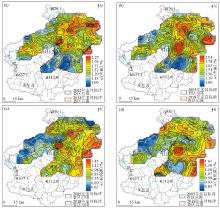
|
Isograms of total carbon and organic carbon in different periods of soil in Luoyang City
a—multi-objective survey full carbon contour; b—full carbon contour of this survey; c—multi-objective investigation of organic carbon contours; d—this survey of organic carbon contours
|
| 项目 | 北部2005年多目标调查区(n=145) | 南部2018年多目标调查区(n=36) | | 时间 | 最小值 | 最大值 | 均值 | 时间 | 最小值 | 最大值 | 均值 | | pH | 2005~
2022年 | -26.35 | 10.40 | 0.28 | 2018~
2022年 | -26.74 | 22.54 | -7.80 | | 全碳 | -39.46 | 240.91 | 6.55 | -71.72 | 55.63 | -19.45 | | 有机碳 | -50.08 | 167.21 | 33.44 | -60.90 | 141.83 | 23.47 | | CaO | -54.45 | 352.17 | 14.47 | -77.60 | 46.67 | -30.70 |
|
Statistical table of change rate of total carbon and organic carbon content in soil of Luoyang City %
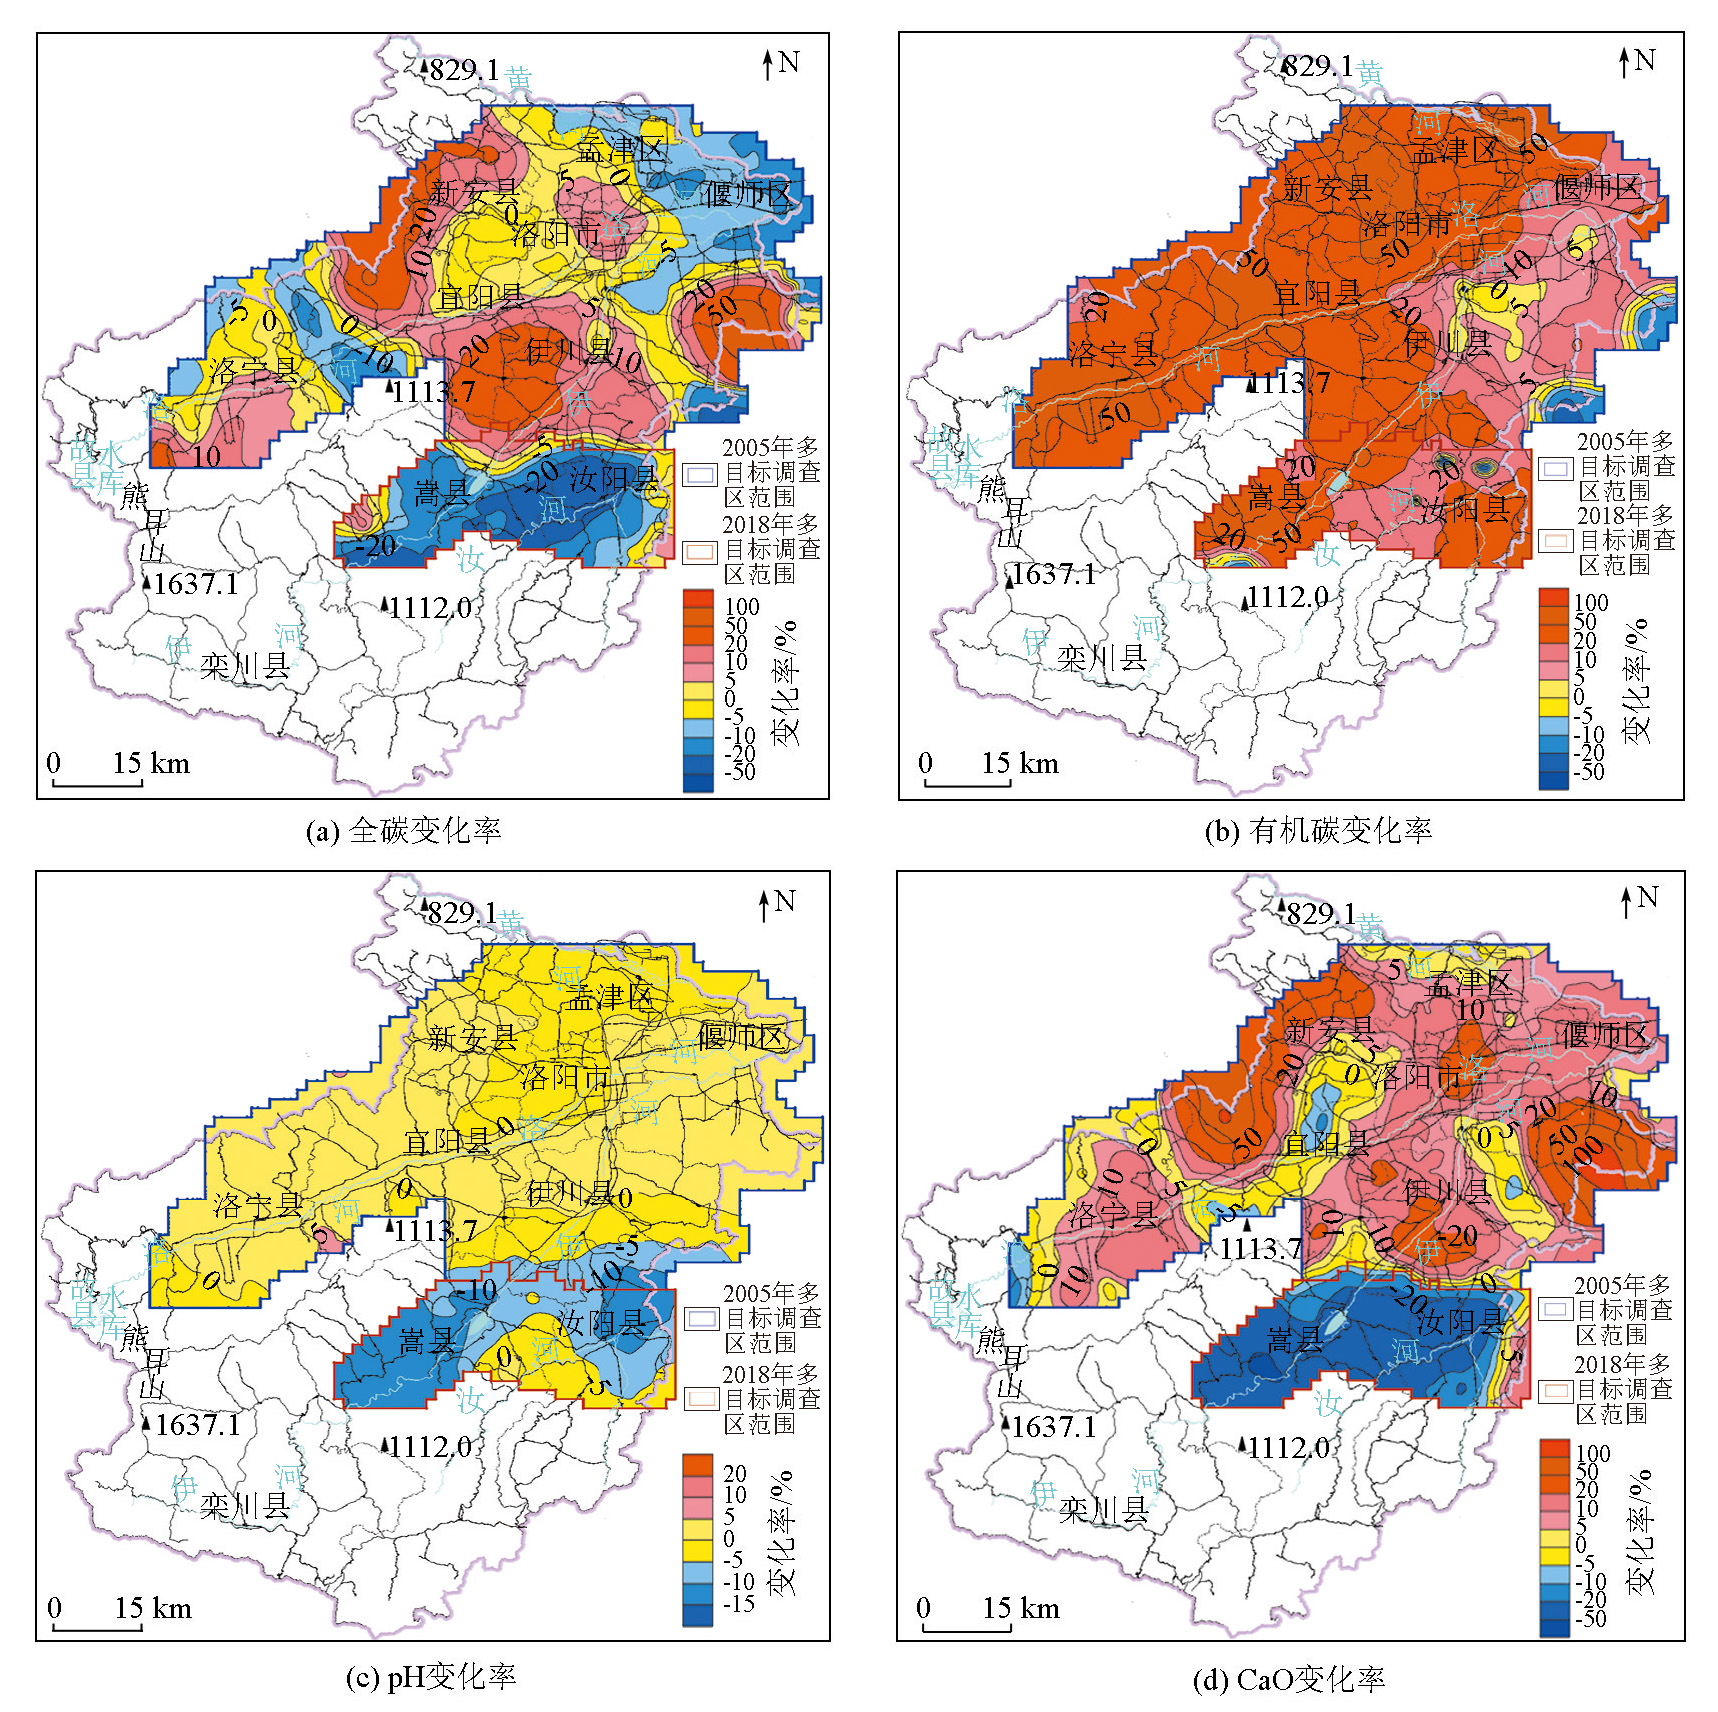
|

|
Distribution of total carbon, organic carbon, pH and CaO change rates in soil of Luoyang City
|
| 项目 | 地区 | pH | 全碳 | 有机碳 | N | P | SiO2 | Al2O3 | K2O | Na2O | CaO | MgO | Fe2O3 | | pH | 2022年 | 1 | 0.24** | -0.10 | -0.12 | 0.04 | -0.25** | -0.37** | -0.22** | 0.13 | 0.53** | 0.39** | -0.44** | | 2005年 | 1 | 0.35** | -0.21* | -0.45** | -0.08 | -0.44** | -0.36** | -0.10 | 0.07 | 0.51** | 0.23** | -0.29* | | 2018年 | 1 | 0.14 | -0.26 | -0.31 | -0.05 | -0.18 | 0.12 | 0.06 | -0.38* | 0.61** | 0.23 | -0.18 | | 全碳 | 2022年 | 0.24** | 1 | 0.66** | 0.23** | 0.25** | -0.53** | -0.42** | -0.34** | -0.06 | 0.72** | 0.27** | -0.36** | | 2005年 | 0.35** | 1 | 0.34** | -0.07 | 0.21* | -0.48** | -0.61** | -0.42** | 0.15 | 0.67** | 0.10 | -0.53** | | 2018年 | 0.14 | 1 | 0.76** | 0.67** | 0.24 | -0.05 | -0.45** | 0.06 | -0.20 | 0.43** | 0.02 | -0.21 | 有机
碳 | 2022年 | -0.10 | 0.66** | 1 | 0.37** | 0.32** | -0.14 | 0.01 | -0.05 | -0.13 | 0.01 | -0.06 | 0.01 | | 2005年 | -0.21* | 0.34** | 1 | 0.64** | 0.34** | 0.14 | 0.23** | 0.11 | -0.10 | -0.25** | -0.20* | 0.02 | | 2018年 | -0.26 | 0.76** | 1 | 0.91** | 0.19 | 0.31 | -0.42* | -0.14 | 0.06 | -0.22 | -0.17 | -0.27 | | CaO | 2022年 | 0.53** | 0.72** | 0.01 | -0.08 | 0.11 | -0.59** | -0.60** | -0.42** | 0.09 | 1 | 0.44** | -0.51** | | 2005年 | 0.51** | 0.67** | -0.25** | -0.44** | -0.03 | -0.81** | -0.63** | -0.45** | -0.10 | 1 | 0.19* | -0.35** | | 2018年 | 0.61** | 0.43** | -0.23 | -0.20 | 0.24 | -0.52** | -0.13 | 0.26 | -0.24 | 1 | 0.36* | 0.12 |
|
Correlation of total carbon, organic carbon, pH, main elements and oxide content in soil of Luoyang City
|
| 项目 | 地区 | pH | 全碳 | 有机碳 | N | P | SiO2 | Al2O3 | K2O | Na2O | CaO | MgO | Fe2O3 | | pH | 2022年 | 1 | 0.11 | -0.06 | -0.13 | -0.05 | -0.09 | -0.22** | -0.30** | 0.09 | 0.31** | 0.14 | -0.37** | | 2005年 | 1 | -0.03 | -0.07 | -0.10 | -0.05 | -0.02 | -0.05 | 0.03 | -0.05 | 0.1 | 0.05 | -0.14 | | 2018年 | 1 | -0.03 | -0.18 | -0.25 | -0.26 | -0.14 | 0.17 | 0.004 | -0.23 | 0.43** | 0.23 | -0.07 | | 全碳 | 2022年 | 0.11 | 1 | 0.51** | 0.22** | 0.19** | -0.43** | -0.49** | -0.47** | 0.22** | 0.74** | 0.29** | -0.44** | | 2005年 | -0.03 | 1 | 0.4** | 0.14 | 0.18* | -0.50** | -0.38** | -0.47** | 0.12 | 0.79** | 0.41** | -0.31** | | 2018年 | -0.03 | 1 | 0.90** | 0.87** | 0.14 | 0.10 | -0.58** | -0.28 | 0.11 | 0.27 | -0.12 | -0.47** | 有机
碳 | 2022年 | -0.06 | 0.51** | 1 | 0.43** | 0.33** | -0.07 | -0.08 | -0.17* | 0.06 | 0.10 | 0.08 | -0.13 | | 2005年 | -0.07 | 0.4** | 1 | 0.32** | 0.4** | -0.14 | 0.09 | -0.06 | 0.001 | 0.09 | 0.19* | 0.08 | | 2018年 | -0.18 | 0.90** | 1 | 0.96** | 0.09 | 0.21 | -0.39* | -0.3 | 0.10 | -0.01 | -0.19 | -0.42 | | CaO | 2022年 | 0.31** | 0.74** | 0.10 | -0.06 | 0.12 | -0.58** | -0.60** | -0.49** | 0.08 | 1 | 0.33** | -0.45** | | 2005年 | 0.1 | 0.79** | 0.09 | -0.05 | 0.1 | -0.59** | -0.55** | -0.56** | -0.03 | 1 | 0.39** | -0.37** | | 2018年 | 0.43** | 0.27 | -0.01 | -0.06 | 0.01 | -0.49** | -0.26 | 0.16 | -0.41* | 1 | 0.15 | -0.02 |
|
Correlation of the change rate between total carbon, organic carbon, pH, major elements and oxide in soil of Luoyang City
|
| 区域 | 样品数 | 项目 | 最小值 | 最大值 | 均值 | 标准偏差 | 变异系数 | | 2005年多目标调查区 | 145 | 全碳密度/(t·hm-2) | 11.48 | 95.91 | 44.74 | 12.43 | 0.28 | | 有机碳密度/(t·hm-2) | 10.86 | 73.61 | 31.75 | 8.81 | 0.28 | | 2018年多目标调查区 | 36 | 全碳密度/(t·hm-2) | 14.55 | 79.62 | 34.27 | 15.69 | 0.46 | | 有机碳密度/(t·hm-2) | 13.65 | 76.54 | 30.94 | 14.30 | 0.46 | | 全区 | 181 | 全碳密度/(t·hm-2) | 11.48 | 95.91 | 42.66 | 13.75 | 0.32 | | 有机碳密度/(t·hm-2) | 10.86 | 76.54 | 31.59 | 10.10 | 0.32 |
|
Characteristic values of total carbon and organic carbon density in soil of Luoyang City
|
| 国家和地区 | 有机碳密度/
(t·hm-2) | 文献 | 发表时
间/年 | | 全球表土 | 47. 8 | [15] | 2019 | | 欧盟农田表土 | 53.0 | [15] | 2019 | | 美国表土 | 50. 3 | [15] | 2019 | | 巴西表土 | 44.1 | [15] | 2019 | | 印度表土 | 63.8 | [15] | 2019 | | 中国自然土壤 | 48.7 | [16] | 2005 | | 中国农田土壤(2008) | 38.5 | [17] | 2008 | | 中国农田土壤(1981) | 28.6 | [18] | 2018 | | 中国农田土壤(2011) | 32.9 | [18] | 2018 | | 中国东北农田土壤(2011) | 42.2 | [18] | 2018 | | 中国北部农田土壤(2011) | 21.2 | [18] | 2018 | | 中国东部农田土壤(2011) | 30.4 | [18] | 2018 | | 中国西南农田土壤(2011) | 34.1 | [18] | 2018 | | 中国中南农田土壤(2011) | 29.6 | [18] | 2018 | | 中国西北农田土壤(2011) | 21.0 | [18] | 2018 | | 中国土壤 | 91.7 | [19] | 2003 | | 河南省耕地土壤 | 23.9 | [20] | 2014 | | 2005年调查区 | 31.75 | 本次研究 | 2023 | | 2018年调查区 | 30.94 | 本次研究 | 2023 |
|
Comparison of soil carbon density between the study area and domestic and foreign farmland
|
| 区域 | 样品数 | 项目 | 最小值 | 最大值 | 均值 | 标准偏差 | | 2005年多目标调查区 | 145 | 全碳密度变化量/(t·hm-2) | -28.73 | 67.78 | 0.71 | 12.05 | | 有机碳密度变化量/(t·hm-2) | -31.51 | 28.90 | 6.64 | 8.31 | | 2018年多目标调查区 | 36 | 全碳密度变化量/(t·hm-2) | -37.92 | 23.01 | -9.64 | 14.87 | | 有机碳密度变化量/(t·hm-2) | -21.25 | 41.89 | 4.73 | 13.92 | | 全区 | 181 | 全碳密度变化量/(t·hm-2) | -37.92 | 67.78 | -1.35 | 13.28 | | 有机碳密度变化量/(t·hm-2) | -31.51 | 41.89 | 6.26 | 9.67 |
|
Characteristics of soil carbon density change in Luoyang City
|
| 调查区 | 全碳/(kg·(hm2·a-1)) | 有机碳/(kg·(hm2·a-1)) | | 2005年 | 41.73 | 390.75 | | 2018年 | -2 410.50 | 1 181.75 |
|
Scale of carbon density change in soil of Luoyang City
|
| 区域 | 面积/km2 | 面积/hm2 | 全碳密度/
(t·hm-2) | 全碳储量
(万t) | | 2005年调查区 | 2 796.634 | 279 663.424 | 44.737 | 1 251.130 | | 2018年调查区 | 572.918 | 5 7291.747 | 34.272 | 196.350 | | 合计 | 3 369.552 | 336 955.171 | 42.958 | 1447.481 | | 区域 | 面积/km2 | 面积/hm2 | 有机碳密度/
(t·hm-2) | 有机碳储量
(万t) | | 2005年调查区 | 2 796.634 | 279 663.424 | 31.751 | 887.959 | | 2018年调查区 | 572.917 | 57 291.747 | 30.940 | 177.261 | | 合计 | 3 369.552 | 336 955.171 | 31.613 | 1 065.220 |
|
Total carbon and organic carbon reserves in soil of Luoyang City
|
| 区域 | 面积/km2 | 面积/hm2 | 全碳密度变化
/(t·hm-2) | 全碳汇变
化/(万t) | | 2005年调查区 | 2 796.634 | 279 663.424 | 0.709 | 19.828 | | 2018年调查区 | 572.918 | 57 291.747 | -9.642 | -55.241 | | 合计 | 3 369.552 | 336 955.171 | -1.051 | -35.413 | | 区域 | 面积/km2 | 面积/hm2 | 有机碳密度变
化/(t·hm-2) | 有机碳汇变
化/(万t) | | 2005年调查区 | 2 796.634 | 279 663.424 | 6.643 | 185.780 | | 2018年调查区 | 572.918 | 57 291.747 | 4.727 | 27.082 | | 合计 | 3 369.552 | 336 955.171 | 6.317 | 212.862 |
|
Change table of total carbon and organic carbon sink in farmland soil of Luoyang City
|
| [1] |
刘青丽, 蒋雨洲, 邹焱, 等. 烟田生态系统碳收支研究[J]. 作物学报, 2020, 46(8):1258-1265.
|
| [1] |
Liu Q L, Jiang Y Z, Zou Y, et al. The study of carbon budget on field-tobacco ecosystem[J]. Acta Agronomica Sinica, 2020, 46(8):1258-1265.
|
| [2] |
孙文娟, 黄耀, 张稳, 等. 农田土壤固碳潜力研究的关键科学问题[J]. 地球科学进展, 2008, 23(9):996-1004.
|
| [2] |
Sun W J, Huang Y, Zhang W, et al. Key issues on soil carbon sequestration potential in agricultural soils[J]. Advances in Earth Science, 2008, 23(9):996-1004.
|
| [3] |
韩松, 秦路, 张建伦. 国际农业土壤碳交易机制发展现状、问题及启示[J]. 世界农业, 2014(8):38-42.
|
| [3] |
Han S, Qin L, Zhang J L. Development status,problems and enlightenment of international agricultural soil carbon trading mechanism[J]. World Agriculture, 2014(8):38-42.
|
| [4] |
杨元合, 石岳, 孙文娟, 等. 中国及全球陆地生态系统碳源汇特征及其对碳中和的贡献[J]. 中国科学:生命科学, 2022, 52(4):534-574.
|
| [4] |
Yang Y H, Shi Y, Sun W J, et al. Terrestrial carbon sinks in China and around the world and their contribution to carbon neutrality[J]. Scientia Sinica:Vitae, 2022, 52(4):534-574.
|
| [5] |
Ren W, Banger K, Tao B, et al. Global pattern and change of cropland soil organic carbon during 1901—2010:Roles of climate,atmospheric chemistry,land use and management[J]. Geography and Sustainability, 2020, 1(1):59-69.
|
| [6] |
赵宁, 周蕾, 庄杰, 等. 中国陆地生态系统碳源/汇整合分析[J]. 生态学报, 2021, 41(19):7648-7658.
|
| [6] |
Zhao N, Zhou L, Zhuang J, et al. Integration analysis of the carbon sources and sinks in terrestrial ecosystems,China[J]. Acta Ecologica Sinica, 2021, 41(19):7648-7658.
|
| [7] |
邱巡巡, 曹广超, 曹生奎, 等. 祁连山南坡农田土壤碳氮含量垂直分布特征及其影响因素[J]. 水土保持通报, 2022, 42(3):366-372.
|
| [7] |
Qiu X X, Cao G C, Cao S K, et al. Vertical distribution characteristics and influencing factors of soil carbon and nitrogen content in farmland on southern slope of Qilian Mountains[J]. Bulletin of Soil and Water Conservation, 2022, 42(3):366-372.
|
| [8] |
张晓彤, 张亚东, 普正仙, 等. 不同施肥处理对柚园土壤酸度及养分的影响[J]. 中国土壤与肥料, 2023(1):81-89.
|
| [8] |
Zhang X T, Zhang Y D, Pu Z X, et al. Effects of different fertilization treatments on soil acidity and nutrients in pomelo orchard[J]. Soil and Fertilizer Sciences in China, 2023(1):81-89.
|
| [9] |
沈玉叶, 张忠启, 王美艳, 等. 毕节植烟区土壤pH的分布特征及其与主要养分的相关性[J]. 贵州农业科学, 2020, 48(10):44-49.
|
| [9] |
Shen Y Y, Zhang Z Q, Wang M Y, et al. Distribution characteristics of soil pH and its correlation with main nutrients in Bijie tobacco-growing area[J]. Guizhou Agricultural Sciences, 2020, 48(10):44-49.
|
| [10] |
贺丹锋, 周冀衡, 张毅, 等. 云南省罗平烟区植烟土壤pH分布特征及其与土壤养分的相关性[J]. 作物研究, 2016, 30(2):136-141.
|
| [10] |
He D F, Zhou J H, Zhang Y, et al. Soil pH value distribution and its correlation with nutrients in Luoping tobacco growing area of Yunnan Province[J]. Crop Research, 2016, 30(2):136-141.
|
| [11] |
马子钰, 马文林. 施肥对中国农田土壤固碳影响效应研究[J]. 土壤, 2022, 54(5):905-911.
|
| [11] |
Ma Z Y, Ma W L. Effects of fertilization on soil organic carbon in cropland of China[J]. Soils, 2022, 54(5):905-911.
|
| [12] |
张娜娜, 孙武. 施用化肥影响土壤团聚体稳定性及有机碳、全氮含量的meta分析[J]. 草原与草坪, 2022, 42(5):159-168.
|
| [12] |
Zhang N N, Sun W. The effects of application of chemical fertilizer on soil agglomeration stability and organic carbon and total nitrogen distribution:A meta-analysis[J]. Grassland and Ture, 2022, 42(5):159-168.
|
| [13] |
陶漉, 马东豪, 张丛志, 等. 石灰性土壤团聚体中钙形态特征及其与有机碳含量的关系[J]. 土壤, 2021, 53(4):715-722.
|
| [13] |
Tao L, Ma D H, Zhang C Z, et al. Distribution characteristics of calcium forms and their relations with organic carbon content in calcareous soil aggregates[J]. Soils, 2021, 53(4):715-722.
|
| [14] |
李忠徽, 魏彬萌, 刘丹, 等. 黄绵土中碳酸钙含量和有机肥施用对土壤有机碳组分及CO2排放的影响[J]. 环境科学学报, 2018, 38(6):2498-2505.
|
| [14] |
Li Z H, Wei B M, Liu D, et al. Effect of calcium carbonate content and composted manure application on soil organic carbon fractions and CO2 emissions in loessal soil[J]. Acta Scientiae Circumstantiae, 2018, 38(6):2498-2505.
|
| [15] |
赵占辉. 河南省典型农田土壤有机碳时空分异特征研究[D]. 焦作: 河南理工大学, 2019.
|
| [15] |
Zhao Z H. Temporal and spatial differentiation characteristics of soil organic carbon in typical farmland in Henan Province[D]. Jiaozuo: Henan Polytechnic University, 2019.
|
| [16] |
潘根兴, 赵其国. 我国农田土壤碳库演变研究:全球变化和国家粮食安全[J]. 地球科学进展, 2005, 20(4):384-393.
|
| [16] |
Pan G X, Zhao Q G. Study on evolution of organic carbon stock in agricultural soils of China:Facing the challenge of global change and food security[J]. Advance in Earth Sciences, 2005, 20(4):384-393.
|
| [17] |
潘根兴. 中国土壤有机碳库及其演变与应对气候变化[J]. 气候变化研究进展, 2008, 4(5):282-289.
|
| [17] |
Pan G X. Soil organic carbon stock,dynamics and climate change mitigation of China[J]. Advances in Climate Change Research, 2008, 4(5):282-289.
|
| [18] |
Zhao Y C, Wang M Y, Hu S J, et al. Economics- and policy-driven organic carbon input enhancement dominates soil organic carbon accumulation in Chinese croplands[J]. Proceedings of the National Academy of Sciences of the United States of America, 2018, 115(16):4045-4050.
|
| [19] |
李克让, 王绍强, 曹明奎. 中国植被和土壤碳贮量[J]. 中国科学D辑:地球科学, 2003, 33(1):72-80.
|
| [19] |
Li K R, Wang S Q, Cao M K. Vegetation and soil carbon storage in China[J]. Science in China Series D:Earth Sciences, 2003, 33(1):72-80.
|
| [20] |
靳熙. 河南省耕地表层土壤有机碳储量估算与尺度效应分析[D]. 郑州: 郑州大学, 2014.
|
| [20] |
Jin X. Estimation and scale effect analysis of organic carbon storage in topsoil of cultivated land in Henan Province[D]. Zhengzhou: Zhengzhou University, 2014.
|
| [21] |
赵永存, 于东升, 董琳琳, 等. 中国农田碳源汇分布及其驱动因子分析——全球陆地碳汇的遥感和优化计算方法[M]. 北京: 科学出版社,2015:195-232.
|
| [21] |
Zhao Y C, Yu D S, Dong L L, et al. Analysis of carbon source sink distribution and driving factors in farmland in China—Remote sensing and optimization calculation method of global terrestrial carbon sink[M]. Beijing: Science Press,2015:195-232.
|
| [22] |
Qin Z C, Huang Y, Zhuang Q L. Soil organic carbon sequestration potential of cropland in China[J]. Global Biogeochemical Cycles, 2013, 27(3):711-722.
|
| [23] |
赵荣钦, 刘英, 丁明磊, 等. 河南省农田生态系统碳源/汇研究[J]. 河南农业科学, 2010, 39(7):40-44.
|
| [23] |
Zhao R Q, Liu Y, Ding M L, et al. Research on carbon source and sink of farmland ecosystem in Henan Province[J]. Journal of Henan Agricultural Sciences, 2010, 39(7):40-44.
|
| [24] |
黄耀, 孙文娟. 近20年来中国大陆农田表土有机碳含量的变化趋势[J]. 科学通报, 2006, 51(7):750-763.
|
| [24] |
Huang Y, Sun W J. Variation trend of organic carbon content in farmland topsoil in Chinese mainland in recent 20 years[J]. Chinese Science Bulletin, 2006, 51(7):750-763.
|
| [25] |
张晓伟, 许明祥, 师晨迪, 等. 半干旱区县域农田土壤有机碳固存速率及其影响因素——以甘肃庄浪县为例[J]. 植物营养与肥料学报, 2012, 18(5):1086-1095.
|
| [25] |
Zhang X W, Xu M X, Shi C D, et al. Soil organic carbon sequestration rate and its influencing factors in farmlands of semi-arid regions—A case study in Zhuanglang County,Gansu Province[J]. Plant Nutrition and Fertilizer Science, 2012, 18(5):1086-1095.
|
| [26] |
赵明松, 张甘霖, 王德彩, 等. 徐淮黄泛平原土壤有机质空间变异特征及主控因素分析[J]. 土壤学报, 2013, 50(1):1-11.
|
| [26] |
Zhao M S, Zhang G L, Wang D C, et al. Spatial variability of soil organic matter and its dominating factors in Xu-Huai alluvial plain[J]. Acta Pedologica Sinica, 2013, 50(1):1-11.
|
| [27] |
曹建华, 杨慧, 康志强. 区域碳酸盐岩溶蚀作用碳汇通量估算初探:以珠江流域为例[J]. 科学通报, 2011, 56(26):2181-2187.
|
| [27] |
Cao J H, Yang H, Kang Z Q. Preliminary regional estimation of carbon sink flux by carbonate rock corrosion:A case study of the Pearl River Basin[J]. Chinese Science Bulletin, 2011, 56(26):2181-2187.
|
| [28] |
邱冬生, 庄大方, 胡云锋, 等. 中国岩石风化作用所致的碳汇能力估算[J]. 地球科学, 2004, 29(2):177-182,190.
|
| [28] |
Qiu D S, Zhuang D F, Hu Y F, et al. Estimation of carbon sink capacity caused by rock weathering in China[J]. Earth Science, 2004, 29(2):177-182,190.
|
| [29] |
吴乐知, 蔡祖聪. 基于长期试验资料对中国农田表土有机碳含量变化的估算[J]. 生态环境, 2007, 16(6):1768-1774.
|
| [29] |
Wu L Z, Cai Z C. Estimation of the change of topsoil organic carbon of croplands in China based on long-term experimental data[J]. Ecology and Environment, 2007, 16(6):1768-1774.
|
| [30] |
Tang X L, Zhao X, Bai Y F, et al. Carbon pools in China’s terrestrial ecosystems:New estimates based on an intensive field survey[J]. Proceedings of the National Academy of Sciences of the United States of America, 2018, 115(16):4021-4026.
|
| [31] |
王树会, 陶雯, 梁硕, 等. 长期施用有机肥情景下华北平原旱地土壤固碳及N2O排放的空间格局[J]. 中国农业科学, 2022, 55(6):1159-1171.
|
| [31] |
Wang S H, Tao W, Liang S, et al. The spatial characteristics of soil organic carbon sequestration and N2O emission with long-term manure fertilization scenarios from dry land in North China Plain[J]. Scientia Agricultura Sinica, 2022, 55(6):1159-1171.
|
| [32] |
金琳, 李玉娥, 高清竹, 等. 中国农田管理土壤碳汇估算[J]. 中国农业科学, 2008, 41(3):734-743.
|
| [32] |
Jin L, Li Yu E, Gao Q Z, et al. Estimate of carbon sequestration under cropland management in China[J]. Scientia Agricultura Sinica, 2008, 41(3):734-743.
|
| [33] |
González-Méndez B, Ruiz-Suárez L G, Siebe C. N2O emission factors from a wastewater irrigated land in a semiarid environment in Mexico[J]. Science of the Total Environment, 2020,709:136177.
|
| [34] |
Guo Y L, Luo L G, Chen G X, et al. Mitigating nitrous oxide emissions from a maize-cropping black soil in Northeast China by a combination of reducing chemical N fertilizer application and applying manure in autumn[J]. Soil Science and Plant Nutrition, 2013, 59(3):392-402.
|
| [35] |
丁仲礼. 中国碳中和框架路线图研究[C]// 中国科学院学部第七届学术年会, 2021.
|
| [35] |
Ding Z L. Research on China’s carbon neutral framework roadmap[C]// The 7th Annual Conference of the Faculty of Chinese Academy of Sciences.2021
|
| [36] |
Huang Q B, Qin X Q, Liu P Y, et al. Impact of sulfuric and nitric acids on carbonate dissolution,and the associated deficit of CO2 uptake in the upper-middle reaches of the Wujiang River,China[J]. Journal of Contaminant Hydrology, 2017,203:18-27.
|
| [37] |
黄奇波, 覃小群, 程瑞瑞, 等. 硫酸型酸雨参与碳酸盐岩溶蚀的研究进展[J]. 中国岩溶, 2019, 38(2):149-156.
|
| [37] |
Huang Q B, Qin X Q, Cheng R R, et al. Research progress of sulfuric acid rain participating in the dissolution of carbonate rocks[J]. Carsologica Sinica, 2019, 38(2):149-156.
|
| [38] |
Xie Y C, Huang F, Yang H, et al. Role of anthropogenic sulfuric and nitric acids in carbonate weathering and associated carbon sink budget in a Karst catchment (Guohua),south Western China[J]. Journal of Hydrology, 2021,599:126287.
|
| [39] |
谢银财, 于奭, 缪雄谊, 等. 青藏高原流域岩石风化机制及其CO2消耗通量:以拉萨河为例[J]. 地学前缘, 2023, 30(5):510-525.
|
| [39] |
Xie Y C, Yu S, Miao X Y, et al. Chemical weathering and its associated CO2 consumption on the Tibetan Plateau:A case of the Lhasa River Basin[J]. Earth Science Frontiers, 2023, 30(5):510-525.
|
| [40] |
Shi T R, Ma J, Wu X, et al. Inventories of heavy metal inputs and outputs to and from agricultural soils:A review[J]. Ecotoxicology and Environmental Safety, 2018,164:118-124.
|
| [41] |
Peng H, Chen Y L, Weng L P, et al. Comparisons of heavy metal input inventory in agricultural soils in north and South China:A review[J]. Science of the Total Environment, 2019,660:776-786.
|
| [42] |
陈雅丽, 翁莉萍, 马杰, 等. 近十年中国土壤重金属污染源解析研究进展[J]. 农业环境科学学报, 2019, 38(10):2219-2238.
|
| [42] |
Chen Y L, Weng L P, Ma J, et al. Review on the last ten years of research on source identification of heavy metal pollution in soils[J]. Journal of Agro-Environment Science, 2019, 38(10):2219-2238.
|
| [43] |
胡超进, 孙建伟, 商连南, 等. 熊耳山—伏牛山矿区水土重金属污染分析[J]. 绿色科技, 2022, 24(2):137-143.
|
| [43] |
Hu C J, Sun J W, Shang L N, et al. Analysis of heavy metal pollution in soil and water of Xiong ershan-Funiushan mining area[J]. Journal of Green Science and Technology, 2022, 24(2):137-143.
|
| [1] |
Adilai Saitiniyazi, DUAN Xing-Xing, HE Jun-Ling, WANG Cui-Cui, DONG Yue. Carbon stocks and carbon density distribution of soil in oases on the northern margin of the Tarim Basin[J]. Geophysical and Geochemical Exploration, 2025, 49(1): 229-238. |
| [2] |
DUAN Xing-Xing, LIU Xiao-Long, HAN Bao-Hua, Adilai·Saitiniyazi , JIN Meng-Ting, LIU Tong. Stocks and content of organic and inorganic carbon in soil of the Loess Plateau region[J]. Geophysical and Geochemical Exploration, 2025, 49(1): 239-247. |
|
|
|
|