|
|
|
| Research on dynamic compaction detection of the transient R-surface wave technology |
| Ming-Long LUAN |
| Beijing Institute of Water Conservancy Planing and Designing,Beijing 100048,China |
|
|
|
|
Abstract The traditional detection of foundation improvement mainly depends on dynamic penetration test,drilling holes test,standard penetration test and plate loading test;nevertheless,these methods are all characterized by inefficiency and high dispersion degree,and hence can't totally reflect the detection of foundation improvement.So it is necessary to develop a fast way to detect the dynamic foundation.Based on the Garden Expo Wetlands Project,the authors gave an in-depth discussion on the transient Rayleigh wave detection method.Through the processing and analysis of a large number of Rayleigh wave data collected in this project and comparing with the in-situ test results,the authors established the correlation between Rayleigh wave velocity and in-situ test data,and studied the application effect of Rayleigh wave technology in quality testing.
|
|
Received: 27 July 2019
Published: 24 June 2020
|
|
|
|
|
|
| 试验场地 | 夯点间距
/m | 夯点数量 | 单击夯击能/(kN·m) | 夯锤重量
/t | 夯锤落距
/m | 单点击数 | | 点夯能级 | 满夯能级 | | 1# | 5.0×5.0 | 113 | 5000 | 1000 | 40 | 14 | 9 | | 2# | 5.0×5.0 | 113 | 3000 | 1000 | 40 | 8.5 | 7 |
|
Construction parameters of dynamic compaction test site
|
|
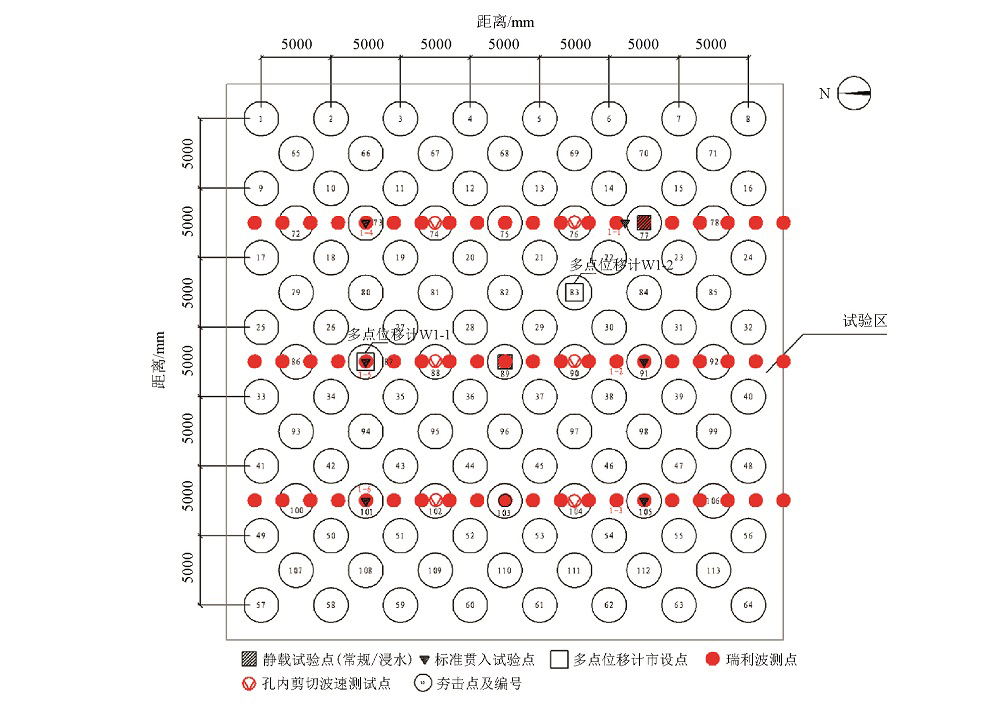
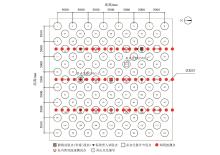
Layout of Rayleigh wave test points in 1# test site
|
|
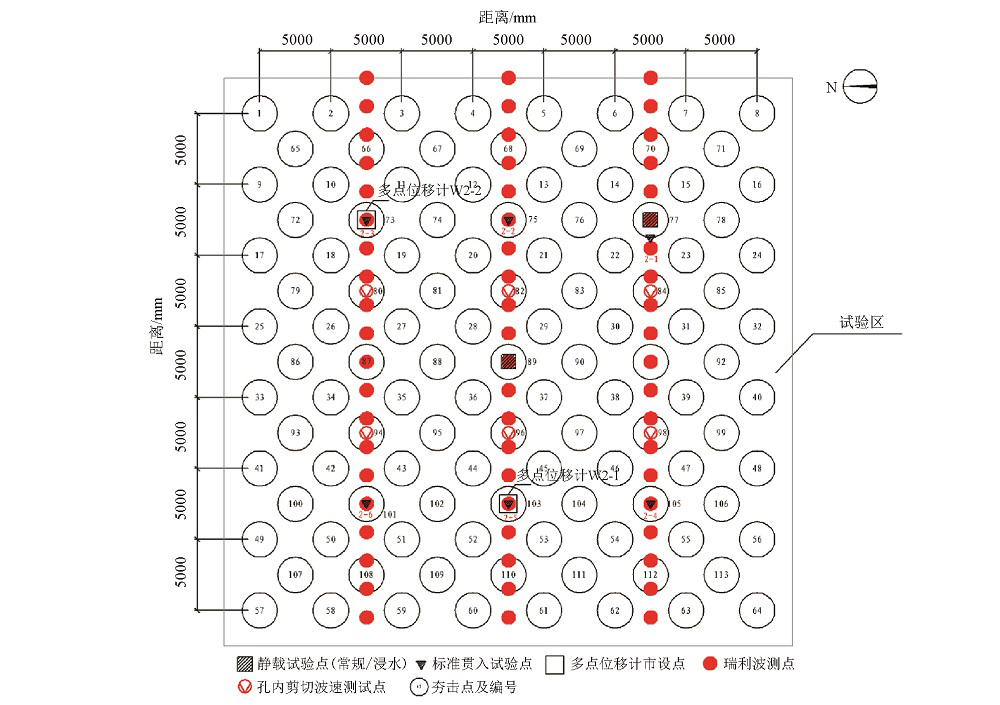
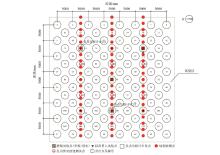
Layout of Rayleigh wave test points in 2# test site
|
|
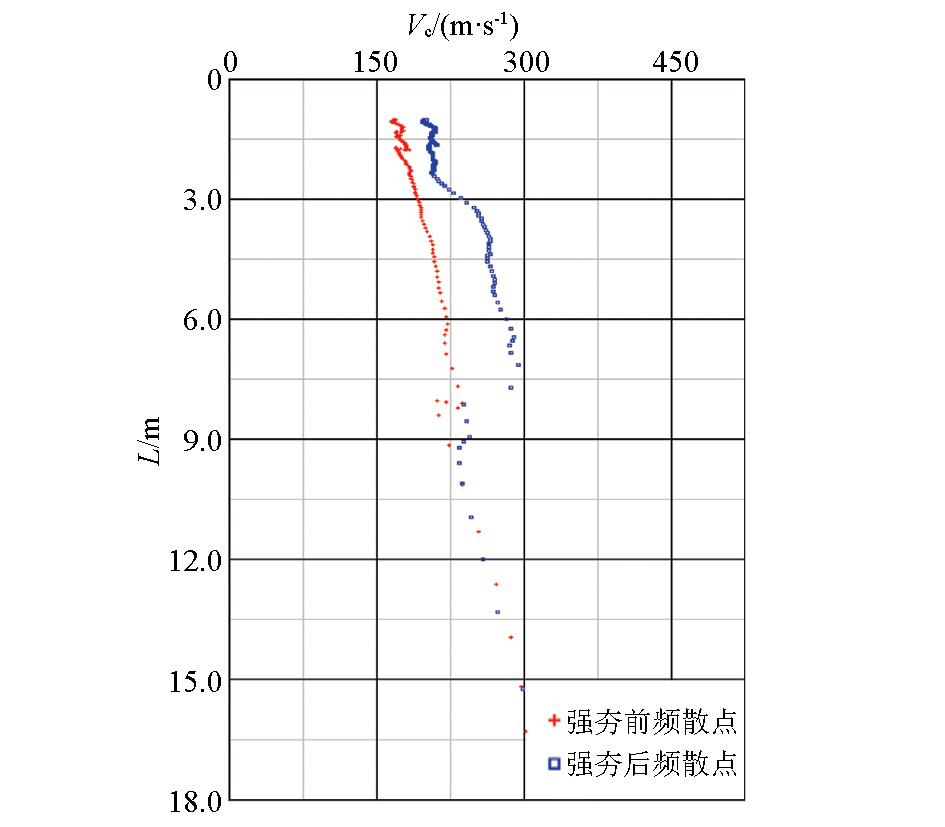
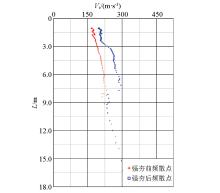
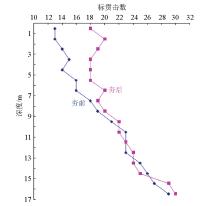
Contrast chart of wave sound velocity with depth before and after dynamic compaction at 1-1 test point of 1# test site
|

|
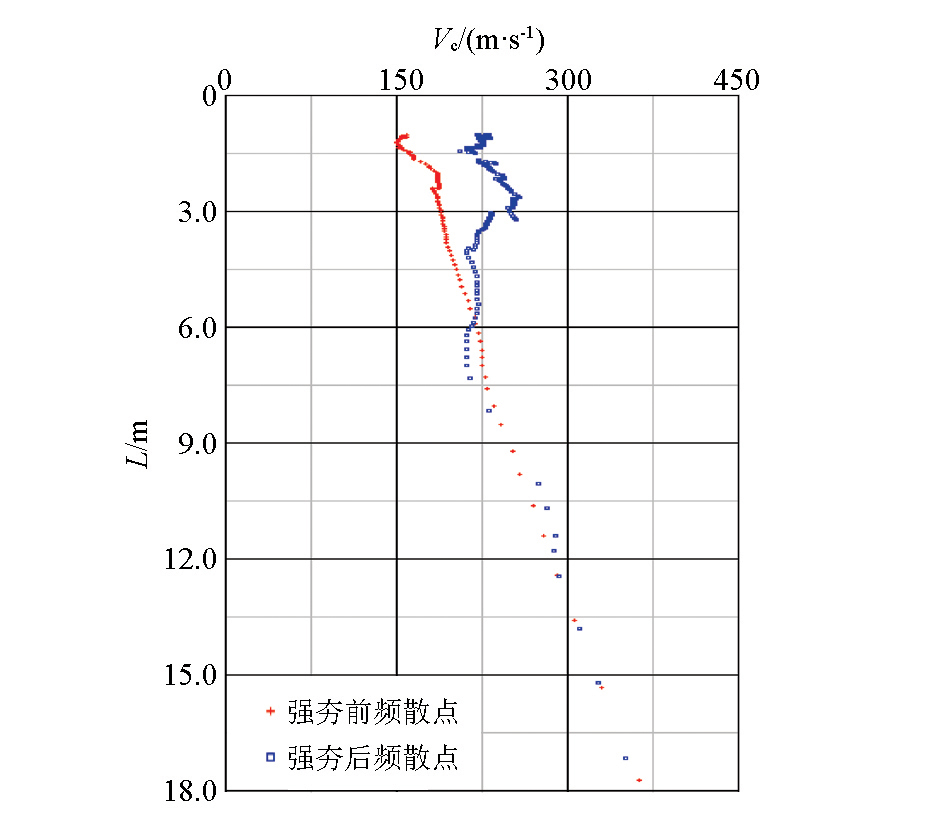
Contrast chart of wave sound velocity with depth before and after dynamic compaction at 2-4 test point of 2# test site
|
深度
/m | 1-1检测点 | 1-2检测点 | 1-3检测点 | 1-4检测点 | 1-5检测点 | 1-6检测点 | | 夯前 | 夯后 | 增幅 | 夯前 | 夯后 | 增幅 | 夯前 | 夯后 | 增幅 | 夯前 | 夯后 | 增幅 | 夯前 | 夯后 | 增幅 | 夯前 | 夯后 | 增幅 | | 1 | 175 | 200 | 14% | 185 | 202 | 9% | 185 | 210 | 14% | 170 | 190 | 12% | 180 | 195 | 8% | 175 | 200 | 14% | | 2 | 170 | 206 | 21% | 174 | 205 | 18% | 195 | 227 | 16% | 174 | 195 | 12% | 185 | 194 | 5% | 168 | 196 | 17% | | 3 | 184 | 214 | 16% | 184 | 213 | 16% | 185 | 223 | 21% | 190 | 219 | 15% | 194 | 211 | 9% | 172 | 212 | 23% | | 4 | 197 | 248 | 26% | 197 | 247 | 25% | 189 | 211 | 12% | 199 | 225 | 13% | 210 | 226 | 8% | 192 | 215 | 12% | | 5 | 209 | 264 | 26% | 211 | 265 | 26% | 194 | 208 | 7% | 202 | 232 | 15% | 207 | 241 | 16% | 199 | 219 | 10% | | 6 | 216 | 265 | 23% | 216 | 271 | 25% | 199 | 215 | 8% | 210 | 243 | 16% | 206 | 248 | 20% | 208 | 226 | 9% | | 7 | 220 | 250 | 14% | 216 | 268 | 24% | 200 | 217 | 9% | 212 | 245 | 16% | 215 | 242 | 13% | 214 | 229 | 7% | | 8 | 229 | 249 | 9% | 227 | 258 | 14% | 205 | 214 | 4% | 217 | 244 | 12% | 234 | 250 | 7% | 218 | 232 | 6% | | 9 | 216 | 235 | 9% | 235 | 234 | 0% | 212 | 211 | 0% | 227 | 254 | 12% | 242 | 252 | 4% | 223 | 237 | 6% | | 10 | 230 | 233 | 1% | 240 | 237 | -1% | 220 | 217 | -1% | 240 | 260 | 8% | 251 | 255 | 2% | 234 | 239 | 2% | | 11 | 243 | 242 | 0% | 250 | 246 | -2% | 229 | 228 | 0% | 248 | 262 | 6% | 260 | 262 | 1% | 245 | 243 | -1% | | 12 | 257 | 253 | -2% | 254 | 253 | 0% | 239 | 240 | 0% | 253 | 255 | 1% | 268 | 270 | 1% | 254 | 250 | -2% | | 13 | 269 | 264 | -2% | 259 | 262 | 1% | 250 | 251 | 0% | 263 | 261 | -1% | 279 | 281 | 1% | 262 | 258 | -2% | | 14 | 280 | 278 | -1% | 277 | 276 | 0% | 259 | 259 | 0% | 273 | 271 | -1% | 286 | 289 | 1% | 269 | 265 | -1% | | 15 | 290 | 291 | 0% | 288 | 290 | 1% | 268 | 269 | 0% | 285 | 282 | -1% | 295 | 297 | 1% | 275 | 276 | 0% | | 16 | 297 | 300 | 1% | 295 | 299 | 1% | 275 | 275 | 0% | 297 | 294 | -1% | 300 | 304 | 1% | 282 | 285 | 1% | | 17 | 309 | 312 | 1% | 310 | 311 | 0% | 280 | 280 | 0% | 302 | 303 | 0% | 310 | 313 | 1% | 293 | 295 | 1% | | 18 | 323 | 325 | 1% | 326 | 326 | 0% | 288 | 289 | 0% | 323 | 320 | -1% | 321 | 322 | 0% | 302 | 305 | 1% |
|
Comparison table of Rayleigh wave velocity change before and after dynamic compaction in 1# test site
|
深度
/m | 2-1检测点 | 2-2检测点 | 2-3检测点 | 2-4检测点 | 2-5检测点 | 2-6检测点 | | 夯前 | 夯后 | 增幅 | 夯前 | 夯后 | 增幅 | 夯前 | 夯后 | 增幅 | 夯前 | 夯后 | 增幅 | 夯前 | 夯后 | 增幅 | 夯前 | 夯后 | 增幅 | | 1 | 183 | 190 | 4% | 180 | 190 | 6% | 175 | 200 | 14% | 170 | 220 | 29% | 180 | 190 | 6% | 175 | 205 | 17% | | 2 | 186 | 193 | 4% | 175 | 205 | 17% | 170 | 195 | 15% | 168 | 240 | 43% | 192 | 205 | 7% | 173 | 204 | 18% | | 3 | 183 | 206 | 13% | 184 | 227 | 23% | 186 | 204 | 10% | 185 | 227 | 23% | 183 | 210 | 15% | 185 | 213 | 15% | | 4 | 193 | 225 | 17% | 196 | 240 | 22% | 193 | 216 | 12% | 193 | 219 | 13% | 194 | 213 | 10% | 192 | 217 | 13% | | 5 | 207 | 241 | 16% | 210 | 249 | 19% | 205 | 223 | 9% | 202 | 219 | 8%% | 203 | 221 | 9% | 201 | 224 | 11% | | 6 | 209 | 243 | 16% | 215 | 251 | 17% | 208 | 226 | 9% | 215 | 212 | -1 | 209 | 234 | 12% | 211 | 235 | 11% | | 7 | 217 | 239 | 10% | 220 | 245 | 11% | 225 | 229 | 2% | 222 | 220 | -1% | 208 | 230 | 11% | 217 | 225 | 4% | | 8 | 232 | 248 | 7% | 228 | 230 | 1% | 231 | 232 | 0% | 231 | 229 | -1% | 212 | 220 | 4% | 215 | 222 | 3% | | 9 | 248 | 250 | 1% | 235 | 234 | 0%% | 227 | 229 | 1% | 242 | 241 | 0% | 219 | 221 | 1% | 225 | 231 | 3% | | 10 | 257 | 256 | 0% | 236 | 235 | 0 | 238 | 239 | 0% | 273 | 276 | 1% | 223 | 226 | 1% | 237 | 242 | 2% | | 11 | 270 | 267 | -1% | 238 | 236 | -1% | 250 | 250 | 0% | 285 | 285 | 0% | 232 | 235 | 1% | 246 | 246 | 0% | | 12 | 279 | 276 | -1% | 233 | 236 | 1% | 259 | 259 | 0% | 287 | 289 | 1% | 245 | 243 | -1% | 256 | 253 | -1% | | 13 | 279 | 280 | 0% | 235 | 237 | 1% | 271 | 269 | -1% | 293 | 294 | 0% | 255 | 253 | -1% | 266 | 264 | -1% | | 14 | 284 | 285 | 0% | 239 | 242 | 1% | 278 | 279 | 0% | 305 | 305 | 0% | 265 | 263 | -1% | 275 | 274 | 0% | | 15 | 289 | 290 | 0% | 247 | 250 | 1% | 287 | 288 | 0% | 319 | 319 | 0% | 273 | 272 | 0% | 284 | 284 | 0% | | 16 | 290 | 291 | 0% | 258 | 260 | 1% | 297 | 300 | 1% | 333 | 333 | 0% | 282 | 280 | -1% | 295 | 296 | 0% | | 17 | 296 | 295 | 0% | 272 | 274 | 1% | 307 | 310 | 1% | 348 | 345 | -1% | 290 | 289 | 0% | 305 | 305 | 0% |
|
Comparison table of Rayleigh wave velocity change before and after dynamic Compaction in 2# test site
|
|
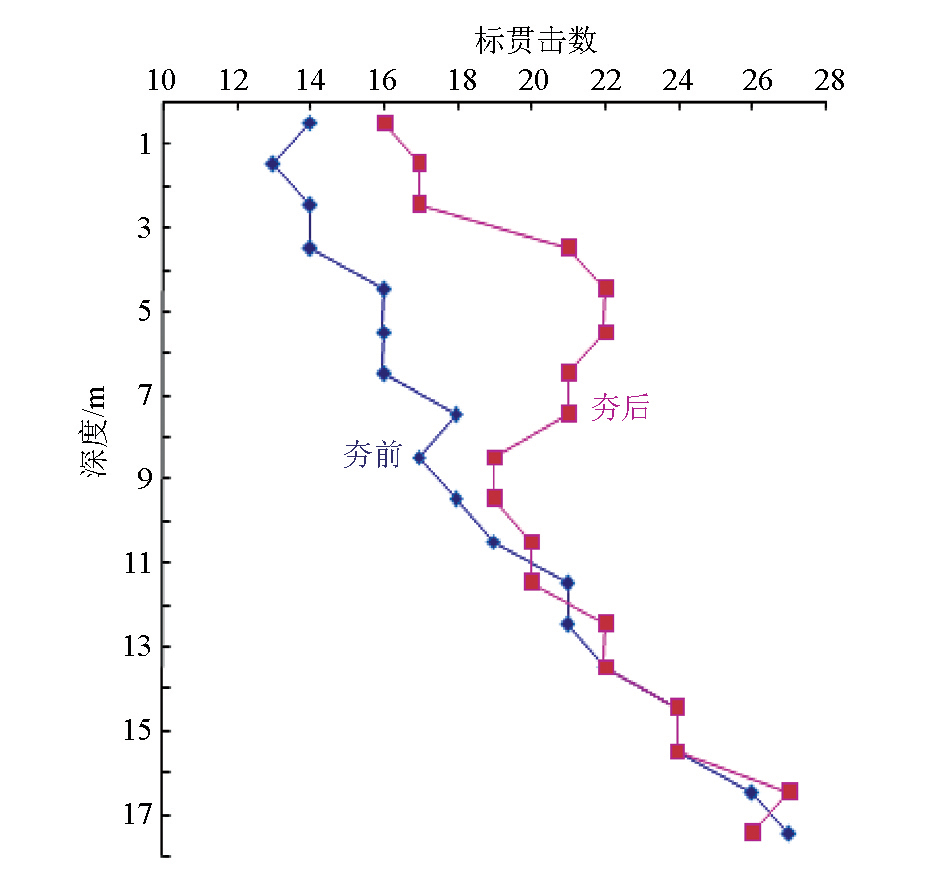
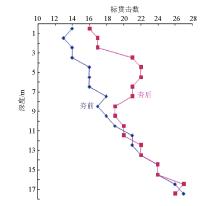
Contrast chart of standard penetration number before and after dynamic compaction at 1-1 test point of 1 # test site
|
|
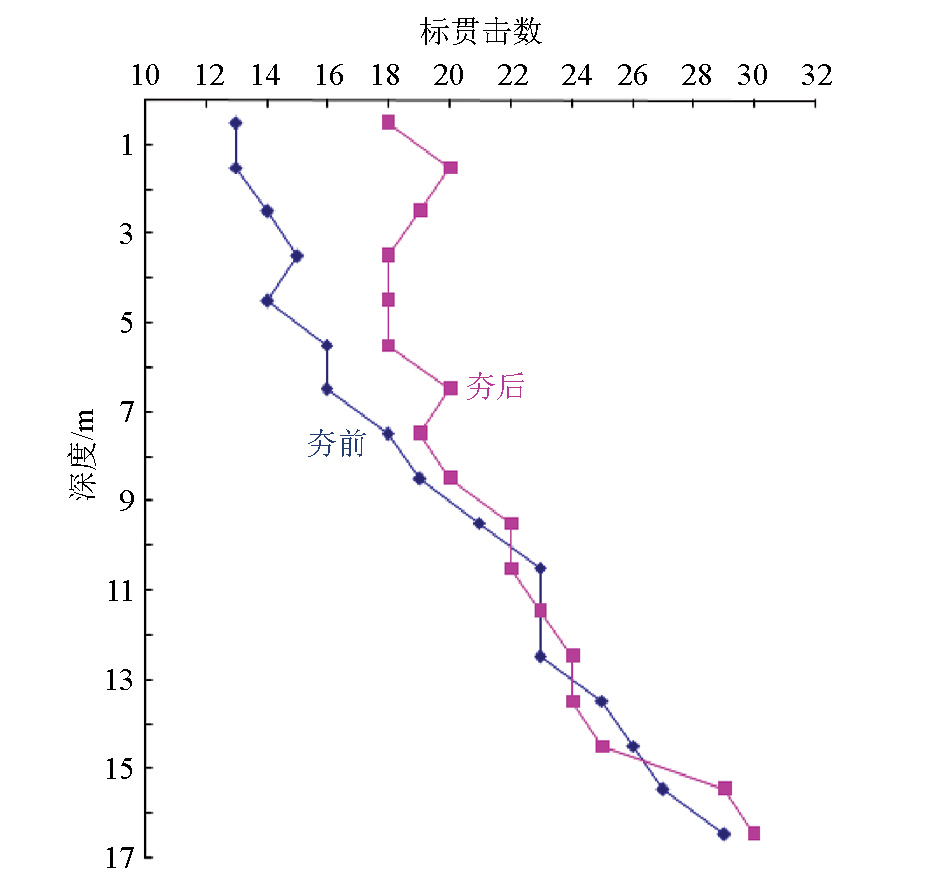
Contrast chart of standard penetration number before and after dynamic compaction at 2-4 test point of 2 # test site
|
深度
/m | 1-1检测点 | 1-2检测点 | 1-3检测点 | 1-4检测点 | 1-5检测点 | 1-6检测点 | | 夯前 | 夯后 | 增幅 | 夯前 | 夯后 | 增幅 | 夯前 | 夯后 | 增幅 | 夯前 | 夯后 | 增幅 | 夯前 | 夯后 | 增幅 | 夯前 | 夯后 | 增幅 | | 1 | 14 | 16 | 14% | 14 | 17 | 21% | 14 | 17 | 21% | 14 | 15 | 7% | 14 | 16 | 14% | 14 | 16 | 14% | | 2 | 13 | 17 | 31% | 13 | 17 | 31% | 14 | 19 | 36% | 13 | 16 | 23% | 14 | 17 | 21% | 13 | 16 | 23% | | 3 | 14 | 17 | 21% | 14 | 18 | 29% | 14 | 18 | 29% | 14 | 18 | 29% | 15 | 18 | 20% | 13 | 17 | 31% | | 4 | 14 | 21 | 50% | 15 | 21 | 40% | 13 | 17 | 31% | 15 | 18 | 20% | 15 | 19 | 27% | 15 | 18 | 20% | | 5 | 16 | 22 | 38% | 17 | 23 | 35% | 14 | 17 | 21% | 14 | 19 | 36% | 16 | 20 | 25% | 14 | 18 | 29% | | 6 | 16 | 22 | 38% | 16 | 24 | 50% | 15 | 17 | 13% | 16 | 21 | 31% | 16 | 21 | 31% | 16 | 19 | 19% | | 7 | 16 | 21 | 31% | 17 | 23 | 35% | 15 | 18 | 20% | 15 | 21 | 40% | 16 | 21 | 31% | 16 | 19 | 19% | | 8 | 18 | 21 | 17% | 19 | 23 | 21% | 15 | 18 | 20% | 18 | 21 | 17% | 18 | 22 | 22% | 17 | 19 | 12% | | 9 | 17 | 19 | 12% | 18 | 21 | 17% | 16 | 18 | 13% | 17 | 21 | 24% | 19 | 21 | 11% | 16 | 20 | 25% | | 10 | 18 | 19 | 6% | 19 | 21 | 11% | 17 | 18 | 6% | 18 | 20 | 11% | 20 | 21 | 5% | 18 | 19 | 6% | | 11 | 19 | 20 | 5% | 19 | 20 | 5% | 18 | 19 | 6% | 20 | 22 | 10% | 21 | 22 | 5% | 19 | 19 | 0% | | 12 | 21 | 20 | -5% | 20 | 19 | -5% | 20 | 20 | 0% | 20 | 20 | 0% | 23 | 22 | -4% | 20 | 20 | 0% | | 13 | 21 | 22 | 5% | 21 | 21 | 0% | 20 | 21 | 5% | 21 | 22 | 5% | 22 | 23 | 5% | 21 | 20 | -5% | | 14 | 22 | 22 | 0% | 22 | 21 | -5% | 21 | 22 | 5% | 23 | 22 | -4% | 23 | 23 | 0% | 20 | 21 | 5% | | 15 | 24 | 24 | 0% | 23 | 23 | 0% | 23 | 22 | -4% | 23 | 25 | 9% | 24 | 24 | 0% | 22 | 23 | 5% | | 16 | 24 | 24 | 0% | 24 | 24 | 0% | 22 | 23 | 5% | 24 | 25 | 4% | 24 | 25 | 4% | 23 | 23 | 0% | | 17 | 26 | 27 | 4% | 25 | 26 | 4% | 23 | 23 | 0% | 26 | 26 | 0% | 27 | 25 | -7% | 26 | 25 | -4% | | 18 | 27 | 26 | -4% | 25 | 28 | 12% | 23 | 24 | 4% | 27 | 26 | -4% | 28 | 27 | -4% | 25 | 26 | 4% |
|
1# test site dynamic consolidation before and after the standard penetration hit number change comparison table
|
深度
/m | 2-1检测点 | 2-2检测点 | 2-3检测点 | 2-4检测点 | 2-5检测点 | 2-6检测点 | | 夯前 | 夯后 | 增幅 | 夯前 | 夯后 | 增幅 | 夯前 | 夯后 | 增幅 | 夯前 | 夯后 | 增幅 | 夯前 | 夯后 | 增幅 | 夯前 | 夯后 | 增幅 | | 1 | 14 | 16 | 14% | 13 | 15 | 15% | 13 | 17 | 31% | 13 | 18 | 38% | 13 | 16 | 23% | 14 | 17 | 21% | | 2 | 14 | 16 | 14% | 14 | 17 | 21% | 13 | 16 | 23% | 13 | 20 | 54% | 14 | 17 | 21% | 13 | 17 | 31% | | 3 | 15 | 17 | 13% | 15 | 18 | 20% | 14 | 17 | 21% | 14 | 19 | 36% | 13 | 17 | 31% | 15 | 18 | 20% | | 4 | 16 | 18 | 13% | 15 | 20 | 33% | 14 | 18 | 29% | 15 | 18 | 20% | 14 | 18 | 29% | 14 | 18 | 29% | | 5 | 16 | 20 | 25% | 16 | 20 | 25% | 16 | 19 | 19% | 14 | 18 | 29% | 15 | 19 | 27% | 15 | 19 | 27% | | 6 | 16 | 20 | 25% | 18 | 21 | 17% | 16 | 19 | 19% | 16 | 18 | 13% | 16 | 20 | 25% | 16 | 20 | 25% | | 7 | 16 | 20 | 25% | 17 | 20 | 18% | 18 | 19 | 6% | 16 | 20 | 25% | 16 | 19 | 19% | 16 | 19 | 19% | | 8 | 18 | 21 | 17% | 18 | 19 | 6% | 18 | 20 | 11% | 18 | 19 | 6% | 16 | 18 | 13% | 16 | 19 | 19% | | 9 | 19 | 20 | 5% | 18 | 19 | 6% | 17 | 19 | 12% | 19 | 20 | 5% | 17 | 18 | 6% | 18 | 19 | 6% | | 10 | 20 | 20 | 0% | 19 | 18 | -5% | 18 | 19 | 6% | 21 | 22 | 5% | 17 | 18 | 6% | 18 | 18 | 0% | | 11 | 22 | 21 | -5% | 19 | 18 | -5% | 19 | 19 | 0% | 23 | 22 | -4% | 18 | 19 | 6% | 20 | 19 | -5% | | 12 | 22 | 22 | 0% | 18 | 19 | 6% | 21 | 20 | -5% | 23 | 23 | 0% | 19 | 19 | 0% | 20 | 20 | 0% | | 13 | 23 | 23 | 0% | 18 | 19 | 6% | 21 | 22 | 5% | 23 | 24 | 4% | 20 | 19 | -5% | 21 | 20 | -5% | | 14 | 23 | 22 | -4% | 19 | 19 | 0% | 22 | 23 | 5% | 25 | 24 | -4% | 21 | 21 | 0% | 21 | 23 | 10% | | 15 | 23 | 24 | 4% | 19 | 20 | 5% | 24 | 25 | 4% | 26 | 25 | -4% | 21 | 22 | 5% | 23 | 23 | 0% | | 16 | 24 | 24 | 0% | 20 | 21 | 5% | 26 | 25 | -4% | 27 | 29 | 7% | 22 | 23 | 5% | 24 | 24 | 0% | | 17 | 26 | 25 | -4% | 22 | 22 | 0% | 26 | 25 | -4% | 29 | 30 | 3% | 23 | 22 | -4% | 25 | 24 | -4% |
|
2# test site dynamic consolidation before and after the standard penetration hit number change comparison table
|

|
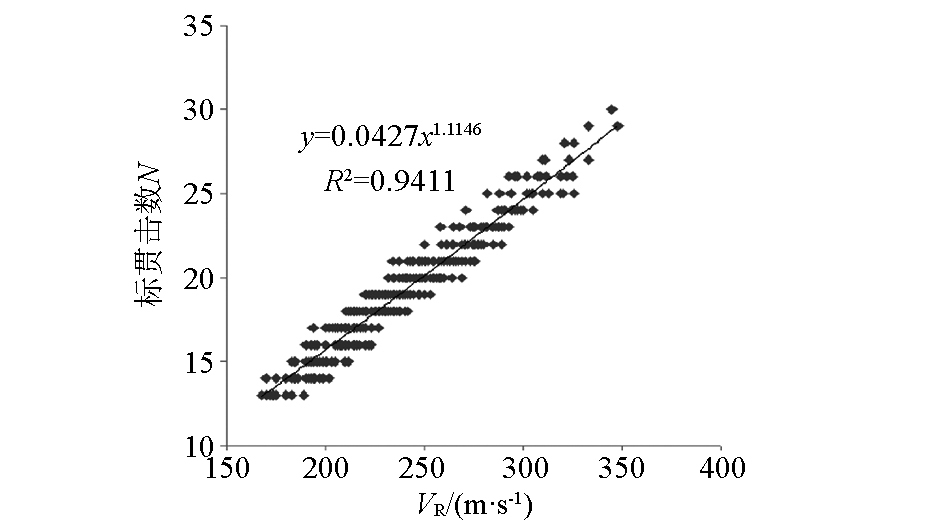
Relation curve between standard penetration number N and Rayleigh wave velocity VR in test site
|
深度
/m | 1-1检测点 | 1-2检测点 | 1-3检测点 | 1-4检测点 | 1-5检测点 | 1-6检测点 | | 夯前 | 夯后 | 增幅 | 夯前 | 夯后 | 增幅 | 夯前 | 夯后 | 增幅 | 夯前 | 夯后 | 增幅 | 夯前 | 夯后 | 增幅 | 夯前 | 夯后 | 增幅 | | 1 | 186 | 216 | 16% | 198 | 215 | 9% | 198 | 225 | 14% | 181 | 205 | 13% | 190 | 207 | 9% | 186 | 214 | 15% | | 2 | 185 | 221 | 19% | 188 | 221 | 18% | 209 | 243 | 16% | 186 | 209 | 12% | 199 | 208 | 5% | 182 | 211 | 16% | | 3 | 201 | 229 | 14% | 201 | 229 | 14% | 200 | 239 | 20% | 204 | 236 | 16% | 208 | 226 | 9% | 186 | 227 | 22% | | 4 | 211 | 269 | 27% | 212 | 265 | 25% | 204 | 226 | 11% | 213 | 241 | 13% | 226 | 242 | 7% | 206 | 230 | 12% | | 5 | 228 | 282 | 24% | 229 | 284 | 24% | 211 | 226 | 7% | 216 | 248 | 15% | 222 | 257 | 16% | 213 | 236 | 11% | | 6 | 235 | 284 | 21% | 234 | 289 | 24% | 213 | 230 | 8% | 225 | 262 | 16% | 221 | 265 | 20% | 222 | 242 | 9% | | 7 | 239 | 270 | 13% | 233 | 286 | 23% | 216 | 232 | 7% | 227 | 263 | 16% | 229 | 258 | 13% | 229 | 245 | 7% | | 8 | 246 | 266 | 8% | 246 | 276 | 12% | 220 | 231 | 5% | 232 | 261 | 13% | 249 | 266 | 7% | 232 | 248 | 7% | | 9 | 231 | 254 | 10% | 252 | 252 | 0% | 226 | 227 | 0% | 243 | 271 | 12% | 259 | 268 | 3% | 238 | 254 | 7% | | 10 | 246 | 251 | 2% | 256 | 255 | 0% | 236 | 232 | -2% | 256 | 277 | 8% | 269 | 270 | 0% | 250 | 257 | 3% | | 11 | 263 | 260 | -1% | 266 | 265 | 0% | 246 | 246 | 0% | 265 | 281 | 6% | 277 | 277 | 0% | 262 | 260 | -1% | | 12 | 278 | 274 | -1% | 271 | 271 | 0% | 257 | 258 | 0% | 271 | 273 | 1% | 286 | 286 | 0% | 270 | 266 | -1% | | 13 | 286 | 281 | -2% | 278 | 280 | 1% | 266 | 268 | 1% | 281 | 279 | -1% | 299 | 297 | -1% | 280 | 276 | -1% | | 14 | 299 | 296 | -1% | 296 | 297 | 0% | 276 | 276 | 0% | 291 | 289 | -1% | 305 | 308 | 1% | 286 | 282 | -1% | | 15 | 309 | 310 | 0% | 307 | 309 | 1% | 286 | 287 | 0% | 304 | 301 | -1% | 312 | 313 | 0% | 294 | 295 | 0% | | 16 | 318 | 317 | 0% | 314 | 315 | 0% | 296 | 298 | 1% | 314 | 310 | -1% | 316 | 325 | 3% | 302 | 304 | 1% | | 17 | 326 | 327 | 0% | 328 | 329 | 0% | 305 | 306 | 0% | 318 | 320 | 1% | 326 | 329 | 1% | 311 | 312 | 0% | | 18 | 343 | 344 | 0% | 345 | 346 | 0% | 315 | 310 | -2% | 344 | 343 | 0% | 339 | 340 | 0% | 323 | 323 | 0% |
|
Comparison table of Shear wave velocity change before and after dynamic compaction in 1# test site
|
深度
/m | 2-1检测点 | 2-2检测点 | 2-3检测点 | 2-4检测点 | 2-5检测点 | 2-6检测点 | | 夯前 | 夯后 | 增幅 | 夯前 | 夯后 | 增幅 | 夯前 | 夯后 | 增幅 | 夯前 | 夯后 | 增幅 | 夯前 | 夯后 | 增幅 | 夯前 | 夯后 | 增幅 | | 1 | 196 | 205 | 5% | 192 | 203 | 6% | 188 | 214 | 14% | 181 | 234 | 29% | 192 | 203 | 6% | 187 | 221 | 18% | | 2 | 201 | 207 | 3% | 188 | 220 | 17% | 184 | 208 | 13% | 181 | 256 | 41% | 206 | 221 | 7% | 186 | 219 | 18% | | 3 | 197 | 221 | 12% | 198 | 241 | 22% | 199 | 218 | 10% | 199 | 242 | 22% | 196 | 226 | 15% | 198 | 228 | 15% | | 4 | 206 | 241 | 17% | 211 | 256 | 21% | 206 | 231 | 12% | 206 | 235 | 14% | 206 | 228 | 11% | 206 | 232 | 13% | | 5 | 222 | 258 | 16% | 226 | 264 | 17% | 219 | 238 | 9% | 216 | 236 | 9% | 216 | 236 | 9% | 216 | 240 | 11% | | 6 | 223 | 261 | 17% | 230 | 266 | 16% | 220 | 241 | 10% | 230 | 229 | 0% | 225 | 250 | 11% | 226 | 251 | 11% | | 7 | 231 | 256 | 11% | 236 | 260 | 10% | 240 | 244 | 2% | 237 | 237 | 0% | 224 | 246 | 10% | 231 | 241 | 4% | | 8 | 246 | 266 | 8% | 244 | 246 | 1% | 246 | 247 | 0% | 246 | 246 | 0% | 227 | 236 | 4% | 230 | 237 | 3% | | 9 | 265 | 267 | 1% | 249 | 248 | 0% | 242 | 244 | 1% | 257 | 258 | 0% | 236 | 237 | 0% | 241 | 246 | 2% | | 10 | 276 | 274 | -1% | 251 | 249 | -1% | 254 | 255 | 0% | 290 | 295 | 2% | 240 | 241 | 0% | 253 | 258 | 2% | | 11 | 286 | 286 | 0% | 255 | 253 | -1% | 266 | 266 | 0% | 303 | 305 | 1% | 248 | 250 | 1% | 262 | 263 | 0% | | 12 | 297 | 295 | -1% | 249 | 250 | 0% | 276 | 276 | 0% | 306 | 308 | 1% | 262 | 262 | 0% | 272 | 272 | 0% | | 13 | 296 | 298 | 1% | 251 | 252 | 0% | 287 | 286 | 0% | 311 | 312 | 0% | 274 | 272 | -1% | 283 | 282 | 0% | | 14 | 303 | 305 | 1% | 256 | 256 | 0% | 296 | 299 | 1% | 322 | 321 | 0% | 282 | 281 | 0% | 292 | 293 | 0% | | 15 | 306 | 308 | 1% | 264 | 263 | 0% | 306 | 306 | 0% | 336 | 337 | 0% | 291 | 290 | 0% | 302 | 303 | 0% | | 16 | 311 | 312 | 0% | 276 | 275 | 0% | 315 | 316 | 0% | 351 | 351 | 0% | 301 | 300 | 0% | 312 | 313 | 0% | | 17 | 315 | 316 | 0% | 290 | 291 | 0% | 326 | 327 | 0% | 359 | 360 | 0% | 309 | 308 | 0% | 321 | 320 | 0% |
|
Comparison table of Shear wave velocity change before and after dynamic compaction in 2# test site
|
|
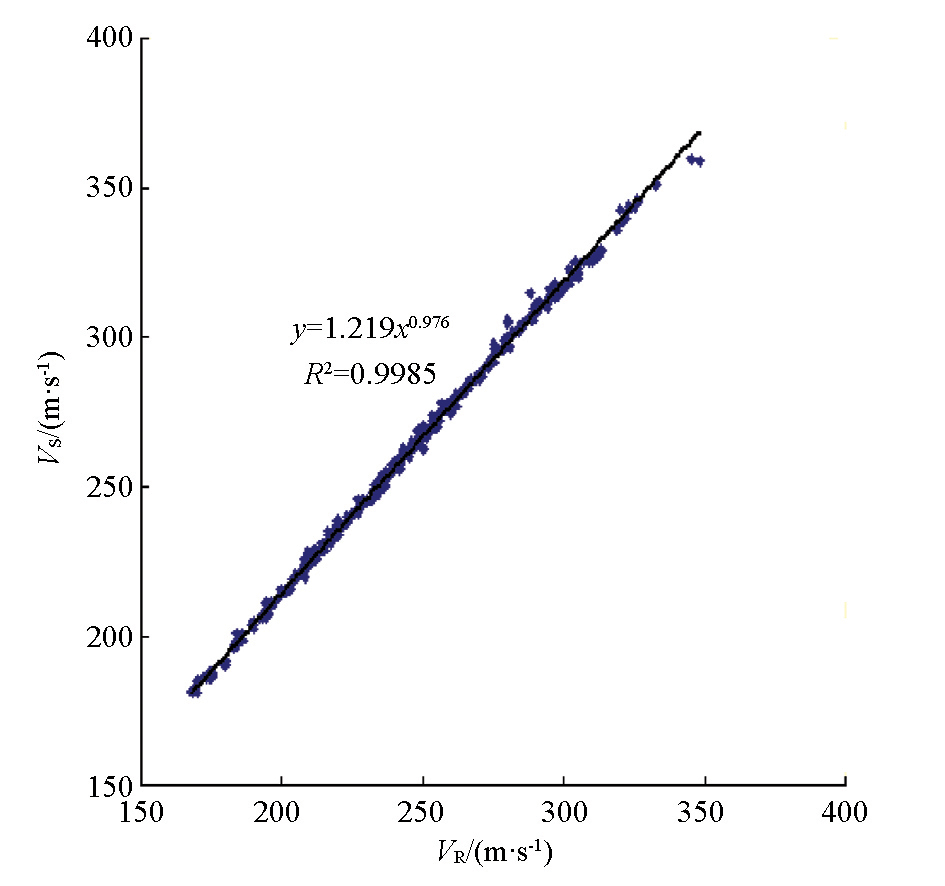
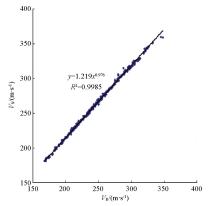
Relation curve between Shear wave velocity and Rayleigh wave velocity in test site
|
|
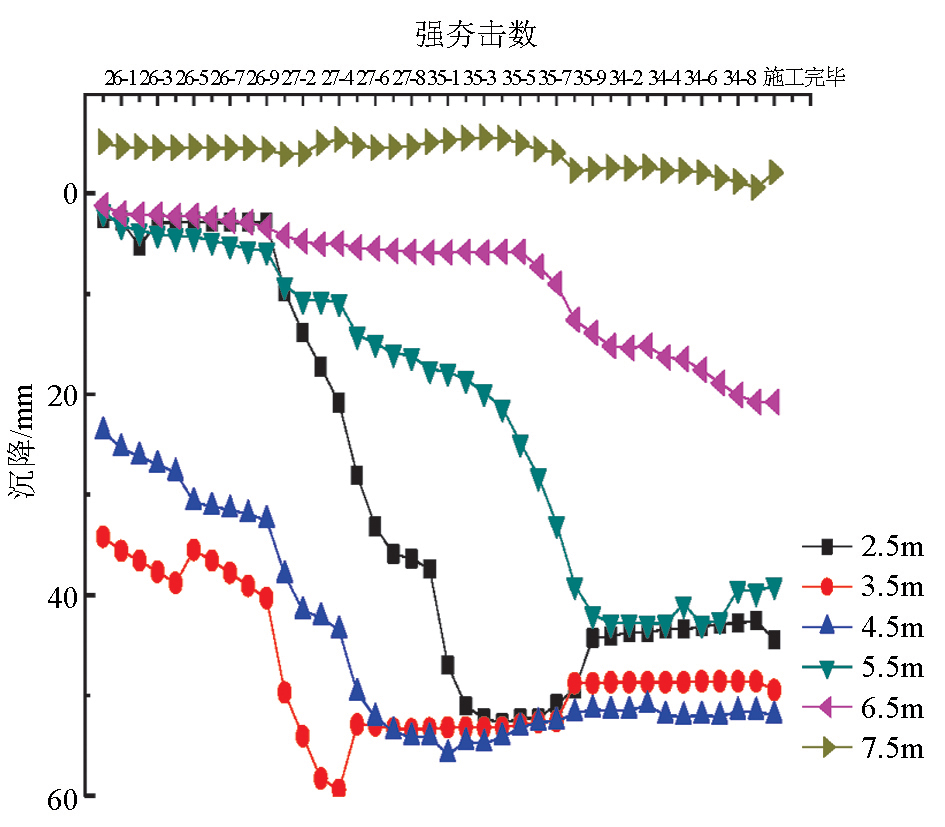
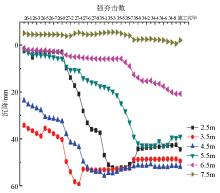
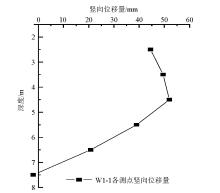
Multi-point displacement curve of 1# site W1-1 measuring point
|
|
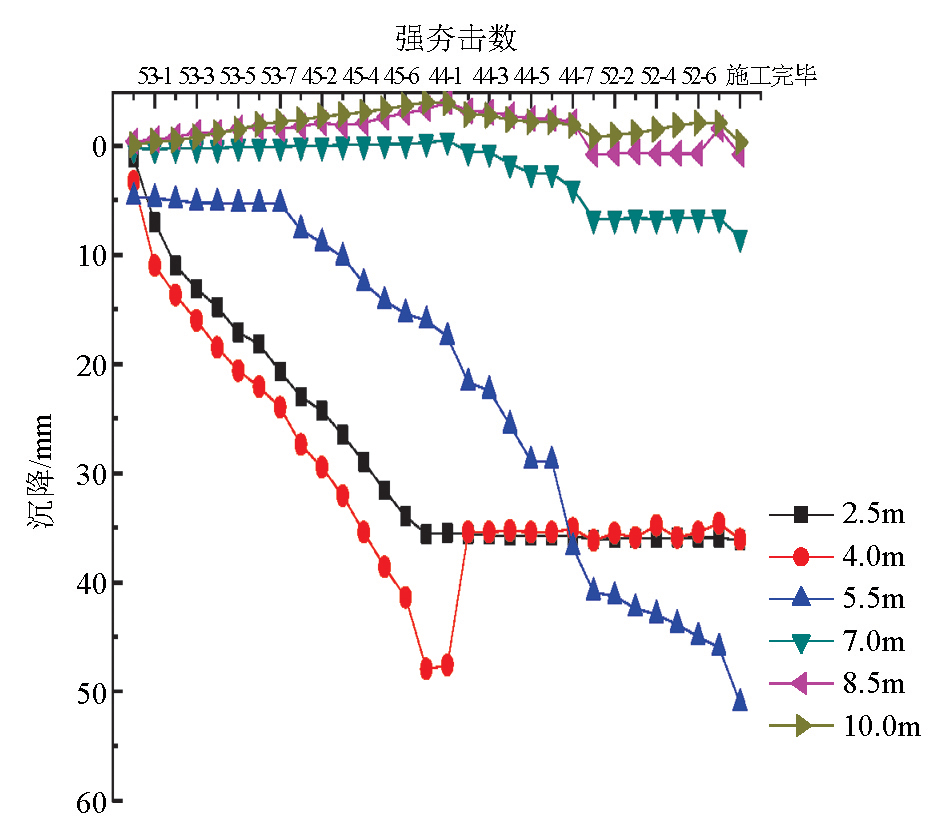
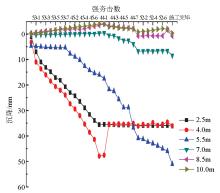
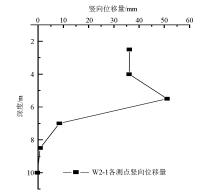
Multi-point displacement curve of 2# site W2-1 measuring points
|
|
Final vertical displacement of each measuring point of 1# site W1-1 point
|
|
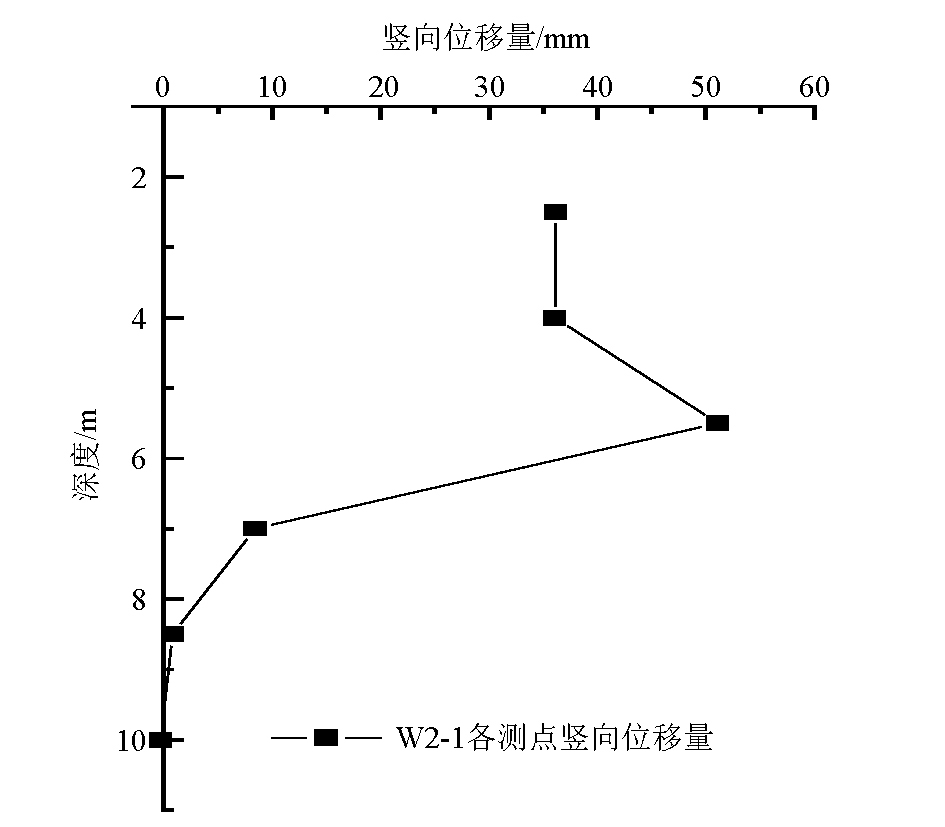
Final vertical displacement of each measuring point of 2# site W2-1 point
|
| [1] |
陈希哲. 土力学地基基础[M]. 北京: 清华大学出版社, 1998: 396-401.
|
| [1] |
Chen X Z. Soil mechanics and geotechnical engineering[M]. Beijing: Tsinghua University Press, 1998: 396-401.
|
| [2] |
王铁宏, 李明琛, 何颐华, 等. 强夯法处理砾质粘土回填地基的承载力检测方法[[J]. 建筑科学, 1995(3):43-45.
|
| [2] |
Wang T H, Li M C, He Y H, et al. Dynamic compaction method for testing the bearing capacity of gravel clay backfill foundation[J]. Building Science, 1995(3):43-45.
|
| [3] |
熊建华. 强夯法在某机场地基处理中的试验研究[J]. 大坝观测与土工测试, 1999,23(3):7-9.
|
| [3] |
Xiong J H. Experimental study on dynamic foundation consolidation at an airport[J]. Dam Observation and Geotechnical Testing, 1999,23(3):7-9.
|
| [4] |
吴世明, 唐有职, 陈龙珠. 岩土工程波动勘测技术[M]. 北京: 水利电力出版社, 1992: 88-117.
|
| [4] |
Wu S M, Tang Y Z, Chen L Z. Wave investigation technique in geotechnical engineering[M]. Beijing: Water Resources and Electric Power Press, 1992: 88-117.
|
| [5] |
Stokoe K H, Nazarian S. Effectiveness of ground improvement from spectral analysis of surface waves[C]// Proceeding of the eighth European conference on soil mechanics and foundation engineering, Helsinki, Finland.Netherlauds: AA Balkema Publishers, 1983: 91-95.
|
| [6] |
王振东. 面波勘探技术的新进展[G]//工程物探论文集. 云南: 云南科技出版社, 2006: 1-7.
|
| [6] |
Wang Z D. New advances in surface wave exploration technology[G]//Proceedings of Engineering Geophysical Exploration. Yunnan: Yunnan Science and Technology Press, 2006: 1-7.
|
| [7] |
夏唐代, 蔡袁强, 吴世明, 等. 各向异性成层地基中Rayleigh波的弥散特性[J]. 振动工程学报, 1996,9(2):191-195.
|
| [7] |
Xia T D, Cai Y Q, Wu S M, et al. Dispersion characteristics of Rayleigh wave in anisotropic layered soils[J]. Journal of Vibration Engineering, 1996,9(2):191-195.
|
| [8] |
赵明. 瑞利波法在工程勘察中的应用[J]. 勘察科学技术, 1996(5):54-57.
|
| [8] |
Zhao M. The application of Rayleigh wave method in engineering investigation[J]. Site Ivestigation Science and Technology, 1996(5):54-57.
|
| [9] |
李哲生. 瞬态多道瑞利波勘探技术在岩土工程勘察中的应用[J]. 工程勘察, 1996(3):66-68.
|
| [9] |
Li Z S. Application of transient multichannel Rayleigh wave exploration technique in geotechnical engineering investigation[J]. Engineering Investigation, 1996(3):66-68.
|
| [10] |
孙进忠, 祁生文, 郭铁栓, 等. 漳州后石电厂工程地基强夯效果的瞬态面波检测[G]//建筑工程检测论文集. 北京: 冶金工业出版社, 1999: 153-161.
|
| [10] |
Sun J Z, Qi S W, Guo T S, et al. Transient surface wave detection of dynamic compaction effect of foundation in Zhangzhou houshi power plant project[G]//Proceedings of Construction Engineering Inspection. Beijing: Metallurgical Industry Press, 1999: 153-161.
|
| [11] |
吴福良, 耿光旭, 仲伟周. 瑞雷波在地基强夯检测中的应用[J]. 西安交通大学学报, 2003,37(4):169-173.
|
| [11] |
Wu F L, Geng G X, Zhong W Z. Rayleigh wave and its application to testing dynamic compacted ground[J]. Journal of Xi'an Jiaotong University, 2003,37(4):169-173.
|
| [12] |
彭振斌, 王继华, 陈安, 等. 地基强夯效果的综合评价[J]. 无损检测, 2005,27(6):324-326.
|
| [12] |
Peng Z B, Wang J H, Chen A, et al. Comprehensive evaluation of the effect of foundation dynamic consolidation[J]. NDT, 2005,27(6):324-326.
|
| [13] |
陆新, 朱松林. 强夯处理地基的检测技术研究[J]. 施工技术, 2005,34(5):43-45.
|
| [13] |
Lu X, Zhu S L. Study of detection technologies of strong punning treated ground[J]. Construction Technology, 2005,34(5):43-45.
|
| [14] |
林朝旭. 多道瞬态瑞雷波法在强夯地基检测中的应用探讨[J]. 福建建筑, 2007,113(11):43-45.
|
| [14] |
Lin C X. The application and discuss of Rayleigh wave in foundation improvement adopted by heavy ramming[J]. Fujian Architecure & Construction, 2007,113(11):43-45.
|
| [15] |
杨成林. 瑞雷波勘探[M]. 北京: 地质出版社, 1993: 129-139.
|
| [15] |
Yang C L. Rayleigh wave exploration[M]. Beijing: The Geological Publishing House, 1993: 129-139.
|
| [16] |
栾明龙, 魏红, 林万顺. 瞬态瑞利波技术在工程勘察中的应用[J]. 物探与化探, 2012,36(5):878-882.

|
| [16] |
Luan M L, Wei H, Lin W S. The application of transient Rayleigh wave exploration to geotechnical investigation[J]. Geophysical and Geochemical Exploration, 2012,36(5):878-882.
|
| [1] |
SUN Si-Yuan, YU Xue-Zhong, XIE Ru-Kuan, HE Yi-Yuan, SHAN Xi-Peng, LI Shi-Jun. Capabilities of airborne electromagnetic methods to detect permafrost[J]. Geophysical and Geochemical Exploration, 2022, 46(1): 104-113. |
| [2] |
WU Yan-Min, PENG Zheng-Hui, YUAN Yong-Hu, ZHU Jin-Xiang, LIU Chuang, GE Wei, LING Guo-Ping. An EMI array sensor based on differential reception[J]. Geophysical and Geochemical Exploration, 2022, 46(1): 214-220. |
|
|
|
|