

0 引言
1 材料与方法
1.1 研究区概况及样品采集
研究区位于广西壮族自治区西南部(东经106°34'59~107°37'11,北纬22°10'04~22°58'02),毗邻越南,涵盖崇左市江州区、大新县、龙州县3县区,为主要粮食作物产区。地层包括泥盆系、石炭系、侏罗系、三叠系、第四系及侵入岩。成土母质以碳酸盐岩为主,非碳酸盐岩区面积较小。地貌多溶蚀小平原和圆洼地、槽谷地,丘陵起伏,山多地少,为典型的喀斯特岩溶地貌区。全年光照充足,夏长冬短,雨量充沛,干湿季节分明,具有明显的南亚热带季风气候特点。
根据研究区农业生产发展现状,于2020年前后在水稻成熟期间连片耕地区,选择代表性地块均匀布设样点。以0.1~0.2 hm2为采样单元,以对角线法选择5个采样点,每个采样点采集3~4株稻穗混合成样,并采集相应根系土,根系土采集深度0~20 cm。共采集242件水稻及其根系土,每件水稻样品重约500 g,根系土样品重约1 kg,采用四分法缩分处理。样品采集点位见图1。
图1
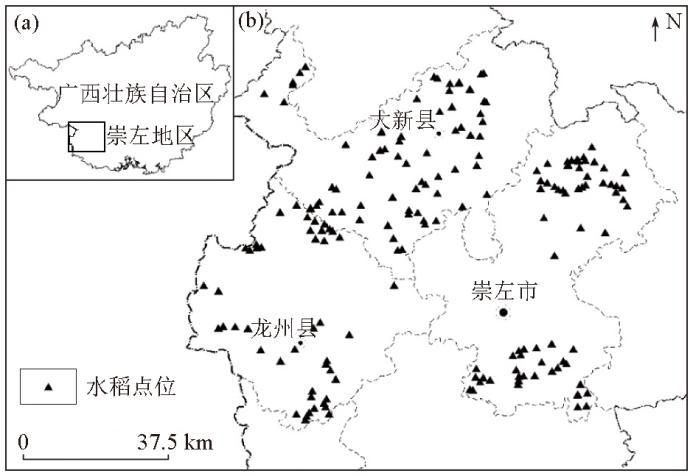
图1
研究区位置示意(a)及采样点位分布(b)
Fig.1
The location of the study area (a) and the distribution of sampling points (b)
1.2 样品制备及分析
1.2.1 样品制备
土壤样采集后装布袋运回实验室,在室内自然风干,过20目尼龙筛后取部分样直接用于pH值分析,剩余样品在小于60 ℃恒温干燥箱内充分烘干。样品烘干混匀后,除去非土壤杂质,采用玛瑙球磨机将样品研磨至0.074 mm用于元素化学分析。
水稻籽实采集后用尼龙网袋包装,带回实验室自然风干后去除杂质。先用自来水及纯水冲洗干净后,低温烘干,经精米机脱壳后制成精米。用去离子水清洗,于55 ℃烘箱中烘干,取不超过200 g样品粉碎至20目,装入塑料瓶中待分析。
1.2.2 样品测试
样品测试工作由广西壮族自治区地质矿产测试研究中心承担。土壤测定采用常规分析方法[16]。测定Cd、Ni、Mo、Se的土样经HF+HNO3+HClO4分解,测定B、Ge、I的土样经氧化钠熔融处理后,采用电感耦合等离子体质谱法(ICP-MS)测定。经HF+HNO3+HClO4分解后的土样,采用电感耦合等离子体发射光谱法(ICP-OES)测定Cu、Mn、CaO、MgO、Na2O。土样经压饼法成型后,采用X射线荧光光谱法测定Cr、P、Pb、Zn、Al2O3、Fe2O3、SiO2、K2O、S、Ti。样品经王水消解,分别用硫脲—抗坏血酸、氯化亚锡作为As、Hg的还原剂,采用原子荧光光谱法(AFS)测定As、Hg。样品经硫酸、硫酸钾和硫酸铜消解,用凯氏定氮仪经蒸馏和滴定测得N。采用重铬酸钾氧化法(Walkley-Black)测定Corg。根据玻璃电极和参比电极测量溶液的电势差测定pH值。水稻籽实样品消解后,采用原子荧光光谱法(AFS)测定As、Hg,电感耦合等离子体质谱法(ICP-MS)测定Cd,X射线荧光光谱法测定Pb。土壤和农作物样品分析测试准确度和精密度合格率均为100%,数据质量可靠。
1.3 统计分析及检验
使用Excel 2019进行前期数据处理,SPSS 23.0软件统计水稻及根系土元素参数,开展正态分布检验、相关性检验;使用JMP Pro 18及astata/MP 17.0研究建立拟合模型,通过Origin 2025及MapGIS 6.7绘制图件。
2 分析及讨论
2.1 特征分析
2.1.1 土壤元素含量特征
表1 崇左地区土壤元素含量统计(N=242)
Table 1
| 参数 | As | Cd | Cr | Cu | Hg | Ni | Pb | Zn | Mn | N | P | S | Mo |
|---|---|---|---|---|---|---|---|---|---|---|---|---|---|
| 最大值 | 76.00 | 4.522 | 506.0 | 85.10 | 0.774 | 109.00 | 155.0 | 384.0 | 2742.0 | 5531 | 2768 | 1166.0 | 4.60 |
| 最小值 | 1.93 | 0.086 | 25.4 | 8.51 | 0.065 | 5.92 | 10.1 | 22.7 | 63.4 | 1016 | 332 | 178.0 | 0.21 |
| 平均值 | 17.70 | 0.780 | 108.0 | 31.00 | 0.270 | 39.95 | 43.4 | 130.0 | 331.5 | 2700 | 901 | 478.5 | 0.99 |
| 全国平均值 | 10.3 | 0.205 | 66 | 25 | 0.076 | 27 | 30 | 71 | 580 | 1172 | 707 | 353 | 0.86 |
| 元素 | B | Ge | Se | I | Al2O3 | CaO | Fe2O3 | K2O | MgO | Na2O | SiO2 | Corg | pH |
| 最大值 | 154.0 | 2.48 | 1.32 | 4.72 | 21.88 | 24.29 | 18.4 | 2.87 | 1.65 | 0.28 | 82.9 | 5.3 | 8.27 |
| 最小值 | 16.6 | 0.73 | 0.24 | 0.46 | 4.60 | 0.15 | 1.86 | 0.16 | 0.14 | 0.03 | 17.07 | 0.52 | 4.85 |
| 平均值 | 60.0 | 1.47 | 0.61 | 1.63 | 13.725 | 0.82 | 5.74 | 1.00 | 0.58 | 0.07 | 64.26 | 2.49 | 7.17 |
| 全国平均值 | 51 | 1.4 | 0.26 | 2.4 | 13.14 | 2.85 | 4.49 | 2.36 | 1.48 | 1.28 | 64.96 |
注:pH值无量纲,Al2O3、CaO、Fe2O3、K2O、MgO、Na2O、SiO2、Corg含量单位为%,其余为10-6。
参照《土壤环境质量农用地土壤污染风险管控标准》(CB 15618—2018),土壤As、Cd污染风险等级较高,约有62.4%的土壤样品Cd含量高于土壤风险筛选值,且有16.9%的样品Cd含量高于土壤风险管控值;As含量高于土壤风险筛选值的样品占比为33.5%;Cr、Cu、Hg、Ni、Pb、Zn污染风险等级低,绝大部分样品低于土壤风险筛选值。
2.1.2 水稻重金属含量特征
水稻籽实中As含量范围为(0.034~0.260)×10-6,Cd含量范围为(0.005~0.360)×10-6,Hg含量范围为(0.000 9~0.030 0)×10-6,Pb含量范围为(0.036~0.090)×10-6,其均值分别为0.120×10⁻⁶、0.018×10⁻⁶、0.034 5×10⁻⁶、0.057×10⁻⁶(表2)。参照《食品安全国家标准 食品中污染物限量》(GB 2762—2022),水稻籽实As、Cd、Hg超标比例分别为0.8%、3.3%、2.5%,无Pb含量超标水稻。
表2 水稻籽实重金属元素含量统计(N=242)
Table 2
| 参数 | As | Cd | Hg | Pb |
|---|---|---|---|---|
| 最小值 | 0.034 | 0.005 | 0.0009 | 0.036 |
| 最大值 | 0.260 | 0.360 | 0.0300 | 0.090 |
| 均值 | 0.120 | 0.018 | 0.0345 | 0.057 |
针对不同水稻品种、水稻种植区成土母质分别开展非参数检验。曼—惠特尼检验(Mann-Whitney U test)结果表明,早、晚稻籽实中Cd、Pb含量总体差异较小,As、Hg含量总体分布则存在显著差异,早、晚稻As含量均值分别为0.12×10⁻⁶、0.082×10⁻⁶,Hg含量均值分别为0.003 2×10⁻⁶、0.041 5×10⁻⁶。克鲁斯卡尔—沃利斯检验(Kruskal-Wallis test)结果表明,不同成土母质背景的水稻重金属含量均存在显著差异。非碳酸盐岩区水稻重金属含量普遍较高,As、Cd、Hg、Pb均值分别为0.135×10⁻⁶、0.054 ×10⁻⁶、0.006×10⁻⁶、0.064×10⁻⁶;碳酸盐岩区水稻重金属含量均值分别为0.104×10⁻⁶、0.043×10⁻⁶、0.004 ×10⁻⁶、0.051×10⁻⁶。
植物富集系数(bioconcentration factor, BCF)是衡量植物从土壤中吸收和积累重金属能力的重要指标,反映了土壤—植物体系中重金属迁移的难易程度,计算公式如下:
式中:Cp为水稻籽实重金属含量(10-6);Cs为根系土中该重金属含量(10-6)。
图2
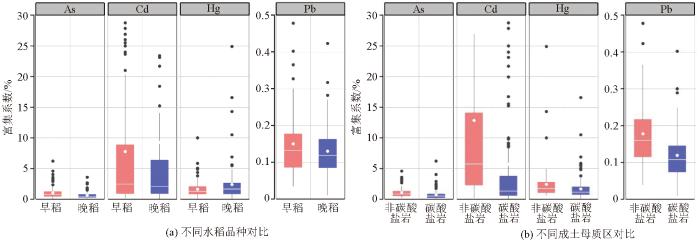
图2
水稻籽实重金属富集系数对比
Fig.2
Histogram of heavy metal accumulation capacity in rice grains
2.2 重金属迁移影响因素
水稻籽实与根系土元素间的相关性见图3。在P<0.01的置信条件下,水稻籽实中As含量与根系土中Mo、Ge、SiO2存在显著正相关,与Cr、Pb、Mn、N、P、S、Mo、Se、I、Al2O3、CaO、Fe2O3、Corg、pH值存在显著负相关;Cd含量与根系土中K2O、SiO2存在显著正相关,与I、CaO、Fe2O3、pH值存在显著负相关;Hg含量与根系土中Cu、SiO2存在显著正相关,与N、S、Corg存在显著负相关;Pb含量与根系土中SiO2存在显著正相关,与Cr、Hg、Ni、Mn、N、P、S、B、I、Al2O3、CaO、MgO、Corg、pH值存在显著负相关。
图3
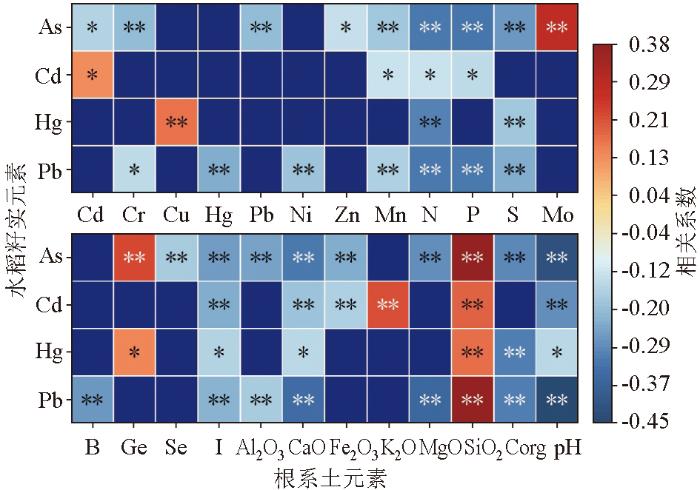
图3
水稻与根系土元素相关热图(N=242)
注:“*”表示在 0.05 级别相关性显著;“**”表示在 0.01 级别相关性显著
Fig.3
Correlation coefficients between rice grain and root soil element contents (N=242)
Note:“*”and “**” indicate that the regression model is significant at 0.05 and 0.01 levels, respectively.
2.3 预测模型分析
本研究选择最小二乘法对水稻重金属元素进行线性拟合,依据元素空间分布特点,多元线性拟合模型类型分为三角函数模型、球面模型、高斯模型、指数模型、K-Bessel、J-Bessel、孔洞效应等[29-
表3 早、晚稻籽实重金属元素拟合模型参数
Table 3
| 因子 | 早稻籽实 | 晚稻籽实 | ||||||
|---|---|---|---|---|---|---|---|---|
| As | Cd | Hg | Pb | As | Cd | Hg | Pb | |
| 决定系数 | 0.52* | 0.19** | 0.21* | 0.23** | 0.57** | 0.31* | 0.6** | 0.47* |
| 常数 | -1.49 | 4.92 | 0.11 | -0.34 | -1.43 | 2.14 | 2.30 | -0.49 |
| As | 0.24** | - | - | - | 0.40** | - | - | 0.16** |
| Cd | - | 0.38** | - | - | -0.17** | 0.42* | - | 0.07** |
| Cr | 0.17** | -0.62** | - | - | - | - | -0.12** | |
| Cu | - | -0.52** | - | - | - | - | - | |
| Hg | - | - | -0.26* | - | 0.45* | 0.47** | -0.09* | |
| Ni | - | - | 0.35** | - | 0.13** | - | 0.31** | - |
| Zn | -0.12** | - | 0.19* | 0.13** | - | -0.54* | - | - |
| Mn | - | -0.32** | - | - | - | - | -0.26** | - |
| P | 0.2** | - | - | - | - | - | 0.4** | -0.16** |
| S | 0.17* | -0.88* | -0.23** | - | - | -0.81** | -0.21** | |
| Mo | - | 0.65** | 0.25** | - | - | - | - | |
| B | -0.09* | 0.36* | - | - | 0.61** | - | ||
| Ge | - | - | - | -0.38** | 0.35** | -1.85** | - | -0.3** |
| Se | -0.21** | - | - | 0.17** | - | - | - | - |
| I | - | - | -0.2* | - | - | - | - | - |
| Al2O3 | - | - | - | - | - | - | - | 0.33** |
| CaO | -0.05** | - | - | -0.07** | - | -0.49** | - | - |
| Fe2O3 | -0.38** | - | - | - | -0.58** | - | - | - |
| K2O | 0.1** | 0.37** | -0.34** | 0.14** | - | - | - | - |
| MgO | - | - | - | - | -0.2** | - | - | -0.1** |
| Na2O | - | - | - | - | - | - | - | -0.09* |
| SiO2 | - | - | - | -0.27** | - | - | - | - |
| Corg | -0.13* | 1** | - | - | - | - | -0.6** | 0.16* |
| pH | -0.42** | - | - | - | - | - | - | -0.26* |
注:“*”表示在0.05级别相关性显著;“**”表示在0.01级别相关性显著。
表4 岩溶区与非岩溶区水稻籽实重金属元素拟合模型参数
Table 4
| 因子 | 岩溶区水稻籽实 | 非岩溶区水稻籽实 | ||||||
|---|---|---|---|---|---|---|---|---|
| As | Cd | Hg | Pb | As | Cd | Hg | Pb | |
| 决定系数 | 0.41** | 0.46** | 0.51* | 0.34** | 0.57** | 0.41* | 0.74** | 0.52* |
| 常数 | 4.13 | 7.54 | -0.16 | -0.44 | -4.41** | 2.97 | 1.65 | -2.39 |
| As | 0.2** | - | - | - | 0.22** | - | 0.25** | - |
| Cd | - | 0.67** | - | 0.06** | - | 0.9** | - | - |
| Cr | - | - | - | - | - | - | -0.38** | - |
| Cu | -0.41** | - | 0.28** | - | 0.31** | - | 0.68** | -0.21** |
| Hg | - | - | 0.26** | -0.14** | -0.17** | 0.88** | - | -0.24** |
| Ni | 0.39** | - | - | - | - | -0.97** | - | 0.49** |
| Pb | - | - | - | - | -0.35** | - | - | 0.25** |
| Zn | -0.23** | - | - | - | - | -1.06* | - | -0.33** |
| Mn | - | - | -0.2** | - | - | - | - | -0.09** |
| N | -1.08** | - | - | - | 0.24** | - | - | 0.22* |
| P | -0.21** | - | 0.39** | -0.16** | 0.26** | - | 0.72** | 0.21** |
| S | - | -1.16** | -0.39** | - | - | - | -1.4** | -0.17* |
| B | - | - | - | - | - | 1.61** | - | -0.18** |
| Ge | 0.38** | - | - | - | - | -1.8** | - | -0.19** |
| Se | - | 0.79** | - | 0.16** | - | - | - | - |
| Al2O3 | -0.71** | 0.93** | 0.32* | - | - | - | 0.59** | - |
| CaO | - | -0.43** | 0.12** | - | - | - | - | -0.15** |
| Fe2O3 | - | -1.07** | - | 0.11** | - | 1.04** | -0.93** | |
| K2O | - | - | - | -0.08** | 0.18** | - | - | - |
| MgO | - | - | - | - | -0.23** | - | - | - |
| Na2O | 0.24** | -0.55** | - | - | - | - | - | - |
| SiO2 | - | -1.07** | 0.49** | -0.08** | 0.9** | 1.52* | - | - |
| Corg | 1.12** | - | -0.84** | 0.05** | - | - | - | - |
| pH | - | -2.04** | - | - | - | -3.86** | - | 0.68** |
注:“*”表示在0.05级别相关性显著;“**”表示在0.01级别相关性显著。
对水稻籽实中As、Cd、Hg、Pb含量的拟合分析发现,As模型拟合精度相对较高。具体而言,水稻籽实中As、Cd、Hg、Pb的总体拟合模型决定系数分别为0.5、0.42、0.25和0.39。进一步根据水稻品种及成土母质进行分类分析,岩溶区和非岩溶区水稻中As的拟合模型决定系数分别为0.41和0.57,早稻和晚稻中As的拟合模型决定系数分别为0.54和0.57;而对应的Pb的拟合模型决定系数仅分别为0.34、0.52、0.23和0.47。这表明水稻籽实中As含量的变化规律性更为明显,其模型拟合效果也相对更好。相比之下,其他重金属元素在迁移和积累过程中受到更多其他外在因素的影响,这些因素使得它们的迁移和积累过程的解释更为复杂,从而导致模型拟合难度增加[32]。
岩溶区及非岩溶区水稻籽实中As、Cd、Hg、Pb含量预测对数值与实测对数值对比如图4所示。所有模型的均方根误差(RMSE)均小于36%,表明模型能够较好地捕捉数据的变化趋势和规律。4种元素中,模型预测精度最高的是Pb,其岩溶区和非岩溶区的RMSE值分别为0.073和0.051;其次是As和Cd,二者的RMSE值均在0.16以下;而Hg的RMSE值相对较高,约为0.35。不同水稻品种模型预测结果与之同样相似,RMSE值与相应的籽实元素含量对比,均处于合适的区间范围内。因此,本次模型研究对各元素的预测具有较高的可靠性。
图4
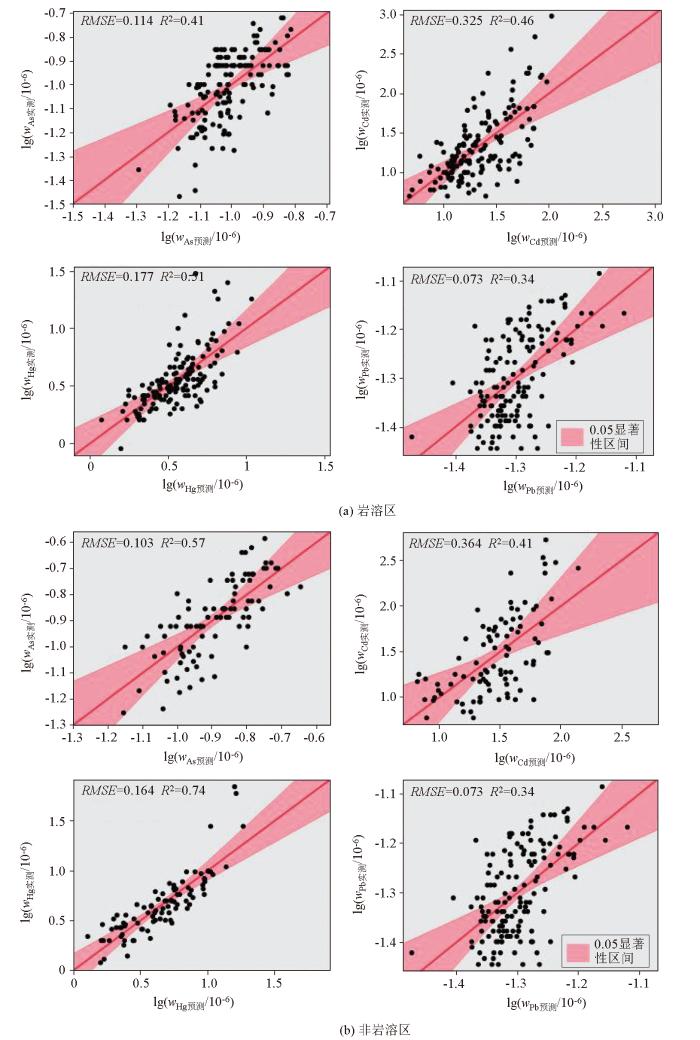
图4
基于最佳迁移模型的不同成土母质区水稻重金属预测对数值与实测对数值对比
Fig.4
Comparison of prediction logarithm value and measured logarithm values of heavy metals in rice based on the best transfer model in different lithogenic zones
模型的高解释力可用于预测水稻As含量,结合岩溶、非岩溶分区可进一步提高精度,并推广至类似喀斯特地区;Cd、Hg当前模型解释力较低,今后研究中可引入更多变量(如土壤微生物)提升预测能力。
3 结论
与全国平均水平相比,崇左地区土壤中氧化物含量普遍较低,而重金属元素含量相对较高,尤其是Cd和Hg。区域内土壤As、Cd污染风险等级较高。早稻和晚稻籽实中Cd、Pb含量差异较小,而As、Hg含量差异较大。此外,岩溶区与非岩溶区之间水稻籽实的As、Cd、Hg、Pb含量也存在显著差异:非碳酸盐岩区水稻籽实中As、Cd、Hg、Pb的含量均值是碳酸盐岩区的1.25~1.48倍。尽管如此,崇左地区水稻籽实中As、Cd、Hg、Pb含量总体上仍符合食品安全标准。
崇左地区水稻籽实中As、Pb含量与根系土壤中金属、非金属元素及氧化物均表现出明显的相关性,以负相关为主;而Cd、Hg则主要与根系土壤中氧化物表现出显著的相关性特征。
多元线性拟合结果表明,水稻籽实中As的不同类型拟合模型决定系数普遍高于0.5,表明模型具有较好的解释能力,总体优于Cd、Hg和Pb。当将水稻籽实按岩溶区与非岩溶区加以区分后,拟合模型的决定系数进一步提高,其中非岩溶区水稻Hg的拟合模型决定系数可达0.74,表现最为明显。相比之下,水稻品种对水稻籽实中重金属含量的影响力相对较弱。例如,早稻籽实中Cd、Hg、Pb以及晚稻籽实中Cd、Pb的模型拟合性普遍较差。这说明在影响水稻籽实中As、Cd、Hg、Pb含量的因素中,成土母质的作用更为显著,其影响力大于水稻品种。
本研究初步揭示了喀斯特区土壤—水稻系统重金属迁移的主控因素,为环境地球化学与农产品安全研究提供新视角,也为崇左及类似地区差异化修复和模型化监管提供科学依据。
参考文献
淮河流域安徽段土壤重金属元素分布特征研究
[J].
Distribution characteristics of heavy metals in soils of the Anhui section of the Huaihe River Basin
[J].
Distribution,availability,and sources of trace metals in different particle size fractions of urban soils in Hong Kong:Implications for assessing the risk to human health
[J].DOI:10.1016/j.envpol.2011.01.013 URL
Assessment of heavy metal pollution and human health risk in urban soils of steel industrial city (Anshan),Liaoning,Northeast China
[J].
DOI:10.1016/j.ecoenv.2015.06.019
PMID:26114257
[本文引用: 1]

The purpose of this study was to determine the concentrations and health risk of heavy metals in urban soils from a steel industrial district in China. A total of 115 topsoil samples from Anshan city, Liaoning, Northeast China were collected and analyzed for Cr, Cd, Pb, Zn, Cu, and Ni. The geoaccumulation index (Igeo), pollution index (PI), and potential ecological risk index (PER) were calculated to assess the pollution level in soils. The hazard index (HI) and carcinogenic risk (RI) were used to assess human health risk of heavy metals. The average concentration of Cr, Cd, Pb, Zn, Cu, and Ni were 69.9, 0.86, 45.1, 213, 52.3, and 33.5mg/kg, respectively. The Igeo and PI values of heavy metals were in the descending order of Cd>Zn>Cu>Pb>Ni>Cr. Higher Igeo value for Cd in soil indicated that Cd pollution was moderate. Pollution index indicated that urban soils were moderate to highly polluted by Cd, Zn, Cu, and Pb. The spatial distribution maps of heavy metals revealed that steel industrial district was the contamination hotspots. Principal component analysis (PCA) and matrix cluster analysis classified heavy metals into two groups, indicating common industrial sources for Cu, Zn, Pb, and Cd. Matrix cluster analysis classified the sampling sites into four groups. Sampling sites within steel industrial district showed much higher concentrations of heavy metals compared to the rest of sampling sites, indicating significant contamination introduced by steel industry on soils. The health risk assessment indicated that non-carcinogenic values were below the threshold values. The hazard index (HI) for children and adult has a descending order of Cr>Pb>Cd>Cu>Ni>Zn. Carcinogenic risks due to Cr, Cd, and Ni in urban soils were within acceptable range for adult. Carcinogenic risk value of Cr for children is slightly higher than the threshold value, indicating that children are facing slight threat of Cr. These results provide basic information of heavy metal pollution control and environment management in steel industrial regions. Copyright © 2015 Elsevier Inc. All rights reserved.
Determination of multielement concentrations in normal human organs from the Japanese
[J].DOI:10.1385/BTER:90:1-3 URL [本文引用: 1]
Heavy metal stress in plants:Ways to alleviate with exogenous substances
[J].DOI:10.1016/j.scitotenv.2023.165397 URL [本文引用: 1]
农田土壤重金属污染评价研究进展
[J].
Research progress on evaluation of heavy metal pollution in farmland soil
[J].
镉、铅、汞对血管的损伤及其机制研究进展
[J].
Advances on damage and mechanisms of Cd,Pb,and Hg to blood vessels
[J].
Serum copper and the risk of cardiovascular disease death in Finnish men
[J].DOI:10.1016/j.numecd.2022.09.024 URL [本文引用: 1]
苏南典型区土壤—水稻系统中重金属迁移特征及定量模型研究
[J].
Migration characteristics and quantitative model of heavy metals in the typical polluted areas of southern Jiangsu Province
[J].
回归模型法推导油菜田土壤Cd限值的不确定性
[J].
Uncertainty of deducing Cd limit value in rape field soil by regression model method
[J].
Heavy metal concentrations in rice that meet safety standards can still pose a risk to human health
[J].
珠江三角洲不同成土母质发育水稻土镉活动性差异及其影响因素
[J].
Differences of cadmium mobility in paddy soils from different parent materials in the Pearl River Delta and its influencing factors
[J].
不同类型水稻镉富集与转运能力的差异分析
[J].
Differences in cadmium accumulation and transfer capacity among different types of rice cultivars
[J].
广西重金属镉的区域性分布特征与土壤污染状况评价
[J].
Regional distribuiton characterstics of cadmium and evaluation of soil pollution situation in Guangxi
[J].
高地球化学背景地区重金属污染分布特征及源解析研究
[J].
Distribution characteristics and enrichment mechanisms of heavy metal pollution in high geochemical background areas
[J].
黄河上游重金属元素分布特征及生态风险评价
[J].
Distribution of heavy metals in the upstream of Yellow River and ecological risk assessment
[J].
中国湖南省西部吉首地区石灰岩风化剖面的矿物学和地球化学特征
[J].
Mineralogical and geochemical characteristics of the limestone weathering profile in Jishou,Western Hunan Province,China
[J].
Fractionation and risk assessment of heavy metals in soil samples collected along Zerqa River,Jordan
[J].DOI:10.1007/s12665-011-1222-6 URL [本文引用: 1]
Identification of key genes and modules in response to Cadmium stress in different rice varieties and stem nodes by weighted gene co-expression network analysis
[J].
DOI:10.1038/s41598-020-66132-4
PMID:32533096
[本文引用: 1]
Soil cadmium (Cd) pollution threatens food safety. This study aimed to identify genes related to Cd accumulation in rice. Low- (Shennong 315, short for S315) and high- (Shendao 47, short for S47) Cd-accumulative rice cultivars were incubated with CdCl·2.5HO. RNA-seq and weighted gene co-expression network analysis (WGCNA) were performed to identify the modules and genes associated with Cd-accumulative traits of rice. After Cd stress treatment, the Cd content in various tissues of S315 was significantly higher than that of S47. In the stem nodes, the Cd distribution results of the two varieties indicated that the unelongated nodes near the root (short for node A) had a stronger ability to block Cd transfer upwards than the panicle node (short for node B). Cd stress induced huge changes in gene expression profiles. After analyzing the differentially expressed genes (DEGs) in significantly correlated WGCNA modules, we found that genes related to heavy metal transportation had higher expression levels in node A than that in node B, such as Copper transporter 6 (OS04G0415600), Zinc transporter 10 (OS06G0566300), and some heavy-metal associated proteins (OS11G0147500, OS03G0861400, and OS10G0506100). In the comparison results between S315 and S47, the expression of chitinase (OS03G0679700 and OS06G0726200) was increased by Cd treatment in S315. In addition, OsHSPs (OS05G0460000, OS08G0500700), OsHSFC2A (OS02G0232000), and OsDJA5 (OS03G0787300) were found differentially expressed after Cd treatment in S315, but changed less in S47. In summary, different rice varieties have different processes and intensities in response to Cd stress. The node A might function as the key tissue for blocking Cd upward transport into the panicle via vigorous processes, including of heavy metal transportation, response to stress, and cell wall.
Rice and heavy metals:A review of cadmium impact and potential remediation techniques
[J].DOI:10.1016/j.scitotenv.2024.177403 URL
广西典型碳酸盐岩区农田土壤—作物系统重金属生物有效性及迁移富集特征
[J].
Bioavailability,migration and enrichment characteristics of heavy metals in farmland soil-crop system in typical carbonate rock areas of Guangxi
[J].
珠江三角洲西部典型乡镇稻米与根系土重金属元素含量关系研究
[J].
Study on the relationship between the contents of heavy metals in rice and root soils in typical townships in the western Pearl River Delta
[J].
Heavy metal contaminations in a soil-rice system:Identification of spatial dependence in relation to soil properties of paddy fields
[J].DOI:10.1016/j.jhazmat.2010.05.081 URL [本文引用: 1]
Cadmium distribution in rice:Understanding the role of plant nodes and growth stages
[J].DOI:10.1016/j.envpol.2024.124919 URL [本文引用: 1]
地质高背景区土壤—水稻系统重金属含量特征与综合质量评价
[J].
Characteristics and comprehensive quality assessment of heavy metals in soil-crop system of high geological background area
[J].
水稻子实对不同形态重金属的累积差异及其影响因素分析
[J].
Accumulation of heavy metals in rice seeds as influenced by metal speciation and soil properties
[J].
Transfer of potentially toxic elements from biosolid-treated soils to maize and wheat crops
[J].DOI:10.1016/j.agee.2006.06.001 URL [本文引用: 1]
Grain zinc,iron,and copper concentrations of wheat grown in central Iran and their relationships with soil and climate variables
[J].
DOI:10.1021/jf902074f
PMID:19883069
We performed a survey in central Iran to assess the variability in grain zinc (Zn), iron (Fe), and copper (Cu) concentrations of winter wheat and their relationships with soil and climate variables under field conditions. The goal was to identify factors that should be studied further to improve wheat cultivation in the study area with respect to the nutritional quality of this main Iranian staple crop. Soil and grain samples were collected from 137 randomly selected wheat fields in the provinces of Qom, Isfahan, and Fars. In general, soils were characterized by a high pH. Grain micronutrient concentrations ranged from 11.7 to 64.0 mg kg(-1) (mean, 31.6 mg kg(-1)) for Zn, from 21.1 to 96.6 mg kg(-1) (mean, 42.7 mg kg(-1)) for Fe, and from 2.4 to 9.3 mg kg(-1) (mean, 5.5 mg kg(-1)) for Cu. The grain concentrations of these three metals were positively correlated to each other. DTPA-extractable and total soil micronutrient concentrations alone were very poor predictors of grain micronutrient concentrations. Predictions were slightly improved when other soil and climate variables were taken into account (Zn, R2=0.26; Fe, R2=0.08; and Cu, R2=0.13).
Prediction of Cadmium uptake by brown rice and derivation of soil-plant transfer models to improve soil protection guidelines
[J].
DOI:10.1016/j.envpol.2009.03.009
PMID:19345457
[本文引用: 1]
Cadmium (Cd) levels in paddy fields across Taiwan have increased due to emission from industry. To ensure the production of rice that meets food quality standards, predictive models or suitable soil tests are needed to evaluate the quality of soils to be used for rice cropping. Levels of Cd in soil and rice grains were measured in 19 paddy fields across the western plains in Taiwan. Cadmium levels in soil range from less than 0.1 mg kg(-1) to 30 mg kg(-1). Measured Cd levels in brown rice were predicted very well (R(2) > 0.8) based on Cd and Zinc in a 0.01 M CaCl(2) extract or a soil-plant transfer model using the reactive soil Cd content, pH, and cation exchange capacity. In contrast to current soil quality standards used in Taiwan, such models are effective in identifying soils where Cd in rice will exceed food quality standards.
地质建造对土壤性质的制约及其生态环境效应——以西昌地区红壤为例
[J].
Restriction of geological formation on soil properties and its ecological environmental effects:Example from red soil in the Xichang area
[J].
南宁市郊周边农田土壤—农作物系统重金属元素迁移特征及其影响因素
[J].
Characteristics of transfer and their influencing factors of heavy metals in soil-crop system of peri-urban agricultural soils of Nanning,South China
[J].
赣西地区土壤—水稻系统中重金属Cd元素地球化学特征与健康风险评价
[J].
Geochemical characteristics and health risk assessment of heavy metal Cd in soil-rice system in Western Jiangxi Province
[J].
广西典型岩溶区农田土壤—作物系统Cd迁移富集影响因素
[J].
Influencing factors of Cd migration and enrichment in farmland soil-crop system in typical karst areas of Guangxi
[J].
浙江省典型水稻产区土壤—水稻系统重金属迁移特征及定量模型
[J].
Characteristics and quantitative model of heavy metal transfer in soil-rice systems in typical rice production areas of Zhejiang Province
[J].
