

0 引言
水、土壤和植被是地球系统的关键要素[1],它们的动态相互作用深受农业耕作、矿山开采等人类活动影响,不适当的土地管理方法可能会导致土壤、植被的退化,进而对农业生产和生态环境造成负面影响[2-
桦川县、集贤县、友谊县位于三江腹地,是重要的粮食生产区之一,水—土壤—植被系统维持着农业景观中水分、养分的循环,水、土壤、资源的短缺及其耦合特征将限制农业生产并威胁粮食供应。本研究利用统计指标将水、土壤和植被特征联系起来,运用耦合模型来评估其耦合程度,为农业可持续生产和科学管理提供科学参考。
1 研究区概况
研究区地处黑龙江省东北部,三江平原腹地,松花江下游南岸,地理坐标东经130°16'~132°15',北纬46°28'~47°14',区域内交通便利,有铁路、公路和航空等多种交通方式,主要种植作物有玉米、水稻、大豆等,是黑龙江省的粮食主产区之一。如图1所示,研究区地形由西南向东北逐渐倾斜,南部为完达山余脉,构成低山丘陵区,东北部为平原和沼泽地。研究区气候属寒温带大陆性季风气候,四季分明,多年平均气温3.8 ℃,多年平均降雨量510.5 mm。广泛发育草甸土、黑土、暗棕壤。研究区前第四系地层发育广泛,由古元古界、古生界泥盆系、中生界白垩系和新生界新近系组成,第四系广泛发育在研究区中部和北部。
图1
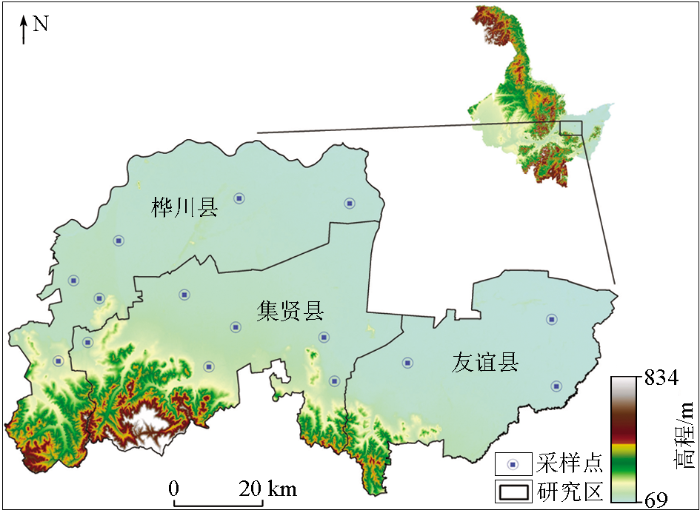
图1
研究区位置及采样点分布
Fig.1
Location of the study area and distribution of sampling points
2 数据来源及方法
2.1 样品采集与测试
在桦川县、集贤县、友谊县进行地下水和土壤样品采集工作,共采集水质和土壤样品各15件(图1)。每个水样采集5 L,并盖紧密封,贴好标签,于当天送往黑龙江省地质矿产实验测试研究中心进行pH、阳离子(Ca2+、K+、Mg2+、Na+)、阴离子(S
2.2 研究方法
2.2.1 指标体系构建及权重确定
1)数据标准化处理
不同的评价指标具有不同的单位和量纲,为了消除尺度的影响,保证各指标对于评价结果的科学性,需要对数据进行标准化处理,其中Se、I、F、容重、pH、黏粒、砂粒、粉粒结合研究区实际情况和参考《土地质量地球化学评价规范》(DZ/T 0295—2016),采用区间化方法(式(1)),其最优上、下限如表1所示,土壤其余指标采用式(2)进行正向化处理,水体指标采用式(3)进行负向化处理。
式中:F(xi)为各评价指标的标准化值;xi为各指标值;max(xi)、min(xi)为第i项指标中的最大值和最小值;p、q分别为最优范围的下限值和上限值。
表1 适宜性指标上、下限
Table 1
| 指标 | w(Se)/ 10-6 | w(I)/ 10-6 | w(F)/ 10-6 | 容重/ (g·cm-3) | pH | 黏粒 /% | 粉粒 /% | 砂粒 /% |
|---|---|---|---|---|---|---|---|---|
| 上限值 | 0.175 | 1.5 | 500 | 1.2 | 6.5 | 40 | 40 | 20 |
| 下限值 | 0.4 | 5 | 550 | 1.4 | 7.5 | 55 | 55 | 50 |
2)权重确定
表2 水体指标主成分得分系数及指标权重
Table 2
| 指标 | F1 | F2 | F3 | 综合得分系数 | 权重 |
|---|---|---|---|---|---|
| Ca2+ | 0.361 | -0.104 | -0.038 | 0.217 | 0.096 |
| K+ | -0.046 | -0.114 | 0.900 | 0.039 | 0.017 |
| S | 0.249 | 0.435 | 0.086 | 0.273 | 0.121 |
| Cl- | 0.261 | 0.445 | 0.137 | 0.288 | 0.128 |
| Mg2+ | 0.362 | -0.049 | 0.015 | 0.235 | 0.104 |
| Na+ | 0.334 | -0.064 | 0.192 | 0.231 | 0.102 |
| TDS | 0.372 | -0.007 | 0.064 | 0.256 | 0.113 |
| N | 0.286 | 0.174 | 0.044 | 0.236 | 0.104 |
| fCO2 | 0.285 | -0.059 | -0.337 | 0.144 | 0.064 |
| TH | 0.366 | -0.090 | -0.021 | 0.224 | 0.099 |
| HC | 0.233 | -0.472 | -0.037 | 0.049 | 0.022 |
| pH | -0.073 | 0.564 | -0.059 | 0.069 | 0.030 |
表3 土壤指标主成分得分系数及指标权重
Table 3
| 指标 | F1 | F2 | F3 | F4 | F5 | 综合得分系数 | 权重 |
|---|---|---|---|---|---|---|---|
| B | 0.261 | 0.016 | 0.210 | 0.311 | 0.005 | 0.174 | 0.046 |
| Mo | 0.331 | 0.092 | 0.088 | 0.022 | 0.166 | 0.198 | 0.052 |
| Mn | 0.054 | 0.176 | 0.480 | 0.128 | 0.365 | 0.173 | 0.046 |
| S | 0.242 | 0.344 | 0.017 | 0.003 | 0.070 | 0.203 | 0.054 |
| Cu | 0.254 | 0.125 | 0.100 | 0.365 | 0.125 | 0.200 | 0.053 |
| Zn | 0.319 | 0.138 | 0.057 | 0.166 | 0.062 | 0.203 | 0.054 |
| P | 0.101 | 0.313 | 0.374 | 0.155 | 0.271 | 0.209 | 0.056 |
| N | 0.219 | 0.364 | 0.026 | 0.103 | 0.091 | 0.210 | 0.056 |
| K | 0.308 | 0.114 | 0.092 | 0.237 | 0.121 | 0.208 | 0.055 |
| SOM | 0.211 | 0.361 | 0.045 | 0.115 | 0.114 | 0.212 | 0.056 |
| CaO | 0.226 | 0.321 | 0.023 | 0.103 | 0.055 | 0.199 | 0.053 |
| MgO | 0.338 | 0.016 | 0.065 | 0.074 | 0.001 | 0.168 | 0.045 |
| 砂粒 | 0.083 | 0.166 | 0.268 | 0.148 | 0.622 | 0.181 | 0.048 |
| 黏粒 | 0.263 | 0.113 | 0.221 | 0.129 | 0.415 | 0.220 | 0.058 |
| 粉粒 | 0.217 | 0.306 | 0.055 | 0.138 | 0.111 | 0.203 | 0.054 |
| pH | 0.013 | 0.056 | 0.002 | 0.588 | 0.077 | 0.079 | 0.021 |
| 容重 | 0.282 | 0.165 | 0.098 | 0.214 | 0.091 | 0.206 | 0.055 |
| F | 0.126 | 0.269 | 0.174 | 0.061 | 0.309 | 0.179 | 0.047 |
| I | 0.082 | 0.068 | 0.495 | 0.321 | 0.050 | 0.149 | 0.040 |
| Se | 0.086 | 0.298 | 0.374 | 0.225 | 0.139 | 0.194 | 0.051 |
2.2.2 耦合模型建立
1)耦合度模型
耦合度是描述系统与系统要素之间的相互关系和影响程度[24]的指标,当系统或系统内各要素合理配合、和谐发展时,称为良性耦合;否则,称为恶性耦合。水—土壤—植被系统的耦合度计算如下式所示:
式中:C为水—土壤—植被系统的耦合度,其值为0~1,值越大表示水—土壤—植被系统要素之间的关联程度越高;f(x)表示水体综合评价指数,g(y)表示土壤综合评价指数,h(z)表示植被综合评价指数,其公式分别为:
式中:ai、bi、ci分别为水体、土壤、植被系统指标的权重值;xi、yi、zi为分别为水体、土壤、植被系统指标的标准化值;植被系统h(z)采用5~9月平均植被指数来表征植被系统的综合得分。
2)耦合协调度模型
耦合度反映了不同系统之间交互的强度,但不能反映系统之间协调的程度。因此,在耦合模型的基础上有必要引入耦合协调度模型来量化水—土壤—植被系统之间的协调性,具体公式如下:
式中:D为耦合协调度;T为综合协调度系数;α、β、δ为水体、土壤、植被系统的贡献率,考虑到水、土壤和植被系统在农业生产生活中占据同等重要地位,设α=β=δ=
2.3 数据处理与分析
釆用Excel2010和SPSS25.0进行数据统计分析,运用Origin2021软件进行主成分分析法确定评价指标权重及制图。
3 结果与分析
3.1 水体、土壤理化性质分析
3.1.1 水体指标特征
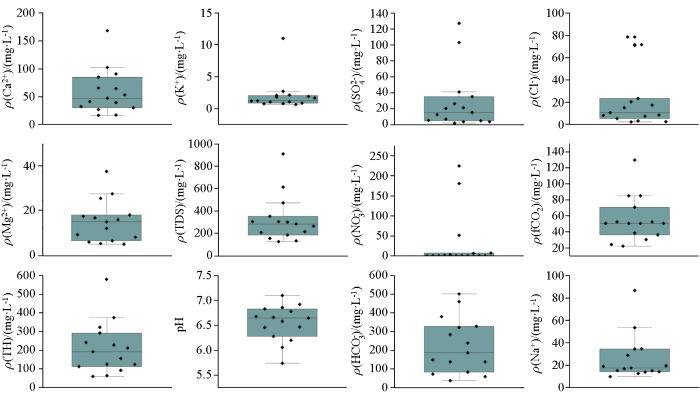
水体评价指标特征如图2所示,依据《地下水质量标准》(GB/T 14848—2017),地下水pH变化范围为5.74~7.10,整体呈中性,部分地区呈弱酸性。TH变化范围为60.59~579.63 mg/L,均值为212.13 mg/L,表明研究区地下水整体以硬水为主,部分地区为软水[25]。TDS变化范围为128.00~910.00 mg/L,水质为淡水,N
图2
3.1.2 土壤指标特征
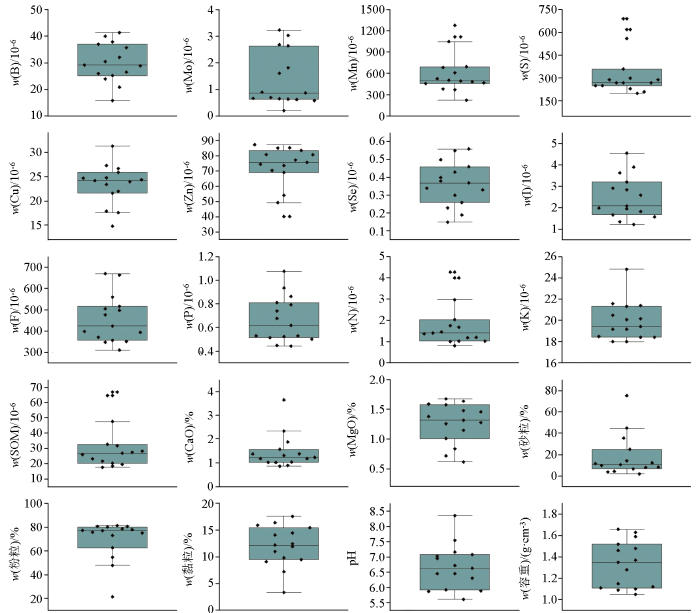
土壤评价指标特征如图3所示,土壤质地以壤土为主,质地适中,依据《土地质量地球化学评价规范》(DZ/T 0295—2016),土壤中必需大量元素SOM、N、P、K等级以中等—丰富为主;必需中量元素CaO、MgO等级以中等为主,S等级以丰富为主;微量元素Mo、Zn等级以较丰富—丰富为主,B等级以缺乏—较缺乏为主,Mn等级以较缺乏—中等为主,Cu等级以中等—较丰富为主,Se等级以适量—高为主,I等级以适量为主,F等级以缺乏—边缘为主;pH以中性为主。
图3
3.2 植被与水体和土壤指标的灰色关联分析
使用灰色关联分析方法,可以通过少量的数据更准确地分析系统之间的相关性,利用数据序列的几何曲线的相似程度来确定它们是否紧密相关。曲线越相似,序列越相关,反之亦然。通常使用关联度来描述各系统在发展和变化过程中的相关程度,关联度越高,说明相应指标对系统发展的影响程度越大[26-
图4
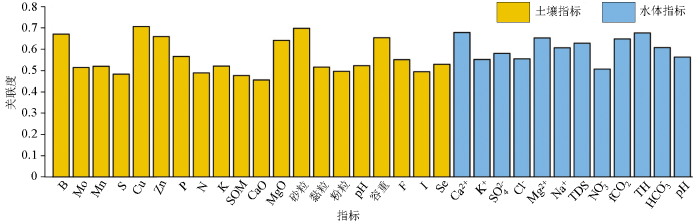
图4
NDVI与水体、土壤评价指标的灰色关联度
Fig.4
Gray correlation between NDVI and water and soil evaluation indicators
3.3 水—土壤—植被的耦合关系
表4 水—土—植被系统耦合协调程度分类及评判标准
Table 4
| 耦合协调度D | 耦合协调特征 | 水—土—植被系统 耦合模式 |
|---|---|---|
| 0<D≤0.2 | 水土植被耦合关系极度失调 | 低级协调发展模式 |
| 0.2<D≤0.4 | 水土植被耦合关系严重失调 | 初级协调发展模式 |
| 0.4<D≤0.6 | 水土植被耦合关系勉强协调 | 中级协调发展模式 |
| 0.6<D≤0.8 | 水土植被耦合关系良好协调 | 良好协调发展模式 |
| 0.8<D≤1.0 | 水土植被耦合关系同步发展 | 优质协调发展模式 |
不同点位水体综合评价指数f(x)、土壤综合评价指数g(y)、植被综合评价指数h(z)以及水、土壤和植被耦合度及耦合协调度结果见表5所示,对不同区域进行简单平均可知,水体综合指数f(x)顺序为桦川县>友谊县>集贤县;土壤综合评价指数g(y)顺序为友谊县>集贤县>桦川县;植被综合评价指数h(z)顺序为友谊县>桦川县>集贤县。不同点位耦合度C值变化范围为0.73~1.0,除点位9的耦合度值较低外,其余点位耦合度均较高。耦合协调度D值变化范围为0.25~0.68,大部分点位的耦合协调程度较好,处于良好协调发展模式,水体质量较好,土壤N、P、K、SOM、微量元素丰富,容重、pH适中, 为植物生长提供了良好的环境,能够有效提高农作物的产量和质量。桦川县和集贤县部分耦合程度较差,处于初级协调发展和中级协调发展模式。
表5 水—土壤—植被系统耦合协调状况评判结果
Table 5
| 点位 编号 | f(x) | g(y) | h(z) | C值 | D值 | 水—土—植被 系统耦合模式 |
|---|---|---|---|---|---|---|
| 1 | 0.82 | 0.45 | 0.68 | 0.97 | 0.63 | 良好协调发展模式 |
| 2 | 0.94 | 0.30 | 0.64 | 0.90 | 0.56 | 中级协调发展模式 |
| 3 | 0.93 | 0.41 | 0.61 | 0.94 | 0.61 | 良好协调发展模式 |
| 4 | 0.91 | 0.36 | 0.60 | 0.93 | 0.58 | 中级协调发展模式 |
| 5 | 0.62 | 0.44 | 0.63 | 0.99 | 0.56 | 中级协调发展模式 |
| 6 | 0.82 | 0.47 | 0.63 | 0.97 | 0.62 | 良好协调发展模式 |
| 7 | 0.80 | 0.41 | 0.45 | 0.96 | 0.53 | 中级协调发展模式 |
| 8 | 0.86 | 0.56 | 0.63 | 0.98 | 0.67 | 良好协调发展模式 |
| 9 | 0.07 | 0.42 | 0.54 | 0.73 | 0.25 | 初级协调发展模式 |
| 10 | 0.43 | 0.46 | 0.72 | 0.97 | 0.52 | 中级协调发展模式 |
| 11 | 0.86 | 0.39 | 0.68 | 0.95 | 0.61 | 良好协调发展模式 |
| 12 | 0.84 | 0.56 | 0.65 | 0.99 | 0.68 | 良好协调发展模式 |
| 13 | 0.65 | 0.61 | 0.66 | 1.00 | 0.64 | 良好协调发展模式 |
| 14 | 0.65 | 0.66 | 0.64 | 1.00 | 0.65 | 良好协调发展模式 |
| 15 | 0.79 | 0.45 | 0.64 | 0.98 | 0.61 | 良好协调发展模式 |
4 结论与讨论
水、土壤和植被之间的耦合协调关系是实现农业可持续发展的基础,本文通过建立水、土壤和植被的耦合模型,运用综合评价函数将水、土壤和植被3个系统进行耦合,并探究了水和土壤对于植被生长发育的主要影响因素。
水、土壤和植被是一个相互影响、相互制约的系统,土壤和水资源的具体管理实践可以影响植物的水和养分的可用性,如果水分和养分不足,植被的生长将受到限制。土壤在植物生长中发挥着至关重要的作用,为植物提供养分、氧气、水分和热量调节等方面的支持。植物通过根部从土壤中提取水以及养分,稳定的水分供应和养分输送能够保持植物生长发育。由耦合协调评价结果可知,不同点位的耦合度和耦合协调度并不一致,研究区水、土壤和植被的协调程度整体处于良好协调发展模式,分析发现,影响点位9和10的耦合程度的主要因素为水体质量,南部山区的煤矿开采可能是影响水质的主要原因,据相关研究证明,煤矿开采活动对区域地质环境影响很大,尤其是地下水系统特别容易遭受破坏,打破地下水原有的平衡和循环关系,矿井水通常具有高盐度、高矿化度特征,煤矿的开采导致水中的TDS、TH、S
综上所述,研究区建议应加强南部山区煤矿的矿山治理,采取必要的生态恢复措施促进地下水生态环境的改善。桦川县北部区域微量元素普遍缺乏且根据野外实际调查松花江南部一带耕地砂粒含量普遍偏高,在农业生产中应加强耕地保护性耕作并添加适量的微量元素肥料,改善土壤理化性质和生物环境,进一步促进植物生长。通过合理利用地下水资源,保护土壤肥力和植被覆盖,可以促进农业生产的可持续发展。这种耦合关系的平衡也有助于减少农业生产对环境的负面影响,促进生态环境的保护和修复。
参考文献
地球关键带科学与水文土壤学研究进展
[J].
Advances in earth's critical zone science and hydropedology
[J].
气候变化和人类活动对祁连山国家公园植被净初级生产力的定量影响
[J].
Quantitative analysis of the impacts of climate change and human activities on vegetation NPP in the Qilian Mountain National Park
[J].
Impact of fertilizers and pesticides on soil microflora in agriculture
[J].
县域农业生态环境质量动态评价及预测
[J].
Dynamic assessment and prediction on quality of agricultural eco-environment in county area
[J].
近20年来黄土高原蒸散发变化规律及其驱动因素
[J].
Changes of evapotranspiration and its driving factors in the Loess Plateau in recent 20 years
[J].
基于RHESSys模型的延河流域水文要素定量模拟
[J].
Quantitative simulation of hydrological elements based on RHESSys model in Yanhe River Basin
[J].
黄河流域水文干旱时空特征研究
[J].
Spatial and temporal characteristics of hydrological drought in the Yellow River Basin
[J].
城市化背景下年最大日径流演变及影响因素研究
[J].
The evolution of annual maximum daily runoff and its influencing factors under the back-ground of urbanization:An example of Qinhuai River Basin in the lower reaches of the Yangtze River
[J].
湘西石漠化地区植物多样性与土壤因子的耦合关系
[J].
Coupling relationships between plant diversity and soil characteristics in rocky desertification areas of western Hunan
[J].
陕北黄土区不同植被恢复模式植被与土壤耦合关系研究
[J].
DOI:10.11686/cyxb2020458
[本文引用: 2]

植被与土壤耦合协调关系是退耕还林还草工程高效实施与可持续发展的重要依据。通过对陕北黄土区针叶纯林、阔叶纯林、针阔混交林、乔灌复层林、灌木林和天然草地6种不同植被恢复模式植被和土壤的全面调查与采样分析,建立植被与土壤耦合关系评价指标体系,综合运用层次分析法和熵权法确定各表征指标的权重,构建了不同植被恢复模式植被与土壤耦合协调度模型。结果表明:不同植被恢复模式对土壤水分和养分影响差异显著,针阔混交林的土壤环境综合评价最好,乔灌复层林最差。不同植被恢复模式的植被郁闭度、生物量、营养元素含量和生物多样性指数均存在显著差异,针阔混交林的植被群落综合评分最高,天然草地最低。土壤环境因子与植被生物量、营养元素及生物多样性密切相关。不同植被恢复模式耦合协调度依次为针阔混交林(0.767)>阔叶纯林(0.661)>天然草地(0.655)>灌木林(0.646)>针叶纯林(0.628)>乔灌复层林(0.234),其中针阔混交林为中级协调同步发展型,阔叶纯林属于初级协调同步发展型,天然草地属于初级协调植被滞后型,灌木林和针叶纯林均处于初级协调土壤滞后型,乔灌复层林则为中度失调土壤损益型。陕北黄土区植被恢复重建宜种植针阔混交林,还需加强植被抚育和土壤管理,避免配置乔灌复层林。
Coupling relationships between vegetation and soil in different vegetation restoration models in the Loess region of Northern Shaanxi Province
[J].
喀斯特峰丛洼地退耕还林还草工程的植被土壤耦合协调度模型
[J].
Models of vegetation and soil coupling coordinative degree in grain for green project in depressions between Karst hills
[J].
不同退耕类型土壤—植被系统耦合协调关系评价
[J].
Evaluation of coupling coordination relationship between soil and vegetation systems in different afforestation types
[J].
荒漠草原人工柠条林土壤与植被的演变特征
[J].DOI:10.16258/j.cnki.1674-5906.2015.04.007 [本文引用: 2]
Antidromal succession between soil and plant in the Caragana intermedia shrubland in the desert steppe
[J].
宁南山区坡面不同土地利用方式下植被—土壤耦合关系评价
[J].
Evaluation on coupling of vegetation and soil on slopes of mountain area in southern Ningxia
[J].
毛乌素沙地东南缘不同沙漠化阶段土壤—植被关系研究
[J].
Study on the correlation of soil-vegetation in different desertification stages on the southeastern edge of Mu Us Sandy Land
[J].
农田排水资源灌溉利用适宜性评价指标体系研究
[J].
Evaluation index system of the suitability of drainage water for irrigation in agriculture
[J].
基于主成分分析的中国南方干旱脆弱性评价
[J].
Evaluation of drought vulnerability in Southern China based on principal component analysis
[J].
Use time series NDVI and EVI to develop dynamic crop growth metrics for yield modeling
[J].
Improving crop yield estimation by applying higher resolution satellite NDVI imagery and high-resolution cropland masks
[J].
Analysis of NDVI data for crop identification and yield estimation
[J].
土壤质量评价指标体系的构建及评价方法
[J].
DOI:10.3864/j.issn.0578-1752.2021.14.010
[本文引用: 1]
【目的】探究国内外土壤质量评价方法与指标体系,梳理土壤质量评价中的研究热点与发展前沿,为我国土壤质量评估研究及方法应用提供科学参考。【方法】基于Web of Science 和CNKI数据库,利用文献计量检索方法,收集有关土壤质量评价指标、最小数据集筛选、土壤质量评价方法等方面的文献415篇、最小数据集155个。基于土壤质量评价指标选取频率、评价方法和最小数据集等信息,分析近30年来全球土壤质量评价的发展态势、前沿领域以及评价中存在的问题。【结果】国内外土壤质量评价指标体系涉及25个物理指标、36个化学指标、35个生物指标和19个环境指标。土壤有机质作为土壤质量的核心指标,其选取频率最高,为96.6%;其次是土壤酸碱度、全氮、速效磷、速效钾和容重,选取频率均在50%以上;微生物生物量、土壤酶活性等生物指标选取频率较低,均小于25%,但呈逐年增加的趋势。最小数据集构建方法中,主成分分析能最大限度地减少指标冗余,体现原始变量的绝大部分信息,应用最为广泛。被筛选进入最小数据集的指标中,有机质、速效磷、容重和土壤酸碱度在表征土壤质量时应用广泛,频率分别为67.7%、43.2%、34.8%和34.2%。目前土壤质量评价研究主要采用主成分分析方法筛选土壤质量指标,运用土壤质量指数法进行综合评价,能较准确地评估管理措施对土壤质量的影响,适用于土壤可持续管理。【结论】土壤有机质、速效磷、酸碱度、容重和含水量是表征土壤质量的重要评价指标。构建能够客观、全面、真实地反映土壤质量变化的指标体系及其与信息技术的融合是未来土壤质量评价研究的重点,应用指标体系在大空间尺度评估土壤质量是未来发展的趋势。
Advance in indicator screening and methodologies of soil quality evaluation
[J].
DOI:10.3864/j.issn.0578-1752.2021.14.010
[本文引用: 1]
【Objective】 The objectives of the present study were to synthesize the current information on soil quality assessment method and indicator system, and to present the hot topics and frontiers related to soil quality, so as to, provide references for Chinese scholars and experts in the field of soil quality evaluation research and application. 【Method】 The published articles regarding the selection of soil quality indicators, construction of minimum data set, and selection of soil quality evaluation methods were collected based on Web of Science and CNKI databases using bibliometrics method, and a total of 415 articles and 155 minimum data sets related to soil quality evaluation were screened. Development trend, frontier fields and current problems of global soil quality assessment during the past 30 years were analyzed according to selection frequency of indicators, assessment method and construction of minimum data set. 【Result】 The soil quality evaluation indicator system mainly included 25 physical, 36 chemical, 35 biological and 19 environmental indicators. Soil organic matter, as the core indicator of soil quality, was selected with the highest frequency of 96.6%, followed by pH, total nitrogen, available phosphorus, available potassium, and bulk density, with a frequency more than 50%. The selection frequency of biological indicators such as microbial biomass and soil enzyme activity was less than 25%, while increasing over time. Principal component analysis, minimizing indicator redundancy and reflecting most of the information of original variables, was the most widely used for minimum data set construction method. Soil organic matter, available phosphorus, bulk density, and pH were selected into the minimum data set with a frequency of 67.7%, 43.2%, 34.8%, and 34.2%, respectively, being widely used to characterize soil quality. Nowadays, the most studies on soil quality evaluation focus on the utilization of principal component analysis to select soil quality indicators and establish soil quality index for comprehensive soil quality evaluation, which was suitable for sustainable soil management.【Conclusion】 Soil organic matter, available phosphorus, soil pH, bulk density and soil water content were the main parameters selected for soil quality evaluation. Construction a comprehensive and objective soil quality indicator system and the integration with the information technology would be the focus in future research. The application of evaluation indicators in large-scale soil quality assessment was the trend of future development.
基于主成分和聚类分析的黑土肥力质量评价
[J].
Assessment of fertility quality of black soil based on principal component and cluster analysis
[J].
基于主成分分析法对乌鲁木齐河水质的综合评价
[J].以乌鲁木齐河具有代表性的4个监测断面为例,选取2006年7个指标监测数据(PH值、溶解氧、高锰酸钾指数、五日生化需氧量、氨氮、石油类、挥发酚)。运用主成分分析方法,结合统计软件?????????进行分析计算,综合评价乌鲁木齐河,结果表明,基于各断面主成分得分排序,高家户桥得分最高是污染最严重的断面,且高锰酸钾指数、五日生化需氧量、石油类是主要污染指标。综合评价可以精确乌鲁木齐河污染指标,划分严重污染区域,为治理乌鲁木齐水环境提供理论依据。
Comprehensive evaluation of water quality of Urumqi River based on principal component analysis
[J].
九峰山不同林分类型生态恢复植被—土壤系统耦合关系评价
[J].
DOI:10.16258/j.cnki.1674-5906.2021.12.005
[本文引用: 1]
为了解九峰山不同人工林分植物与土壤之间的相互作用,该研究选取了侧柏、柠条、长梗扁桃、山杨、虎榛子、黄刺玫样地以及撂荒地为研究对象,通过对不同人工林的植被调查和土壤样品采样,建立了5个植被因子和7个土壤因子的2层次指标体系,采用层次分析法确定各因子权重,构建不同人工林分类型生态恢复植被-土壤耦合协调模型,为九峰山生态恢复过程中植被和土壤之间相互作用的机制提供理论依。结果表明:不同人工林分类型的植被指标层除Shannon-wiener指数外,其余指标在不同林分间均存在显著差异性(P<0.05);土壤指标层中除土壤含水率与土壤全钾外,其余指标在不同林分间均存在显著性差异(P<0.05);通过耦合协调关系评价发现,不同人工林分的耦合度和耦合协调度并不一一对应,植被与土壤的综合指数在不同人工林分类型中的位置也并不完全一致,虽然通过长时间的人工造林,对生态恢复起到了一定作用,但不同林分的植被土壤耦合协调状况并未达到理想状态,土壤的发展状况整体优于植被发展状况,其中柠条具有较高的植被指数0.2226、虎榛子具有较高的土壤指数0.3866;耦合协调关系评价具体表现为柠条(0.4985)为濒临失调衰退类植被土壤共损型,侧柏(0.4398)、虎榛子(0.4277)、山杨(0.4197)以及长梗扁桃(0.4171)为濒临失调衰退类土壤损益型,黄刺玫(0.3943)为轻度失调衰退类土壤损益型,撂荒地(0.2970)为中度失调衰退类土壤损益型,整体上呈现不同程度的失调衰退类。综上,柠条较其他人工林分能够较好的改善植被—土壤系统中植被恢复与土壤环境的耦合协调性,提高生态恢复效益。
Coupling relationship between vegetation and soil system in ecological restoration of different stand types in Jiufeng Mountain
[J].
Hydrochemical assessment of surface water and groundwater quality along Uyyakondan channel,south India
[J].
基于灰色关联度分析法和主成分分析法对泥页岩储层评价方法的探讨
[J].
Evaluation of shale reservoirs based on grey relation analysis and principal component analysis
[J].
灰色关联分析在不同生态修复模式土壤质量评价中的应用
[J].
Application of grey correlation analysis in different models of ecological restoration in soil quality evaluation
[J].
横坡耕作与优化施肥对缓坡地氮磷流失特征和土壤肥力的影响
[J].
Effects of cross-slope tillage and increasing organic fertilizer on soil nitrogen and phosphorus loss characteristics and soil fertility on gentle slope
[J].
公路边坡植物群落多样性与土壤因子耦合关系
[J].
Modeling the degree of coupling and interaction between plant community diversity and soil properties on highway slope
[J].
坡面植被恢复过程中植被与土壤特征评价
[J].
Evaluation of vegetation and soil characteristics during slope vegetation recovery procedure
[J].
基于层次聚类法的柳江煤矿对地下水水质影响分析
[J].
Impacts of the Liujiang coal mine on groundwater quality based on hierarchical cluster analysis
[J].
草原区露天煤矿开发地下水水质影响评价
[J].
Assessment of the impact on groundwater quality of the open-pit coal mine in prairie region
[J].
不同土壤和微量元素对车桑子幼苗生长的影响
[J].
Effects of soil types and microelements on growth and physiological characteristics of dodonaea viscosa seedlings
[J].
张掖地区土壤微量元素空间分布及其对农产品质量的影响
[J].
DOI:10.11924/j.issn.1000-6850.2014-1220
对张掖市甘州区、临泽县、高台县、民乐县、肃南县及农场耕层土壤进行取样分析,共测试分析789个土样的有效铁、有效锰、有效铜、有效锌和有效硼五项微量元素指标。对测试结果采用Normal-QQplot方法进行正态分布检验,剔除了14个异常离群值。对剩余的775个测试分析数据用地统计普通克里金插值法进行空间插值,根据各微量元素的空间分布和缺素临界值,把五种微量元素按照含量空间分布划分为丰富、持平和不足三个级别。并依据不同级别的肥力区和作物缺素症状,提出各肥力区对农产品质量的影响以及施肥方案,为张掖市作物微肥施用提供参考。
Spatial distribution of soil trace elements and its effect on the quality of agricultural products of Zhangye Region
[J].
DOI:10.11924/j.issn.1000-6850.2014-1220
The available contents of microelements Fe, Mn, Cu, Zn and B were analyzed in 789 soil samples which were selected from different farm soil of Ganzhou District, Linze County, Gaotai County, Minle County and Sunan County in Zhangye area. The normal distribution test of Normal-QQplot was applied to eliminate 14 abnormal outliers. The 775 remaining data were analyzed using statistical ordinary Kriging interpolation test. In line with the spatial distribution of trace element and nutrient deficient critical value, five kinds of trace elements were divided according to the content spatial-distribution into three levels: rich, balanced and less. On the basis of different levels of fertility and crop nutrient deficiency symptom, the author concluded the influence of different fertility areas on agricultural products quality and put forward corresponding fertilization programs, in order to provide a reference for crop fertilizer application of Zhangye City.
Effect of zinc and boron on growth and yield of maize (Zea mays L.)
[J].
