

0 引言
工业革命以来,由于化石燃料的大量使用和土地利用方式的变化,大气中的CO2浓度快速升高[1],以2×10⁻⁶/年的速度持续增加,从工业化前的280×10-6上升至2005年的379×10-6,按此速度增长,到21世纪末有可能达到700×1
在全球气候变化背景下,国内有不少学者在国家或区域尺度上依据全国土地质量区域地球化学调查资料数据对土壤碳储量及其分布[12]、固碳潜力[13]、固碳调控以及土地利用变化与土壤有机碳关系[14]等方面进行了研究。Li等[15]在2007年对中国土壤有机碳和无机碳储量进行估计,预测储量分别为83.8 Pg和77.9 Pg。赵宁等[16]研究表明,近50年间中国陆地生态系统碳汇整体呈上升趋势,年平均为0.213±0.030 Pg。Wu等[17]通过研究人类活动对我国北方碳库的影响,发现人类活动造成土壤无机碳库1.6 Pg的损失。西北黄土高原表层土壤有机碳储量为78.56 Mt, 其储量呈上升趋势[18]。高原冻土区土壤有机碳储量约16.5 Pg, 土壤无机碳储量约14 Pg[19]。尽管已有大量土壤碳储量的研究,但数据资料精度及估算方法的不同,学者们所得研究结果也相差较大。加之自然因素和人类活动的影响,土地利用方式的复杂多样,土壤碳储量在水平空间上表现出的空间变异性较为复杂,以致难以准确获得土壤碳信息,使得同一地区的研究结果存在较大差异。同时,由于深层土壤取样工作较为困难,特别是在中、大尺度的研究中,有关土壤有机碳和无机碳空间变异的研究大都集中于表层30 cm以浅土壤中[20],忽略了对深层土壤有机碳和无机碳的垂直分布特征的研究,对于深层土壤碳库估算还存在很多不确定性。土壤碳储量在空间上的分布直接反映了其土壤肥力的分布特征,是植物健康生长的重要保障[21]。因此,准确评估土壤碳储量是评价区域土壤碳循环对全球气候变化反馈效应的基础。
本文选择黄土高原地区为研究区,利用土地质量地球化学调查获取的土壤碳数据,分析了不同土壤类型、土地利用方式及地形地貌中表层、上层和下层土壤碳含量分布特征,估算了表层、上层和下层土壤全碳、有机碳和无机碳储量,为研究区土壤碳库的评价、区域尺度土壤碳库和碳平衡研究提供科学参考和基础数据。
1 材料与方法
1.1 研究区概况
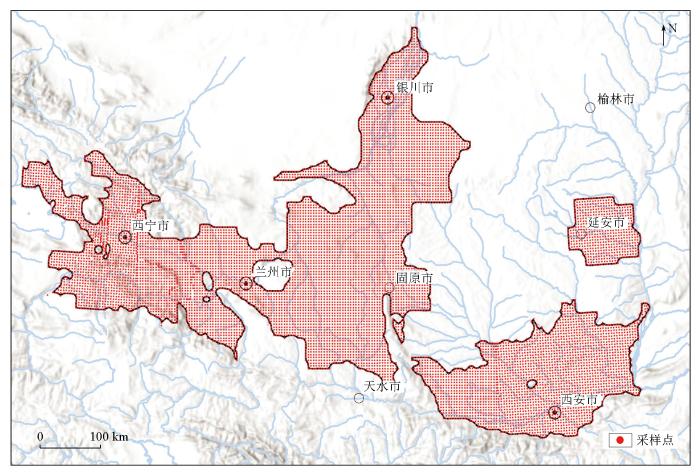
研究区位于黄土高原部分地区,范围西起青海省祁连山,东至太行山,南至秦岭,北抵黄河,涵盖了青海东部、甘肃中东部、陕西中部地区以及宁夏平原,总面积约67.8万km2(图1)。研究区位于中纬度的东部季风区,西风带南部,其中西部和北部属于暖温带—中温带半干旱区,降水量为150~250 mm;东部和南部属暖温带半湿润区,年降水量为600~750 mm,形成夏季、秋季多雨,冬季、春季干旱少雨,平均温度3.6~14.3 ℃,冬季严寒,夏季暖热的气候特点。区内地势西高东低,自西向东波状下降,总体地形地貌景观格局以山地、丘陵、高原、盆地、台地等相间分布。土壤类型主要有黄绵土、灰钙土、褐土、栗钙土、黑垆土、黑毡土、新积土、风沙土、黑钙土、灌淤土、灰褐土、潮土、盐土等;主要土地利用类型为耕地、草地、森林、裸地等。黄土高原是世界上被侵蚀最严重的地区之一[22],黄土沉积区表面已经变得支离破碎[23]。
图1
1.2 数据来源
本文数据来源于西北地区1∶25万土地质量地球化学调查,采用双层网格化方法进行点位布点和采样,表层土壤每1 km2采集1个样,深度0~0.2 m;深层土壤每4 km2采集1个样点,深度1.0~2.0 m,累计采集表层土壤样品43 298件和深层土壤样品10 974件(见图1)。土壤样品干燥后过20目筛,表层土壤以每4 km2分析1个组合样,深层土壤以每16 km2分析1个组合样。根据《多目标区域地球化学调查规范(1∶250 000)》要求,土壤样品中的有机碳采用重铬酸钾容量法分析,全碳采用X射线荧光光谱法分析。按照分析方法准确度和精密度要求,采取严格的质量检查措施。为了有效控制系统分析误差,对分析质量采用全国质量监控制度控制。土地利用类型数据源自https://doi.org/10.5281/zenodo.4417810[24],土壤类型源自
1.3 数据处理
通过对一定区域内单位土壤碳量进行求和,计算得到土壤碳储量,单位土壤碳含量采用网格化计算单元,按照奚小环等[25]提出的可更加逼近真实含量的指数法模型法求取土壤碳储量。
1)表层和深层土壤平均碳含量(S)计算公式为:
①表层土壤(0~0.2 m)平均碳含量:
②深层土壤(1.5~2.0 m)平均碳含量:
式中:TC表、TC深代表表层、深层土壤对应的土壤总碳、无机碳或有机碳含量,%。
2)单位碳含量(USCA)和碳密度(SCD)计算公式为:
①表层土壤(0~0.2 m)单位碳含量:
②上层土壤(0~1.0 m)单位碳含量:
③下层土壤(1.0~2.0 m)单位碳含量:
④上下全层土壤(0~2.0 m)单位碳含量:
式中:104为换算系数;ρ为土壤容重,t/m3;TC为土壤总碳、无机碳或有机碳含量,%;d为土壤深度,其中d1取表层土壤中心深度0.1 m,d2取深层样采样深度2.0 m,d3取1.0 m;USCA单位为t。按照深层土壤样品16 km2内组合为1件样品分析,表层样品通过前期数据处理后,与深层样品数据形成一一对应关系,因此以16 km2为最小统计单元后,即可求得研究区各层土壤有机碳总储量。
3)一定区域内土壤碳储量(SCR)计算公式为:
式中:USCAi为第i个统计单位土壤碳含量,t;n为土壤碳储量统计范围内单位土壤碳量加和个数。
2 结果与分析
2.1 土壤碳储量特征
据统计,研究区上下全层(0~2.0 m)土壤中累计求得总碳10 099.4 Mt,其中有机碳储量3 125.7 Mt,无机碳储量6 973.7 Mt,以无机碳为主,占69.1%;表层土壤(0~0.2 m)中累计求得总碳1 224.8 Mt,其中有机碳储量519.0 Mt,无机碳705.7 Mt,以无机碳为主,占57.6%;上层土壤(0~1.0 m)中累计求得总碳5 345.9 Mt,其中有机碳储量1 887.4 Mt,无机碳储量3 458.5 Mt,以无机碳为主,占64.7%;下层土壤(1.0~2.0 m)中累计求得总碳4 753.5 Mt,其中有机碳储量1 238.3 Mt,无机碳储量3 515.25 Mt,以无机碳为主,占74.0%。如图2所示,碳储量中无机碳大于有机碳,自上而下有机碳占比下降,无机碳占比上升。
图2
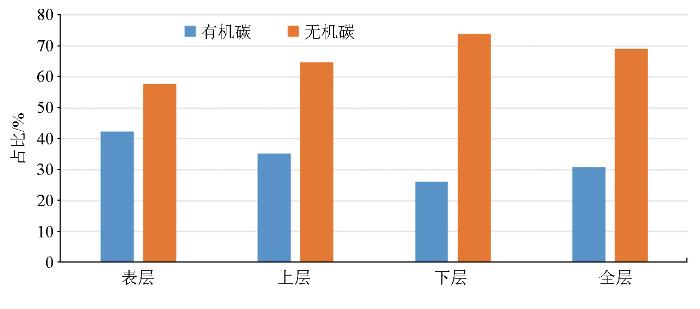
图2
研究区土壤各层中有机碳和无机碳储量占比
Fig.2
The percentage of organic carbon and inorganic carbon reserves in different soil layers of the study area
2.2 土壤碳含量分布特征
图3
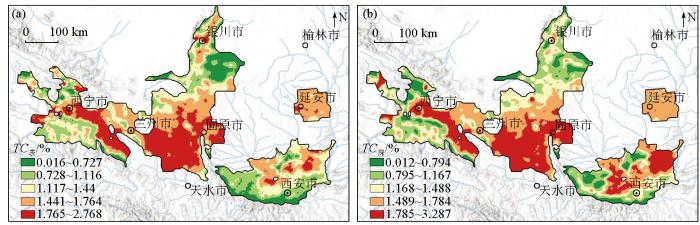
图3
研究区表层(a)和深层(b)土壤无机碳含量分布
Fig.3
Distribution of inorganic carbon content in surface (a) and deep (b) soil layers of the study area
图4
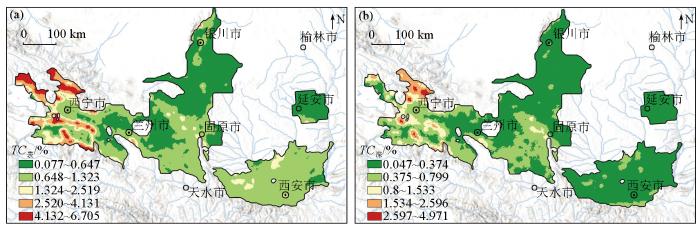
图4
研究区表层(a)和深层(b)土壤有机碳含量分布
Fig.4
Distribution of organic carbon content in surface (a) and deep (b) soil layers of the study area
2.3 不同土壤类型碳含量特征
研究区土壤类型占比见图5,其中以黄绵土为主,占比32.6%。统计不同土壤类型中有机碳、无机碳和总碳含量(图6),发现有机碳含量在表、深层土壤中均呈现较大幅度变化,表层土壤有机碳含量依次为:黑毡土>黑钙土>灰褐土>栗钙土>褐土>黑垆土>新积土>黄绵土>潮土>灌淤土>盐土>灰钙土>风沙土;深层土壤有机碳含量依次为:黑毡土>黑钙土>灰褐土>栗钙土>黑垆土>褐土>黄绵土>灌淤土>新积土>灰钙土>盐土>潮土>风沙土。无机碳在同类型土壤间,表、深层中含量变化幅度不大,但在不同类型土壤间存在较明显的变化,表层为:黑垆土>黄绵土>灌淤土>栗钙土>新积土>盐土>灰钙土>灰褐土>黑毡土>黑钙土>潮土>褐土>风沙土;深层为:黑垆土>黄绵土>栗钙土>灌淤土>新积土>灰钙土>褐土>盐土>灰褐土>黑钙土>潮土>黑毡土>风沙土。总碳受有机碳和无机碳含量变化的影响,表层为:黑毡土>黑钙土>灰褐土>栗钙土>黑垆土>黄绵土>灌淤土>新积土>褐土>盐土>灰钙土>潮土>风沙土;深层为:毡土>灰褐土>黑钙土>黑垆土>栗钙土>黄绵土>灌淤土>新积土>褐土>灰钙土>盐土>潮土>风沙土。
图5
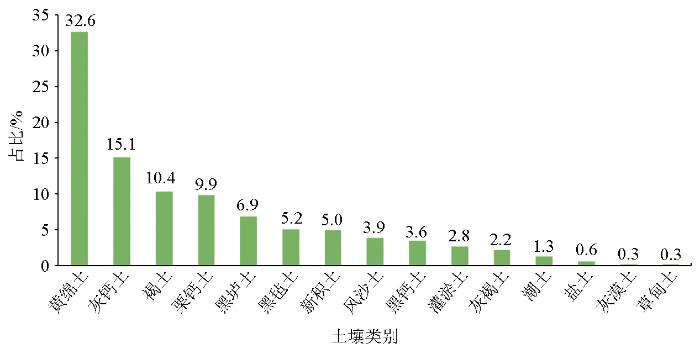
图6
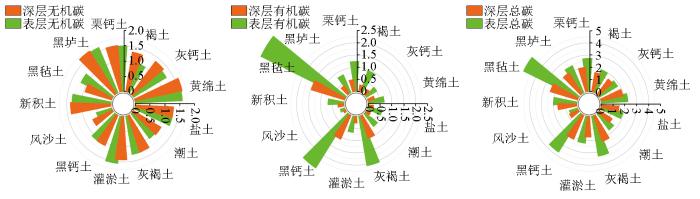
图6
研究区不同土壤类型碳含量(单位:%)
Fig.6
Carbon content of different soil types in the study area (unit:%)
如图6所示,研究区内风沙土具有最低的表、深层有机碳、无机碳和总碳含量,其中表层有机碳、无机碳和全碳含量分别是全区有机碳、无机碳、全碳含量的21.2%、40.9%、32.4%,深层有机碳、无机碳和全碳含量分别是全区对应含量的28.0%、53.5%、47.5%。黑垆土和黄绵土具有最高的表层无机碳含量,分别达1.63%和1.60%;黑毡土具有最高的表层有机碳含量,达到3.96%,是全区表层有机碳含量平均值的4倍;黑垆土具有最高的深层有机碳含量;黑毡土同时具有最高的表层和深层土壤总碳含量。
2.4 不同土地利用类型碳含量特征
表1显示,研究区以草地和耕地为主,表层土壤无机碳含量依次为草地>耕地>森林>裸地,有机碳含量为森林>草地>耕地>裸地,总碳含量为森林>草地>耕地>裸地;深层土壤无机碳含量为耕地>草地>森林>裸地,有机碳含量为森林>草地>耕地>裸地,总碳含量为草地>耕地>森林>裸地。森林具有最高的表层和深层有机碳及表层总碳含量;草原具有最高的表层无机碳和总碳含量;耕地具有最高的深层无机碳含量;裸地具有最低的无机碳、有机碳和总碳含量。
表1 研究区不同土地利用类型有机碳、无机碳和总碳含量
Table 1
| 土地利 用类型 | 样品数 | 表层土壤含量/% | 深层土壤含量/% | ||||
|---|---|---|---|---|---|---|---|
| 无机碳 | 有机碳 | 总碳 | 无机碳 | 有机碳 | 总碳 | ||
| 草地 | 5904 | 1.414 | 1.116 | 2.530 | 1.432 | 0.475 | 1.907 |
| 耕地 | 3662 | 1.379 | 0.825 | 2.205 | 1.501 | 0.351 | 1.852 |
| 森林 | 792 | 1.163 | 1.502 | 2.665 | 1.103 | 0.564 | 1.667 |
| 裸地 | 175 | 0.932 | 0.648 | 1.580 | 0.968 | 0.314 | 1.282 |
2.5 不同地形地貌碳含量特征
表2显示,研究区地形地貌中以黄土地貌为主,黄土、山地和平原具有不同的碳含量,山地具有最高的表层和深层土壤有机碳和总碳含量;黄土具有最高的表层和深层无机碳含量;平原总体介于黄土和山地之间。研究区以中海拔地区为主,高海拔地区具有极高的有机碳含量,表层达到4.208%,深层1.604%。
表2 研究区不同地形地貌有机碳、无机碳和总碳含量
Table 2
| 地形 地貌 | 样品数 | 表层土壤含量/% | 深层土壤含量/% | ||||
|---|---|---|---|---|---|---|---|
| 无机碳 | 有机碳 | 总碳 | 无机碳 | 有机碳 | 总碳 | ||
| 黄土 | 4628 | 1.551 | 0.745 | 2.296 | 1.637 | 0.342 | 1.979 |
| 山地 | 2534 | 1.298 | 1.884 | 3.182 | 1.231 | 0.782 | 2.013 |
| 平原 | 2859 | 1.262 | 0.959 | 2.222 | 1.348 | 0.352 | 1.700 |
| 高海拔 | 405 | 1.159 | 4.208 | 5.367 | 0.942 | 1.604 | 2.546 |
| 中海拔 | 4703 | 1.299 | 0.634 | 1.932 | 1.338 | 0.266 | 1.604 |
| 低海拔 | 1420 | 1.211 | 0.848 | 2.059 | 1.515 | 0.269 | 1.784 |
3 讨论
3.1 无机碳含量影响因素
黄土高原是东亚季风的产物,由冬季风搬运上风向西北干旱区的粉尘物质堆积形成[30],同时受夏季风挟带的降雨改造[31];黄土高原土壤类型以黄绵土为主,初始粉尘中含有大量被风力搬运而来的碳酸盐矿物,土壤中无机碳含量主要受原始粉尘中碳酸盐输入通量和后期成壤改造作用影响。青海湟水谷地、甘肃陇中、陕西北部和宁夏南部黄土高原等地区降雨量低,植被稀疏,风化作用较弱,无机碳保存较好,因此表、深层无机碳含量均比较高。毛乌素沙地是我国面积最大的沙地[32],以固定、半固定沙丘为主,物质主要来自近源鄂尔多斯高原基岩风化产生的碎屑物质,和黄河上游物质不存在明显的物源联系[33],以中沙和细沙为主,累计占比介于81.0%~95.2%,基本不含黏土[34],因此区内具有极低的无机碳含量。学者认为流经青藏高原东北缘的黄河将大量碎屑物质搬运到银川盆地[33],因此盆地内沿黄河两岸具有比较高的表层无机碳含量。关中盆地受长期的农业活动灌溉影响,良好的土壤水分条件和密集的植物根系有利于碳酸氢盐的形成,从而加速了碳酸盐的溶解,特别是在雨季,表层无机碳受到较强的风化淋滤作用,使其遭受强烈的淋溶而离开表层土壤, 其中一部分在下伏黄土中淀积下来,使得深层无机碳含量高,尤其是渭河上游和秦岭山前地区水分条件更好,无机碳更容易通过地表和地下径流迁移,最终汇入黄河[35]。
3.2 有机碳含量影响因素
有机碳受到一系列自然因素和人为因素影响[36]。地形和土地利用方式是影响土壤有机碳库变化的重要因素[36⇓-38]。土壤有机碳与土壤质量和植物生产力有着内在的联系[39]。不同地形地貌中的山地和不同土地利用类型中森林分别具有最高的表层、深层土壤有机碳含量,表层有机碳高值区主要分布在祁连山一带山地区,表层和深层土壤有机碳含量分别达到1.884%和0.782%,是黄土和平原地区的2倍左右,该区海拔相对高,气温相对低,控制着植物残留物的碳输入和输出之间的平衡[40],抑制了有机碳的分解[41],土地利用类型多为天然森林和草地,具有高覆盖度和丰富根系,为土壤提供了大量的腐殖质和分泌物,且人为扰动小,使得有机碳累积。黄土地貌中表层和深层有机碳含量仅为0.745%和0.342%,黄土高原土壤侵蚀严重,有利于有机碳的去除,尤其是斜穿黄土高原中部的年降雨量400~500 mm的地区[42]。毛乌素沙地以风沙土为主,缺少可以为有机质提供物理保护的粉砂和黏土[43-44],有利于土壤向大气碳流失[36],风沙土具有所有土壤类型中最低的表、深层有机碳含量,植被以稀疏的荒漠草原为主,生物量低,有机碳输入量低,同时也因风蚀作用,有机碳以凋落物和细颗粒形式被去除[45]。银川盆地和关中盆地耕地区内,耕作过程会加速有机碳的分解和侵蚀,使土壤失去的有机碳进入大气中,从而增加大气二氧化碳[46]。耕地表层和深层有机碳含量分别仅为森林的54.9%和62.2%,与相关研究显示土地利用变化会导致30%~45%的损失基本一致[47-48],与不合理的耕作,破坏土壤大团聚体,降低土壤有机质稳定性,以及随后增加土壤温度和通气量,加速有机质的矿化[49]有关,也与耕地在收获过程中去除植物残留可以显著减少有机碳的输入有关[45]。
4 结论
1)研究区表层和深层碳含量具有基本类似的分布规律,无机碳含量高值区主要分布在青海湟水谷地、甘肃陇中、陕西北部和宁夏南部黄土高原等地区,有机碳高值区主要分布在祁连山一带。上下全层(0~2.0 m)土壤中累计求得总碳10 099.4 Mt,表层(0~0.2 m)1 224.8 Mt,上层(0~1.0 m)5 345.9 Mt,下层(1.0~2.0 m)4 753.5 Mt。
2)区内以黄绵土为主,风沙土具有最低的表、深层有机碳、无机碳和总碳含量。黑垆土和黄绵土具有最高的表层无机碳含量;黑毡土具有最高的表层有机碳含量;黑垆土具有最高的深层有机碳含量。黑毡土同时具有最高的表层和深层土壤总碳含量。
3)区内土地利用类型以草地和耕地为主,森林具有最高的表层和深层有机碳及表层总碳含量;草原具有最高的表层无机碳和总碳含量;耕地具有最高的深层无机碳含量;裸地具有最低的无机碳、有机碳和总碳含量。
4)区内黄土、山地和平原具有不同的碳含量,山地具有最高的表层和深层土壤有机碳和总碳含量;黄土具有最高的表层和深层无机碳含量;平原总体介于黄土和山地之间。高海拔地区具有极高的有机碳含量。
参考文献
How can global warming be traced to CO2?
[J].
Fluoride in the environment and its metabolism in humans
[J].
Evaluating ecosystem responses to rising atmospheric CO2 and global warming in a multi-factor world
[J].
Organic carbon stored in soils under different land uses and soil textures in southeast Argentinean Mesopotamia
[J].
Carbon dioxide flux as affected by tillage and irrigation in soil converted from perennial forages to annual crops
[J].Among greenhouse gases, carbon dioxide (CO(2)) is one of the most significant contributors to regional and global warming as well as climatic change. A field study was conducted to (i) determine the effect of soil characteristics resulting from changes in soil management practices on CO(2) flux from the soil surface to the atmosphere in transitional land from perennial forages to annual crops, and (ii) develop empirical relationships that predict CO(2) flux from soil temperature and soil water content. The CO(2) flux, soil temperature (T(s)), volumetric soil water content (theta(v)) were measured every 1-2 weeks in no-till (NT) and conventional till (CT) malt barley and undisturbed soil grass-alfalfa (UGA) systems in a Lihen sandy loam soil (sandy, mixed, frigid Entic Haplustoll) under irrigated and non-irrigated conditions in western North Dakota. Soil air-filled porosity (epsilon) was calculated from total soil porosity and theta(v) measurements. Significant differences in CO(2) fluxes between land management practices (irrigation and tillage) were observed on some measurement dates. Higher CO(2) fluxes were detected in CT plots than in NT and UGA treatments immediately after rainfall or irrigation. Soil CO(2) fluxes increased with increasing soil moisture (R(2)=0.15, P<0.01) while an exponential relationship was found between CO(2) emission and T(s) (R(2)=0.59). Using a stepwise regression analysis procedure, a significant multiple regression equation was developed between CO(2) flux and theta(v), T(s) (CO(2) flux = e(-3.477+0.123T(s)+6.381theta)(v); R(2)=0.68, P <or= 0.01). Not surprisingly, soil temperature was a driving factor in the equation, which accounted for approximately 59% in variation of CO(2) flux. It was concluded that less intensive tillage, such as no-till or strip tillage, along with careful irrigation management will reduce soil CO(2) evolution from land being converted from perennial forages to annual crops.
Soil carbon storage controlled by interactions between geochemistry and climate
[J].
DOI:10.1038/NGEO2516
[本文引用: 1]

Doetterl, Sebastian; Boeckx, Pascal Univ Ghent, Isotope Biosci Lab, B-9000 Ghent, Belgium. Doetterl, Sebastian Univ Augsburg, Dept Geog, D-86159 Augsburg, Germany. Stevens, Antoine; Van Oost, Kristof Catholic Univ Louvain, George Lemaitre Ctr Earth & Climate Res, Earth & Life Inst, B-1348 Louvain, Belgium. Stevens, Antoine; Six, Johan ETH, Dept Environm Syst Sci, CH-8092 Zurich, Switzerland. Merckx, Roel Katholieke Univ Leuven, Dept Earth & Environm Sci, B-3001 Heverlee, Belgium. Casanova Pinto, Manuel Univ Chile, Dept Ingn & Suelos, Santiago 8820808, Chile. Casanova-Katny, Angelica Univ Santiago Chile, Fac Quim & Farm, Santiago 8820808, Chile. Munoz, Cristina; Zagal Venegas, Erick Univ Concepcion, Dept Ciencias Suelo & Recursos Nat, Chillan 3812120, Chile. Boudin, Mathieu Royal Inst Cultural Heritage, B-1000 Brussels, Belgium.
Soil organic carbon and total nitrogen pools in permafrost zones of the Qinghai-Tibetan Plateau
[J].
DOI:10.1038/s41598-018-22024-2
PMID:29483565
[本文引用: 1]
There are several publications related to the soil organic carbon (SOC) on the Qinghai-Tibetan Plateau (QTP). However, most of these reports were from different parts of the plateau with various sampling depth. Here, we present the results from a systematic sampling and analysis of 200 soil pits. Most of the pits were deeper than 2 m from an east-west transect across the plateau. The SOC and total nitrogen (TN) pools of the 148 x 10(4) km(2), the area of the permafrost zone, for the upper 2 m soils calculated from the vegetation map were estimated to be 17.07 Pg (interquartile range: 11.34-25.33 Pg) and 1.72 Pg (interquartile range: 1.08-2.06 Pg), respectively. We also predicted the distribution of land cover types in 2050 and 2070 using decision tree rules and climate scenarios, and then predicted SOC and TN pools of this region. The results suggested that the SOC and TN pools will decrease in the future. The results not only contribute to the carbon and nitrogen storage and stocks in the permafrost regions as a whole but most importantly, to our knowledge of the possible changes of C and N storage on the QTP in the future.
Impacts of land use and salinization on soil inorganic and organic carbon in the middle-lower Yellow River Delta
[J].
Estimate of organic carbon in world soils
[J].
Neoformation of pedogenic carbonates by irrigation and fertilization and their contribution to carbon sequestration in soil
[J].
Fertilization enhancing carbon sequestration as carbonate in arid cropland:Assessments of long-term experiments in northern China
[J].
多目标区域地球化学调查与土壤碳储量问题——以江苏、湖南、四川、吉林、内蒙古为例
[J].
Multi-purpose regional geochemical survey and soil carbon reserves problem:Examples of Jiangsu,Henan,Sichuan,Jilin Provinces and Innermongolia
[J].
安徽省土壤固碳潜力及有机碳汇 (源) 研究
[J].
Soil carbon sequestration potential and organic carbon sink/source in Anhui Province
[J].
松嫩平原农田土壤有机碳变化及固碳潜力估算
[J].
Temporal and spatial variations of organic carbon and evaluation of carbon sequestration potential in the agricultural topsoil of the Songnen Plain
[J].
Assessment of soil organic and carbonate carbon storage in China
[J].
中国陆地生态系统碳源/汇整合分析
[J].
Integration analysis of the carbon sources and sinks in terrestrial ecosystems,China
[J].
Distribution of soil inorganic carbon storage and its changes due to agricultural land use activity in China
[J].
黄土高原西段表层土壤有机碳储量及时空变化规律
[J].
Topsoil organic carbon storage and its spatial and tempora variation in the western Loess Plateau
[J].
青藏高原土壤碳储量及其影响因素研究进展
[J].青藏高原是全球变化的敏感区,也是泛第三极地区气候变化的启动区。青藏高原土壤碳作为生态系统碳库的重要组成部分,对生态系统碳循环过程具有非常重要的作用。目前,对青藏高原土壤碳储量的估算仍存在很大的不确定性。为此,本文综述了近30年来关于青藏高原土壤碳储量研究,比较不同研究的土壤碳储量估算结果,以固有因子和变化因子两类影响因素作为切入点,分析了土壤碳储量时空分异规律。从估算模型和方法看,CENTURY和TEM模型综合考虑了影响土壤碳储量的多种机理过程,结果可信度高于EVI、NDVI模型以及插值估算法。青藏高原草地土壤表层(0~20 cm)有机碳储量约10 Pg C(1 Pg=10<sup>15</sup> g)。高原冻土区土壤有机碳储量(0~200 cm)约16.5 Pg C,土壤无机碳储量(0~100 cm)约14 Pg C。青藏高原土壤碳储量沿东南向西北方向逐渐降低,而关于变化因子对青藏高原土壤碳储量的作用规律还没有一致的认识。此外,采样点选择、数据源选择、估算深度以及估算方法等影响了青藏高原土壤碳储量估算结果的精确性。未来青藏高原土壤碳储量研究应建立土壤碳储量估算标准来提高结果的可比性;同时增大采样区、采样量以及采样深度并保障采样周期的时间连贯性等,有效减少土壤碳储量估算不确定性。以期更好地理解和预测未来青藏高原生态系统对气候变化的响应。
A review of research on soil carbon storage and its influencing factors in the Tibetan Plateau
[J].The Tibetan Plateau is highly sensitive to global climate change, and is the controller for regional climate in the Pan-Third Pole region. On the Tibetan Plateau, soil carbon accounts for a high proportion of the ecosystem carbon and is extremely important for ecosystem carbon cycling. However, there are still plenty of uncertainties for current soil carbon storage estimation on the Tibetan Plateau, with different estimation methods also having great discrepancies. Here, we reviewed research progress on soil carbon storage on the Tibetan Plateau during the past 30 years, and compared the results of different studies. We also analyzed the spatial and temporal variation of soil carbon storage based on two kinds of influencing factors (inherent, such as geographical factor, soil property, vegetation type; and variable, such as climate change, human activities). In terms of estimation models and methods, the process models such as CENTURY and TEM, which consider multiple processes affecting soil carbon storage, had higher accuracy compared with the EVI and NDVI models, and interpolation estimation. Averaged across different studies, soil organic carbon storage in the top 20 cm of the alpine grasslands is about 10 Pg C (1 Pg=10<sup>15</sup> g), and that in the top 200 cm of the alpine permafrost is approximately 16.5 Pg C. Soil inorganic carbon storage in the top 100 cm of the alpine grassland is about 14 Pg C. The soil carbon storage on the Tibetan Plateau decreases gradually from southeast to northwest. The effects of variable factors on soil carbon storage varied greatly. The estimation accuracy of soil carbon storage is affected by sampling location, data source type, estimation method, and soil depth. Future studies of soil carbon storage on the Tibetan Plateau should pay attention to establishing a common standard for soil carbon storage estimation. Under the common standard, the comparability among different studies is boosted. Meanwhile, expanding sampling area and sample size, increasing sampling depth and maintaining the temporal coherence among each sampling period can efficiently abate uncertainty in soil carbon storage estimation on the Tibetan Plateau. With these improvements, our understanding on Tibetan Plateau ecosystem responses to climate change would be advanced and our prediction on its future status be more accurate.
Monitoring Earth's critical zone
[J].DOI:10.1126/science.1179117 PMID:19965414 [本文引用: 1]
土地利用方式和地形对半干旱区土壤有机碳含量的影响
[J].
Effects of land use type and terrain on soil organic carbon (SOC) content in semi-arid region
[J].
Assessing the soil erosion control service of ecosystems change in the Loess Plateau of China
[J].
Contribution analysis of the long-term changes in seasonal runoff on the Loess Plateau,China,using eight Budyko-based methods
[J].
The 30 m annual land cover dataset and its dynamics in China from 1990 to 2019
[J].
DOI:10.5194/essd-13-3907-2021
[本文引用: 1]
Land cover (LC) determines the energy exchange, water and carbon cycle between Earth's spheres. Accurate LC information is a fundamental parameter for the environment and climate studies. Considering that the LC in China has been altered dramatically with the economic development in the past few decades, sequential and fine-scale LC monitoring is in urgent need. However, currently, fine-resolution annual LC dataset produced by the observational images is generally unavailable for China due to the lack of sufficient training samples and computational capabilities. To deal with this issue, we produced the first Landsat-derived annual China land cover dataset (CLCD) on the Google Earth Engine (GEE) platform, which contains 30m annual LC and its dynamics in China from 1990 to 2019. We first collected the training samples by combining stable samples extracted from China's land-use/cover datasets (CLUDs) and visually interpreted samples from satellite time-series data, Google Earth and Google Maps. Using 335 709 Landsat images on the GEE, several temporal metrics were constructed and fed to the random forest classifier to obtain classification results. We then proposed a post-processing method incorporating spatial-temporal filtering and logical reasoning to further improve the spatial-temporal consistency of CLCD. Finally, the overall accuracy of CLCD reached 79.31% based on 5463 visually interpreted samples. A further assessment based on 5131 third-party test samples showed that the overall accuracy of CLCD outperforms that of MCD12Q1, ESACCI_LC, FROM_GLC and GlobeLand30. Besides, we intercompared the CLCD with several Landsat-derived thematic products, which exhibited good consistencies with the Global Forest Change, the Global Surface Water, and three impervious surface products. Based on the CLCD, the trends and patterns of China's LC changes during 1985 and 2019 were revealed, such as expansion of impervious surface (+148.71 %) and water (+18.39 %), decrease in cropland (-4.85 %) and grassland (-3.29 %), and increase in forest (+4.34 %). In general, CLCD reflected the rapid urbanization and a series of ecological projects (e.g. Gain for Green) in China and revealed the anthropogenic implications on LC under the condition of climate change, signifying its potential application in the global change research.
基于多目标区域地球化学调查的中国土壤碳储量计算方法研究
[J].土壤碳储量问题在碳循环和全球变化领域具有重要意义,长期以来这一基本参数的计算受到数据来源的制约。全国多目标区域地球化学调查采用双层网格化采样和分析,取得了大量高密度和高精度土壤地球化学数据,为土壤碳库的高精度计算提供了数据基础。文中重点探讨利用这些数据计算土壤碳储量的方法。首先提出针对多目标区域地球化学调查数据的“单位土壤碳量(USCA)”概念,用以代表调查数据基本面积单元(4 km2)的碳储量,并作为区域和全国尺度土壤碳储量计算的基本单位。在收集分析14个省市414条的土壤剖面数据的基础上,发现土壤有机碳(TOC)的垂直分布与无机碳和其他元素不同,存在指数分布规律,运用面积积分运算方法发现利用直线模型计算土壤有机碳库的误差(+20%~+100%)远大于指数模型的误差(-10%~+20%)。因此,文中建议 “有机碳单位土壤碳量(USCATOC)”需使用指数模型拟合后积分求算,而 “无机碳单位土壤碳量(USCATIC)”则使用直线模型, “全碳单位土壤碳量(USCATC)”采用两者加和计算。文中还分析了其他元素的垂直分布特征,并提出氮储量计算需采用与有机碳类似的方法,其他51种元素(氧化物)储量采用与无机碳类似的方案,按照直线模型计算单位土壤元素量和单位土壤氧化物量(USEA)。
Calculation techniques for soil carbon storage of China based on multi-purpose geochemical survey
[J].
Profile storage of organic/inorganic carbon in soil:From forest to desert
[J].
Soil inorganic carbon stock under different soil types and land uses on the Loess Plateau region of China
[J].
Widespread decreases in topsoil inorganic carbon stocks across China's grasslands during 1980s-2000s
[J].
Desertification control on soil inorganic and organic carbon accumulation in the topsoil of desert grassland in Ningxia,northwest China
[J].
中国的黄土与风尘堆积
[J].
Eolian process and dust mantle (Loess) in China
[J].
黄土与古季风
[J].
Loess and paleomonsoons
[J].
国家林业局令
[N].
Order of the state forestry administration
[N].
黄河碎屑物质和中国西北沙漠/沙地存在物源联系吗?
[J].
Are Detrital materials from the Yellow River associated with desert/sandy land provenances in Northwest China?
[J].
毛乌素沙地和库布齐沙漠风成沙粒度参数的空间变化及其成因
[J].
DOI:10.7522/j.issn.1000-694X.2020.00088
[本文引用: 1]
分析了毛乌素沙地东部、西部和库布齐沙漠现代风成沙样品的粒度组成。结果显示:毛乌素沙地东部和西部风成沙粒度特征具有显著差异,西部风成沙粒度较小、分选较好;库布齐沙漠风成沙粒度特征与毛乌素沙地西部相似;沙源碎屑物质的机械组成应是影响毛乌素沙地和库布齐沙漠风成沙粒度特征的主要因素;就地起沙是毛乌素沙地和库布齐沙漠风成沙的重要来源,且其贡献比例具有区域差异性;受复杂沙源和风力-河流混合搬运方式的影响,平均粒径(M<sub>z</sub>)和分选系数(σ)并没有呈现出显著的与盛行风向一致的空间变化规律。
Spatial variations of grain size parameters of dune sands in the Mu Us Sandy Land and Hobq Sand Sea,northern China and its potential causes
[J].
Natural vegetation restoration is more beneficial to soil surface organic and inorganic carbon sequestration than tree plantation on the Loess Plateau of China
[J].
Storage,pattern and driving factors of soil organic carbon in an ecologically fragile zone of northern China
[J].
Soil and soil organic carbon redistribution on the landscape
[J].
Soil carbon stocks and projected changes according to land use and management:A case study for Kenya
[J].
Changes in soil organic carbon,nitrogen,phosphorus,and bulk density after afforestation of the "Beijing-Tianjin Sandstorm Source Control" program in China
[J].
Soil carbon pools and world life zones
[J].
Carbon stocks in Swiss agricultural soils predicted by land-use,soil characteristics,and altitude
[J].
黄土高原降雨因素对土壤侵蚀的影响
[J].
Effects of rainfall factors on soil erosion in Loess Plateau
[J].
Texture and organic carbon relations described by a profile pedotransfer function for Brazilian Cerrado soils
[J].
Carbon concentrations and stocks in forest soils of Europe
[J].
Amount,distribution and driving factors of soil organic carbon and nitrogen in cropland and grassland soils of southeast Germany (Bavaria)
[J].
Tropical deforestation and atmospheric carbon dioxide
[J].
Changes in soil carbon inventories following cultivation of previously untilled soils
[J].
Global pattern of soil carbon losses due to the conversion of forests to agricultural land
[J].
Relationship of soil organic matter dynamics to physical protection and tillage
[J].
Factors controlling soil organic carbon and total nitrogen stocks following afforestation with Robinia pseudoacacia on cropland across China
[J].
The effects of afforestation on soil organic and inorganic carbon:A case study of the Loess Plateau of China
[J].
