

0 引言
大气降尘是依靠重力自然沉降于地表的空气颗粒物,是地球表层地气系统物质交换的一种形式,在生态系统的物质交换过程中具有重要作用[1⇓-3]。大气降尘也是环境空气中各类二次反应的载体[4-5],其污染对象包括表生环境的土壤、水体等介质以及动植物。大量的外来降尘输入会改变当地表层土壤原有的理化性质,进而影响生态环境系统[6-7];沉降于水体不断积累后会导致水体富营养化、有机物污染、水质恶化等[8-9];沉降于植物表面会影响其光合作用和正常生理功能,且重金属等有害物质被植物吸收后还会通过食物链影响人体健康[10-11]。此外,降尘中的重金属、有机污染物等也能通过接触、呼吸等途径被人类摄入,对人体健康产生危害[12⇓-14]。许多学者研究发现,大气降尘中元素含量与当地土壤背景值相比,呈现不同程度富集的情况较为普遍。如赵西强等[15]研究发现济南市Cd、Cr、Cu、Hg、Pb、Zn在大气降尘中富集程度较高,并计算了大气降尘对表层土壤重金属含量的贡献;栾慧君等[16]研究发现徐州北郊降尘中Pb、Cu、Cr、As、Cd均超过土壤背景值,分别达12.35、12.85、2.01、2.86、3.95倍;张夏等[17]对比了重庆主城区大气降尘中的Cd、Cr、Ni、Pb含量与重庆土壤背景值,比值分别为11.4、1.5、0.6、4.3。降尘中的重金属污染特征评价、来源解析等也广受关注,如杨新明等[18]采用地累积指数对济南市降尘的重金属进行了评价,并结合正定矩阵因子分析模型解析了其主要贡献源;Ma等[19]采用绝对主成分/多元线性回归模型对垃圾焚烧厂附近表层土壤重金属来源进行了识别,并分析了各污染源的贡献率;陈莹等[5]采用富集因子法、潜在生态风险指数法评价了西安市大气降尘重金属污染特征,并将其来源分为人为源、自然源和复合源3类。大气降尘已成为生态环境系统中重要的评价和研究对象。
目前国内外多数研究侧重于大气降尘中的重金属元素,而将硒同时列入环境元素进行评价和研究却极为少见。硒虽然是健康的微量元素,但人体摄入过多会导致急性硒中毒[20],同时其还是化石燃料燃烧的指示元素[21],对大气污染有一定的指示意义。另外,通过模拟计算达到污染限定值所需的最小年沉降通量,对比当前年沉降通量,可指导大气污染精准防控。本文利用山东省高密市2018年6月~2019年6月的大气降尘采集测试数据,选取Cu、Pb、Zn、Ni、Cr、Cd、As、Hg等8种重金属元素及Se作为主要环境元素,研究该区主要环境元素的年沉降通量及其对表生环境土壤的影响,模拟筛选污染风险较大的元素,同时采用地累积指数法开展污染评价,为改善大气污染防治和保护人体健康提供科学依据。
1 材料与方法
1.1 研究区概况
高密市隶属于山东省潍坊市,地处山东半岛腹地,地理极值坐标东经119°26' ~ 120°00',北纬36°08' ~ 36°41',面积1 525.7 km2,属暖温带半湿润季风气候,年均降水量689.1 mm,南部雨量偏大,一般为700 ~ 720 mm,北部偏小,为645 ~ 680 mm,年均蒸发量1 227.6 mm。支柱产业以纺织服装、机械电子、制鞋劳保、食品加工、化工建材等为主,对工业经济贡献率接近70%。
1.2 样品采集
研究区内共布设大气降尘样品30件。布设位置涵盖城镇区、主要公路、基本农田等环境类型,实际放置位置在保证全区基本均匀分布的前提下,按交通、村落情况进行了适当调整(图1)。采样器选择内径高30 cm、直径15 cm的圆筒形玻璃接尘缸,使用前,用10%(V/V)HCl浸泡24 h,再用纯水洗净,安装在高度1.5 m的固定支架上,支架放置在距地面10 ~ 15 m处的屋顶平台,以避免地面和平台扬尘的影响。
图1
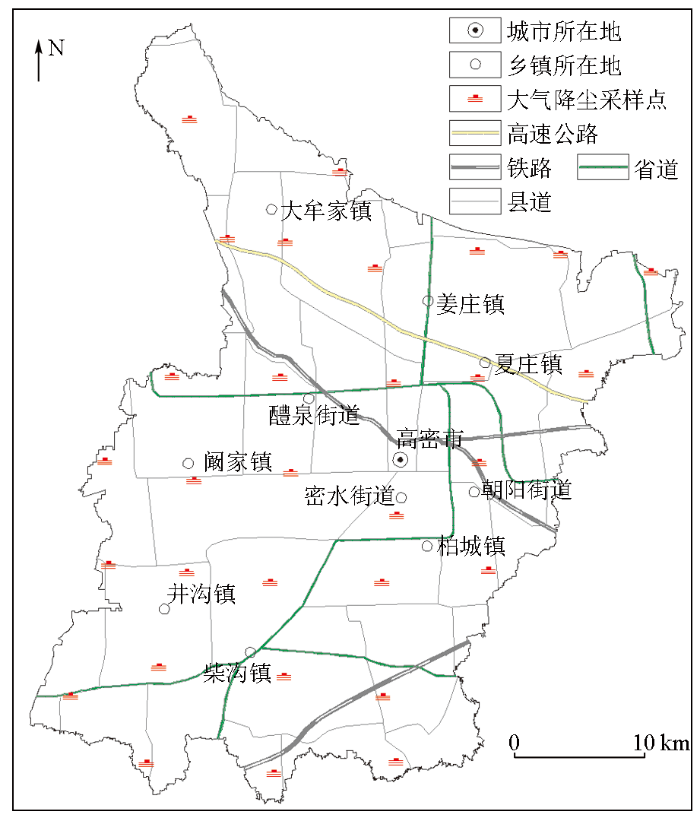
接尘缸放置时间为2018年6月~2019年6月,接收时间为12个月。在夏季多雨季节,根据缸内积水情况,为防水满溢出,及时更换新缸,采集的样品合并后测定。研究区内蒸发量显著大于降水量,30个点位大气降尘样品均为干沉降。
1.3 样品加工测试
样品的加工与测试工作在山东省地质矿产勘查开发局海岸带地质环境保护重点实验室完成。干沉降经烘干处理后称取总质量,而后分析指标Cu、Pb、Zn、Ni、Cr、Cd的试样经HNO3预消解24 h,微波加压消解,赶酸,定容,采用混合标准制备工作曲线,在2%的HNO3溶液中用iCAP RQ型电感耦合等离子体质谱仪测定;分析指标As、Se、Hg的试样用王水分解,50% HCl提取,在10%盐酸介质中,用硫脲作预还原剂,硼氢化钾作还原剂,As、Se采用PF53原子荧光光度计测定,Hg采用XGY-1011A型原子荧光光度计测定。所有样品的各项分析指标均有检出。使用国家标准物质(GBW07305a和GBW07407)控制样品的准确度和精密度,对标准物质进行12次分析,计算平均值与标准值的对数偏差ΔlgC,结果均<0.05,计算每一个标准物质的相对标准偏差RSD,结果均<8%。每件样品进行100%重复分析计算相对偏差RE,结果均<30%。本次样品分析满足相关规范质量要求。
1.4 分析方法与数据处理
1.4.1 大气降尘中主要环境元素的年沉降通量计算
采用下列公式计算大气降尘中主要环境元素的年沉降通量:
式中:Mij为某点位j大气降尘中主要环境元素i的年沉降通量,mg/m2;Cij为某点位j大气降尘中主要环境元素i的实测值,10-6;Wj为某点位j接尘缸中降尘的总质量,mg;S为接尘缸的底面积,m2;n为采样天数,d;N为计量天数,N=365 d。
1.4.2 降尘导致的表层土壤主要环境元素的年增量计算
为研究大气降尘对表层土壤主要环境元素含量的影响,假设大气降尘全部落在0~20 cm表层土壤中,且暂不考虑元素的输出效应,则大气降尘导致的表层土壤主要环境元素的年增量计算公式为
式中:ΔZij为某点位j单位质量土壤中主要环境元素i的年增量,10-9;Mij为某点位j大气降尘中主要环境元素i的年沉降通量,mg/m2;ρb为土壤容重,g/cm3,研究区内取1.28 g/cm3[22];h为0 ~ 20 cm表层土壤的厚度,取20 cm。
1.4.3 达到污染限定值所需的最小年沉降通量计算
以《土壤环境质量 农用地土壤污染风险管控标准(试行)》(GB 15618—2018)中的风险筛选值和《土地质量地球化学评价规范》(DZ/T 0295—2016)中的硒过剩下限值作为限定值,进一步研究大气降尘对表层土壤主要环境元素的影响,计算通过10年大气降尘,主要环境元素达到限定值所需要的最小年沉降通量,公式为
式中:Mi,min为主要环境元素i达到限定值的的最小年沉降通量,mg/(m2·a);Si为限定值,10-6;Bi为研究区土壤背景值,10-6;Y为年限时间节点,a。
1.4.4 地累积指数法评价
1.4.5 数据处理
采用IBM SPSS Statistics 22.0软件处理原始数据,包括单变量的描述性统计和双变量之间的Pearson相关性分析。采用Microsoft Excel 2010制作双变量的相关性散点图。利用MapGIS 6.7中的Kring泛克立格法网格化进行空间分布制图。
2 结果与分析
2.1 大气降尘量及其主要环境元素含量特征
研究区大气降尘中主要环境元素含量特征统计见表1。变异系数反映大气降尘中主要环境元素含量数据的离散程度,变异系数越大,空间差异性越大[27],主要环境元素变异性依次为Pb>Cu>Cr>Zn>Se>Cd=Hg>As>Ni。以0.16和0.36为界限值将变异系数划分为3个区间,分别表示弱变异、中等变异和强变异[28],其中Pb、Cu、Cr、Zn、Se属于强变异,离散程度高,空间分布差异性大,尤其以Pb变异系数1.68最高,其他元素属于中等变异。降尘中各元素含量平均值均高于研究区土壤背景值[29],达1.09 ~ 18.94倍,其中降尘中Cd、Se含量平均值显著高于土壤背景值,分别达12.20倍和18.94倍,而Cd属于重金属污染元素,应引起重视。
表1 大气降尘中主要环境元素统计参数
Table 1
| 元素 | 最大值 | 最小值 | 平均值 | 标准差 | 变异 系数 | 土壤背 景值[29] |
|---|---|---|---|---|---|---|
| Cu | 296.2 | 30.7 | 67.4 | 59.4 | 0.88 | 17.7 |
| Pb | 899.4 | 21.3 | 91.8 | 153.9 | 1.68 | 23.67 |
| Zn | 746.5 | 157.2 | 374.5 | 188.3 | 0.50 | 45.29 |
| Ni | 53.4 | 14.8 | 32.6 | 9.4 | 0.29 | 21.9 |
| Cr | 153.5 | 19.3 | 64.7 | 38.5 | 0.60 | 59.62 |
| Cd | 1.95 | 0.33 | 1.22 | 0.42 | 0.34 | 0.10 |
| As | 20.30 | 2.58 | 10.33 | 3.44 | 0.33 | 8.75 |
| Hg | 0.180 | 0.028 | 0.098 | 0.033 | 0.34 | 0.0266 |
| Se | 5.41 | 0.08 | 3.22 | 1.22 | 0.38 | 0.17 |
2.2 大气降尘主要环境元素的年沉降通量
按式(1)计算得出研究区大气降尘中主要环境元素的年沉降通量,如表2所示。元素含量与降尘量的乘积和年沉降通量呈严格的线性关系,因此元素的年沉降通量除了与降尘量有关外,还与元素含量有关。各元素的年沉降通量差异大,平均值在0.008 4~33.85 mg/(m2·a)之间,Hg最低,Zn最高,对比表1可知,各元素年沉降通量与含量的变异系数差异小,即各元素年沉降通量与含量的空间变异具有相似性,各元素年沉降通量空间分布如图2所示。主成分分析可以揭示元素间的相互关系和来源[30],通过降维,筛选出特征根大于1的3个主因子(表3),所包含的原始变量的信息为76.851%。主因子F1代表的变量组合为Ni、As、Zn、Cd、Cr、Hg,主因子F2代表的变量组合为Pb、Cu,主因子F3代表的变量为Se。从表4的相关性分析可知,Cu、Pb的年沉降通量呈显著正相关,相关系数达0.840(P<0.01),Zn、Ni、Cr、Cd、As、Hg的年沉降通量多呈现两两正相关,Se与其他元素的年沉降通量相关性不显著。相关性越显著则同源性越高,来源可能越一致[31-32],相关分析验证了因子分析结果。Cu、Pb的年沉降通量空间分布具有相似性,Cu主要与冶炼排放烟尘、燃煤、汽车尾气等有关[33],Pb与燃煤、含铅涂料、燃油、铸造等有关[34]。因此认为Cu、Pb的年沉降通量高度相关,是燃煤、机动车燃油导致的结果,阚家镇西部的高值区可能与双羊工业园有关,其他高值区与NW向密集的交通线分布相吻合。Zn、Ni、Cr、Cd、As、Hg的年沉降通量空间分布亦具有相似性,多数高值区集中分布在市区、街道、乡镇及交通线密集区,表明受人类活动的影响。Se的年沉降通量呈现东高西低的趋势,大气中的Se与煤炭燃烧密切相关,表明研究区煤炭燃烧量的区域性差异。另外,在南部工业经济相对欠发达区,也是主要环境元素年沉降通量低值区。
表2 主要环境元素年沉降通量
Table 2
| 元素 | 最大值 | 最小值 | 平均值 | 标准差 | 变异系数 |
|---|---|---|---|---|---|
| Cu | 26.66 | 2.04 | 5.67 | 4.77 | 0.84 |
| Pb | 91.23 | 2.44 | 8.08 | 15.76 | 1.95 |
| Zn | 100.05 | 10.49 | 33.85 | 21.11 | 0.62 |
| Ni | 5.41 | 1.63 | 2.78 | 1.00 | 0.36 |
| Cr | 14.98 | 1.86 | 5.67 | 3.55 | 0.63 |
| Cd | 0.15 | 0.04 | 0.10 | 0.02 | 0.20 |
| As | 3.20 | 0.30 | 0.91 | 0.54 | 0.59 |
| Hg | 0.0174 | 0.0045 | 0.0084 | 0.0035 | 0.42 |
| Se | 0.44 | 0.00 | 0.27 | 0.08 | 0.30 |
表3 主因子旋转载荷
Table 3
| 元素 | 主因子 | ||
|---|---|---|---|
| F1 | F2 | F3 | |
| Ni | 0.919 | 0.072 | 0.168 |
| As | 0.877 | 0.054 | -0.193 |
| Zn | 0.760 | -0.019 | 0.139 |
| Cd | 0.749 | -0.028 | 0.164 |
| Cr | 0.705 | -0.012 | 0.285 |
| Hg | 0.627 | 0.471 | 0.199 |
| Pb | -0.097 | 0.956 | 0.157 |
| Cu | 0.093 | 0.935 | -0.148 |
| Se | 0.225 | 0.031 | 0.952 |
| 特征根 | 3.709 | 2.021 | 1.187 |
| 方差/% | 41.210 | 22.457 | 13.184 |
| 贡献率/% | 41.210 | 63.667 | 76.851 |
表4 主要环境元素年沉降通量相关性分析
Table 4
| 元素 | Cu | Pb | Zn | Ni | Cr | Cd | As | Hg | Se |
|---|---|---|---|---|---|---|---|---|---|
| Cu | 1 | ||||||||
| Pb | 0.840** | 1 | |||||||
| Zn | 0.087 | -0.063 | 1 | ||||||
| Ni | 0.100 | 0.014 | 0.641** | 1 | |||||
| Cr | 0.021 | -0.001 | 0.427* | 0.720** | 1 | ||||
| Cd | 0.108 | -0.103 | 0.629** | 0.652** | 0.387* | 1 | |||
| As | 0.114 | -0.053 | 0.528** | 0.724** | 0.548** | 0.531** | 1 | ||
| Hg | 0.342 | 0.360 | 0.410* | 0.672** | 0.404* | 0.286 | 0.577** | 1 | |
| Se | -0.079 | 0.160 | 0.300 | 0.328 | 0.356 | 0.333 | 0.078 | 0.340 | 1 |
注:“**”表示相关性在0.01显著;“*”表示相关性在0.05显著。
图2
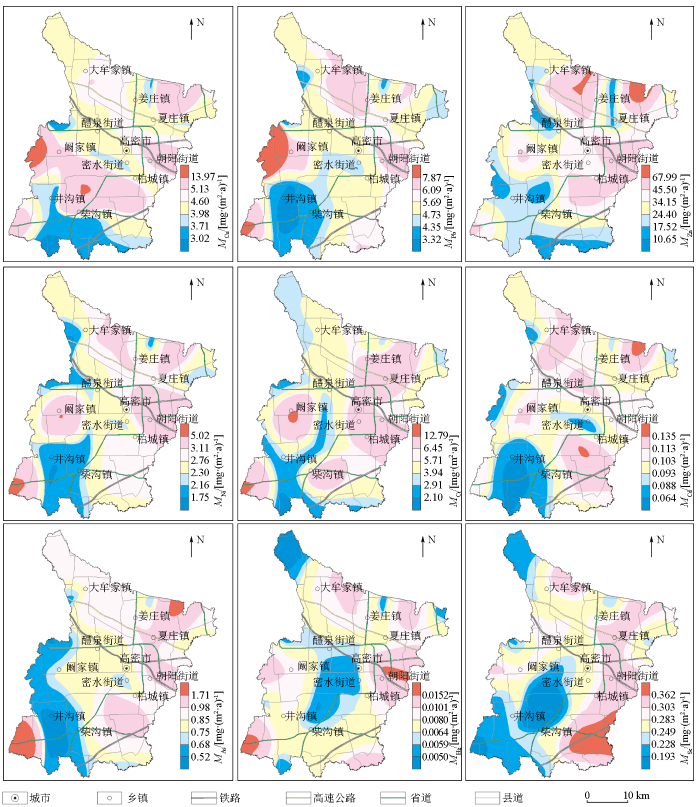
图2
主要环境元素年沉降通量空间分布
Fig.2
Spatial distribution of annual sedimentation fluxes for main environmental elements
2.3 大气降尘对表层土壤主要环境元素的影响
在不考虑元素输出效应的情况下,按式(2)计算得出研究区大气降尘导致的表层土壤主要环境元素的年增量参数,如表5所示。Zn的年增量最大,为132.21 μg/(kg·a),其次为Pb、Cr和Cu,分别为31.55 μg/(kg·a)、22.15 μg/(kg·a)和22.15 μg/(kg·a),Hg的年增量最小,为0.032 9 μg/(kg·a),与济南市大气降尘导致的表层土壤元素年增量排序基本一致,但年增量显著小于济南市[15],在一定程度上反映了传统工业的发展程度。各元素年均增长速率均较小,仅占当前表层土壤背景值的0.04%~0.61%,因此在日积月累的土壤发育过程中,大气降尘只是土壤主要环境元素的一个输入端元。
表5 大气降尘导致的表层土壤主要环境元素年增量
Table 5
| 元素 | 最大值 | 最小值 | 平均值 | 标准差 | 变异 系数 | 年均增长 速率/% |
|---|---|---|---|---|---|---|
| Cu | 104.13 | 7.98 | 22.15 | 18.63 | 0.84 | 0.13 |
| Pb | 356.39 | 9.52 | 31.55 | 61.56 | 1.95 | 0.13 |
| Zn | 390.81 | 40.96 | 132.21 | 82.46 | 0.62 | 0.29 |
| Ni | 21.15 | 6.38 | 10.87 | 3.90 | 0.36 | 0.05 |
| Cr | 58.53 | 7.27 | 22.15 | 13.87 | 0.63 | 0.04 |
| Cd | 0.57 | 0.15 | 0.39 | 0.09 | 0.23 | 0.39 |
| As | 12.52 | 1.15 | 3.57 | 2.09 | 0.59 | 0.04 |
| Hg | 0.0678 | 0.0175 | 0.0329 | 0.0137 | 0.42 | 0.12 |
| Se | 1.74 | 0.02 | 1.04 | 0.30 | 0.29 | 0.61 |
表6 达到限定值所需的最小年沉降通量及其与当前年沉降通量的对比
Table 6
| 元素 | 土壤背景值 | 限定值 | 当前年沉 降通量 | 所需最小年沉 降通量(10年) |
|---|---|---|---|---|
| 10-6 | 10-6 | mg·(m2·a)-1 | mg·(m2·a)-1 | |
| Cu | 17.7 | 50.0 | 5.67 | 827.0 |
| Pb | 23.67 | 70.00 | 8.08 | 1186.00 |
| Zn | 45.29 | 200.00 | 33.85 | 3961.00 |
| Ni | 21.9 | 60.0 | 2.78 | 975.0 |
| Cr | 59.62 | 150.00 | 5.67 | 2314.00 |
| Cd | 0.10 | 0.30 | 0.10 | 5.10 |
| As | 8.75 | 30.00 | 0.91 | 544.00 |
| Hg | 0.0266 | 1.3000 | 0.0084 | 32.6000 |
| Se | 0.17 | 3.00 | 0.266 | 72.40 |
2.4 大气降尘主要环境元素地累积指数污染评价
按式(4)计算大气降尘主要环境元素的地累积指数,由图3可见,污染程度依次为Se>Cd>Zn>Hg>Cu>Pb>Ni>As>Cr。Ni、As、Cr的Igeo中位数均小于0,最大值均小于1,表现为无污染至轻度污染,说明这3种元素受到人为污染影响较小。其他元素从空间分布看(图4),Se的偏极度污染区主要沿交通干线及人口密集区分布,区内以重度污染为主,表明与燃料的燃烧、工业生产有关;Cd、Zn的重度污染区沿交通干线及人口密集区分布的特点亦较为明显,表现为中度污染至重度污染,Cd主要与有色金属的冶炼和煅烧、市政焚烧、含镉废弃物的处理等有关,Zn主要与冶炼、废物焚烧、橡胶轮胎的磨损等有关[36-37];Hg、Cu、Pb以轻度污染至中度污染为主,存在点源状的污染源,Hg主要受医药、交通、燃煤等因素影响[38],Cu、Pb如前文所述,与燃煤密切相关。因此,为改善主要环境元素污染状况,应大力推广清洁能源,减少煤炭、燃油消耗量,同时寻找污染源,制定污染防控措施。
图3
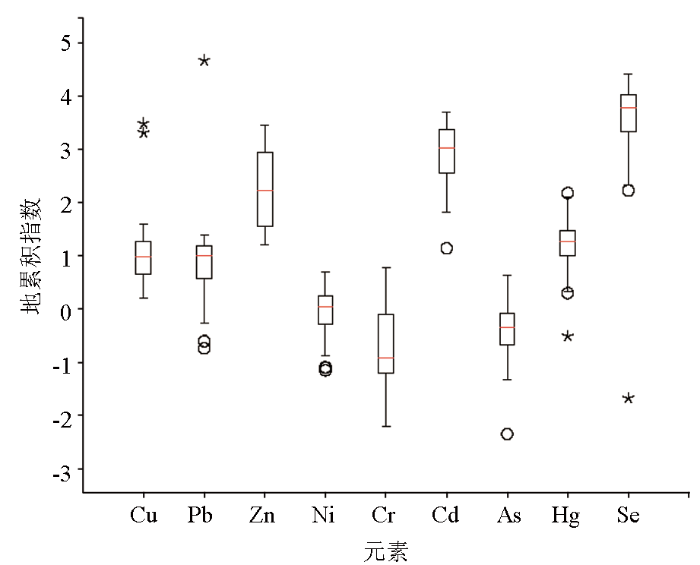
图3
主要环境元素地累积指数箱式图
Fig.3
Box diagram of geoaccumulation index for main enviromental elements
图4
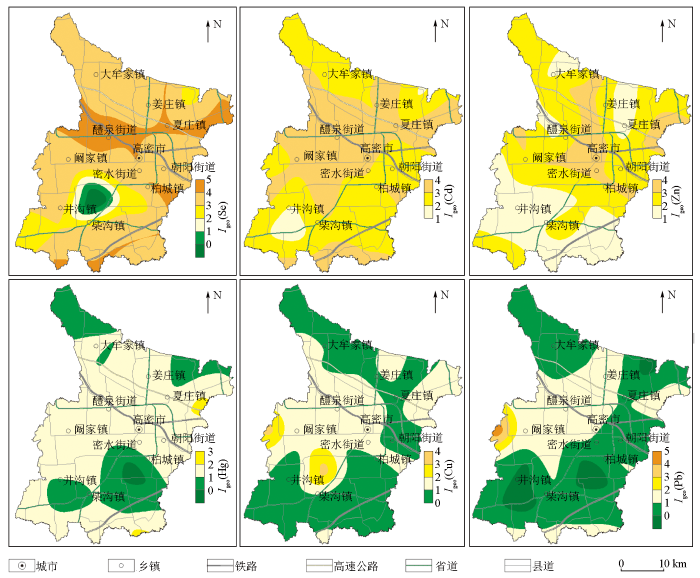
图4
主要环境元素地累积指数空间分布
Fig.4
Spatial distribution of geoaccumulation index for main enviroment elements
3 结论
1)研究区大气降尘中主要环境元素Cu、Pb、Zn、Ni、Cr、Cd、As、Hg、Se的平均含量分别为67.4×10⁻⁶、91.8×10⁻⁶、374.5×10⁻⁶、32.6×10⁻⁶、64.7×10⁻⁶、1.22×10⁻⁶、10.33×10⁻⁶、0.098×10⁻⁶、3.22×10⁻⁶,分别是土壤背景值的3.81、3.88、8.27、1.49、1.09、12.20、1.18、3.68、18.94倍。
2)大气降尘中Zn、Ni、Cr、Cd、As、Hg的来源相似,划入主因子F1;Cu、Pb的来源相似,划入主因子F2;Se的年沉降通量呈现东高西低,作为单一变量划入主因子F3。
3)大气降尘是土壤主要环境元素的重要来源,各元素年增量平均值Hg最小,为0.032 9 μg/(kg·a),Zn最大,为132.21 μg/(kg·a);年均增长速率Cr、As最小,为0.04%,Se最大,为0.61%。多年后表层土壤中的Cd由于大气降尘的积累,相对于其他元素最接近限定值。
4)地累积指数法评价结果显示,大气降尘主要环境元素Ni、As、Cr表现为无污染至轻度污染;Se的偏极度污染区主要沿交通干线及人口密集区分布,其他地区以重度污染为主;Cd、Zn表现为中度污染至重度污染;Hg、Cu、Pb以轻度污染至中度污染为主,存在点源状污染。
参考文献
济南市大气降尘地球化学特征及污染端元研究
[J].
Geochemical characteristics and pollution sources identification of the atmospheric dust-fall in Jinan city
[J].
Influences of coal mines,metallurgical plants,urbanization and lithology on the elemental composition of street dust
[J].DOI:10.1007/s10653-018-0228-3 [本文引用: 1]
大气降尘研究进展及展望
[J].
Research progress and prospect of dustfall research
[J].
连云港市大气降尘时空分布特征
[J].
Temporal and spatial distribution characteristics of atmospheric dust fall in Lianyungang City
[J].
西安市大气降尘重金属污染特征与生态风险
[J].
Heavy metal pollution characteristics and ecological risk of dust fall in Xi'an City
[J].
Human health risk from soil heavy metal contamination under different land uses near Dabaoshan Mine,Southern China
[J].
基于粒度方法的大气降尘对浙江省新嵊盆地土壤的物源输入研究
[J].
Atmospheric dust input to soils in Xinsheng Basin,Zhejiang Province based on grain size analysis
[J].
大气沉降重金属污染特征及生态风险研究进展
[J].
Progress in research on heavy metals in atmospheric deposition:Pollution characteristics and ecological risk assessment
[J].
Size distribution and concentrations of heavy metals in atmospheric aerosols originating from industrial emissions as predicted by the HYSPLIT model
[J].DOI:10.1016/j.atmosenv.2013.02.013 URL [本文引用: 1]
降尘对乌鲁木齐市地产萝卜中Pb含量的影响
[J].
Effect of dustfall on Pb content in radish produced in Urumqi
[J].
上海市大气颗粒物生物毒性及二噁英呼吸暴露风险评价
[J].
Biotoxicity effects and respiratory risk assessment of PCDD/Fs exposured to atmospheric particulates in Shanghai
[J].
Geochemical and mineralogical characteristics of airborne particulate matter in relation to human health risk
[J].
DOI:10.3390/min10100866
URL
[本文引用: 1]

The main objective of this research was the determination of the geochemical and mineralogical properties of particulate matter: TSP (total suspended particles) and, especially PM1 (particles with aerodynamic diameter not greater than 1 µm) suspended in the air of a selected urban area in southern Poland. Identification of the emission sources of metals and metalloids bound in TSP and PM1 as well as the assessment of potential risk of urban ambient air to human health using hazard indices was an additional aim of this investigation. The daily TSP and PM1 quartz fiber filters collected during heating season were subjected to mass magnetic susceptibility (χ) measurements, SEM (Scanning Electron Microscopy) observations and geochemical analyses. Obtained results revealed that the concentration of TSP and PM1 well correlated with their mass-specific magnetic susceptibility. The good relationship between the PM concentration and χ suggests that magnetic susceptibility measurements can be a good proxy of low-level atmospheric dust pollution. The rank order of potentially toxic elements (PTE) based on average concentration was Ba > Zn > Al > Fe > Pb > Mn > Ti > Cu > Cr > Ni >As > Cd > V > Tl, both for TSP and PM1. PM1/TSP ratios for PTE concentrations and χ were around or slightly above unity, which indicated that PM1 was the main carrier of PTE (with the exception of cadmium, copper and lead) and technogenic magnetic particles. The non-carcinogenic and carcinogenic risks were confirmed by very high values of human health indices.
Heavy metals in street and house dust in Bahrain
[J].DOI:10.1007/BF00477063 URL [本文引用: 1]
利用原子荧光光谱—电感耦合等离子体质谱法研究济南市大气干湿沉降重金属含量及年沉降通量特征
[J].
Study on the characteristics of heavy metal contents and annual fluxes of atmospheric dry and wet deposition in Jinan City using AFS and ICP-MS
[J].
徐州北郊大气降尘重金属污染特征与风险评价
[J].
Characteristics and risk assessment of heavy metals from atmospheric deposition in northern suburban of Xuzhou
[J].
重庆主城大气降尘中重金属污染特征及评价
[J].
Pollution characteristics and assessment of heavy metals in atmospheric deposition in core urban areas,Chongqing
[J].
典型工业城市大气降尘中重金属分布特征及其来源解析——以济南市为例
[J].
Distribution characteristic and source apportionment of heavy metals in atmospheric dust in a typical industrial city—A case study of Jinan
[J].
Contamination source apportionment and health risk assessment of heavy metals in soil around municipal solid waste incinerator:A case study in North China
[J].
土壤硒的生物有效性研究
[J].
Studies on the bioavailability of soil selenium
[J].
富硒土地资源研究进展与评价方法
[J].
Research progress of selenium-enriched land resources and evaluation methods
[J].
中国土壤容重特征及其对区域碳贮量估算的意义
[J].
Evaluation of soil bulk density in Chinese terrestrial ecosystems for determination of soil carbon storage on a regional scale
[J].
A comprehensive analysis of heavy metals in urban road dust of Xi'an,China:Contamination,source apportionment and spatial distribution
[J].DOI:10.1016/j.scitotenv.2017.08.004 URL [本文引用: 1]
兰州市大气降尘重金属污染评价及健康风险评价
[J].
Pollution evaluation and health risk assessment of heavy metals from atmospheric deposition in Lanzhou
[J].
唐山市设施菜地土壤重金属累积与有效态含量的影响特征
[J].
Factors impact on accumulation and availability of heavy metals in greenhouse vegetable soil from Tangshan City
[J].
土壤重金属污染评价方法进展
[J].
Progress of assessment methods of heavy metal pollution in soil
[J].
天津郊区农田降雨径流重金属的污染特征及来源分析
[J].
Contamination characteristics and source analyses on heavy metals in farmland runoff of the Tianjin suburban areas
[J].
盐渍化灌区土壤盐分的时空变异特征及其与地下水埋深的关系
[J].
Spatio-temporal variability of soil salinity and its relationship with the depth to groundwater in salinization irrigation district
[J].DOI:10.5846/stxb URL [本文引用: 1]
高密市土壤地球化学背景值研究
[J].
Study on geochemical background value of soil in Gaomi city
[J].
基于不同参比值的土壤重金属潜在生态风险评价
[J].
Potential ecological risk assessment of soil heavy metals based on different reference ratios
[J].
济南市近地表大气降尘元素地球化学特征及污染评价
[J].
Geochemical characteristics and pollution assessment of near-surface atmospheric dust in Jinan
[J].
新疆东天山某铜矿区土壤重金属污染与生态风险评价
[J].
Soil heavy metal pollution and ecological risk assessment in a copper mining area in East Tianshan,Xinjiang
[J].
辽东湾北部河口区土壤重金属污染源识别及健康风险评价
[J].
Source identification and health risk assessment of soil heavy metal in the estuary of Northern Liaodong Bay,China
[J].
陕西省某工业园区春季大气降尘重金属污染特征及评价
[J].
Characteristics and assessment of heavy metal pollution in spring atmospheric dust of an industrial park in Shanxi Province
[J].
土壤镉污染现状及其治理措施研究进展
[J].
Advances in soil Cd pollution and solution measures
[J].
临沂市PM2.5和PM10中元素分布特征及来源解析
[J].
Distribution characteristics and source apportionment of elements bonded with PM2.5 and PM10 in Linyi
[J].DOI:10.1021/es0616175 URL [本文引用: 1]
海南岛社会经济发展对红树林表层土壤重金属污染的影响
[J].
Heavy metal contents of mangrove surface soils affected by the social and economic development in Hainan Island
[J].
烟台海岸带土壤重金属定量源解析及空间预测
[J].
DOI:10.11821/dlxb202103015
[本文引用: 1]
定量解析土壤重金属污染来源并绘制空间分布图是土壤重金属调查评价的核心,可为区域土壤环境管理和修复提供科学参考。以中国北方名优农产品生产基地烟台海岸带为研究区,系统开展表层土壤样品采集和重金属分析测试;利用正定矩阵因子分解定量解析土壤重金属的来源贡献;基于独立成分分析和序贯高斯模拟构建多元地统计模拟技术,实现土壤重金属的空间预测及潜在污染区域划定。结果表明:① 研究区表层土壤中 As、Co、Cr、Mn和Ni主要为自然来源,且空间分布受成土母质的控制;② 工业和交通排放是土壤中Cd、Pb和Zn的重要来源,三者在金、铜矿的尾矿区以及烟台市区呈现出污染热点;③ 土壤中Cu主要来自铜基杀菌剂和有机肥施用等农业活动,高值区主要分布在果园土壤;④ 土壤中Hg主要来源于煤炭燃烧和混汞法炼金所排放Hg的大气沉降,高值区主要分布在金矿以及龙口、蓬莱市区周边;⑤ Cu、Hg和Cd的潜在污染区域面积占研究区总面积的37.5%、14.3%和8.6%,应给予重点关注。
Source apportionment and spatial prediction of heavy metals in soils of Yantai coastal zone
[J].
DOI:10.11821/dlxb202103015
[本文引用: 1]
Soil security plays an important role in the sustainable agriculture. With the rapid economic development, the soil quality faces great human-related threats from the contamination, and it is essential to conduct the investigation of heavy metals in soils of the areas with intensive human activities. Source apportionment and spatial prediction are the key issues of the investigation of soil heavy metals pollution, which could provide scientific references for the regional soil pollution management and remediation. For this purpose, a total of 1067 samples were collected in surface soils of Yantai coastal zone, eastern China; and As, Cd, Co, Cr, Cu, Hg, Mn, Ni, Pb, and Zn concentrations were analyzed. Positive matrix factorization (PMF) was applied to estimate source apportionment of heavy metals. Multivariate independent simulation combining Independent Component Analysis (ICA) and Sequential Gaussian Simulation (SGS) were proposed to predict the spatial distributions of heavy metals, and local and spatial uncertainty analysis was used to identify the polluted areas. As, Co, Cr, Mn, and Ni originated from natural sources, with their spatial distributions consistent with parent materials. Cd, Cu, Hg, Pb, and Zn exhibited significant accumulation in soils, but the mean contents of these five heavy metals did not exceed the risk screening values for soil contamination of agricultural land. Industrial and traffic emissions contributed 58.3%, 40.3%, and 35.8% of Cd, Pb, and Zn concentrations, respectively; and these three heavy metals presented high values in gold and copper tailings as well as the urban district of Yantai. Cu mainly came from the application of bordeaux mixture and organic fertilizer, with its high-value hotspots associated with orchard soils. Hg originated from the atmosphere deposition originated from coal combustion and gold smelting by the mixed mercury method, and its high-value hotspots were related to the surrounding of gold mine as well as urban areas of Longkou and Penglai. The potential contaminated areas of Cu, Hg, and Cd accounted for 37.5%, 14.3%, and 8.6% of the total study area, respectively.
