

0 引言
1 理论
1.1 简正振型叠加法
式中:
1.2 瑞利波频散曲线
求解瑞利波频散方程时,同一个频率可能有多个解,即同一频率的瑞利波可以以不同相速度传播。因此,理论频散曲线不只有1条相速度曲线,而是有多条相速度曲线,称这些相速度曲线为多阶瑞利波频散曲线。在多阶瑞利波频散曲线中,具有最低相速度值的频散曲线称为基阶瑞利波频散曲线,具有较高相速度值的频散曲线称为高阶瑞利波频散曲线[11]。根据相速度的大小,高阶瑞利波频散曲线进一步细分为一阶波、二阶波等。
式中:
式中:
2 微动信号模拟
本文采用的微动信号模拟方法是先通过简正振型叠加法计算理论地震图,再由多个理论地震图合成微动信号。微动信号模拟涉及地层模型、阵列布置、震源分布、面波阶数等多个参数。
2.1 地层模型
选取3层结构的速度递增型地层模型,参数如表1所示。
表1 地层模型参数
Table 1
| 序号 | 层厚 度/m | 纵波速度/ (m·s-1) | 横波速度/ (m·s-1) | 密度/ (g·cm-3) |
|---|---|---|---|---|
| 1 | 10 | 1 300 | 200 | 1.9 |
| 2 | 50 | 1 800 | 500 | 2.2 |
| 3 | ∞ | 2 500 | 1 000 | 2.5 |
2.2 台阵布置
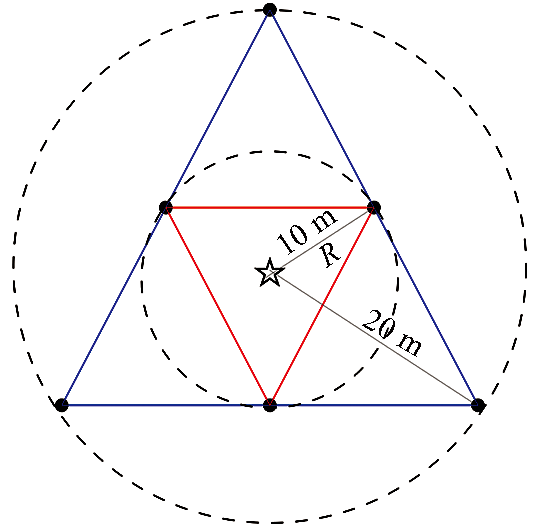
按图1所示布置观测台阵,采用微动勘探中常用的双重圆形阵列,共布置7个台站,观测半径分别为10 m和20 m。
图1
2.3 震源分布
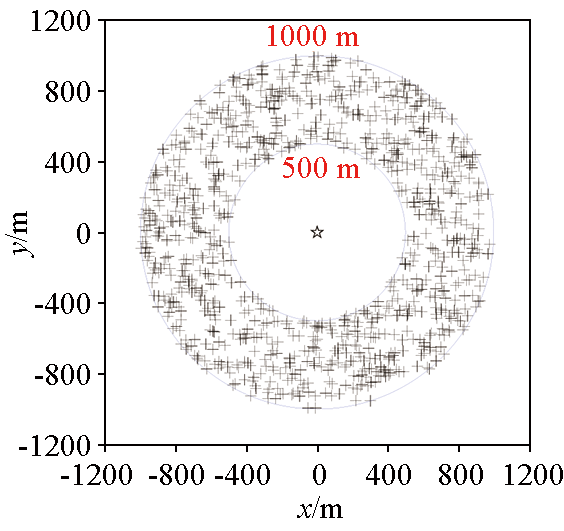
在距离台阵中心500~1 000 m的圆环范围内随机布置1 000个震源(如图2所示)。震源位于地表,方位和强度随机选取,在观测时长内随机出现。
图2
2.4 合成微动信号
每个震源生成1个地震记录,所有的地震记录按时间先后顺序合并成1个微动信号。合成时,根据需要选择不同的面波阶数。当地质模型存在高低速夹层时,高阶模式起重要作用,必须考虑高阶模式。与基阶瑞利波频散曲线对比时,只选择基阶模式,不考虑高阶模式。合成微动信号的时长为30 min,采样率为100 Hz。合成微动信号有3个分量,其中2个为水平分量,1个为垂直分量。空间自相关法主要使用垂直分量。图3为合成微动信号垂直分量的波形。
图3
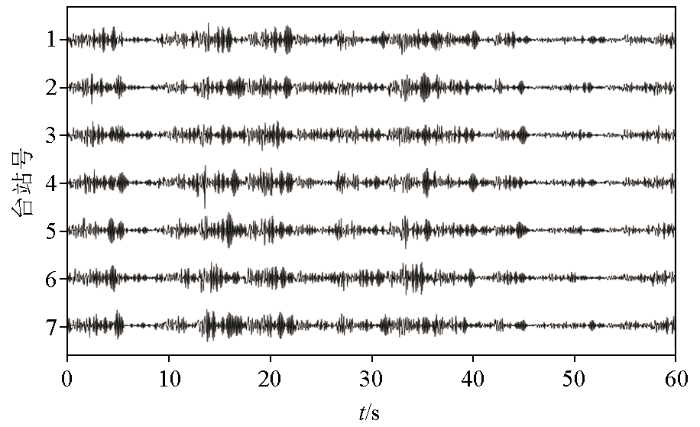
图3
合成微动信号垂直分量的波形
Fig.3
The vertical component wave of the synthetic microtremor signal
3 合成微动信号在微动勘探中的应用
微动勘探方法的关键技术是从微动信号中提取频散曲线。从微动信号中提取频散曲线方法有频率波数法(FK法)和空间自相关法(SPAC法)。本文采用空间自相关法计算频散曲线。
3.1 空间自相关系数
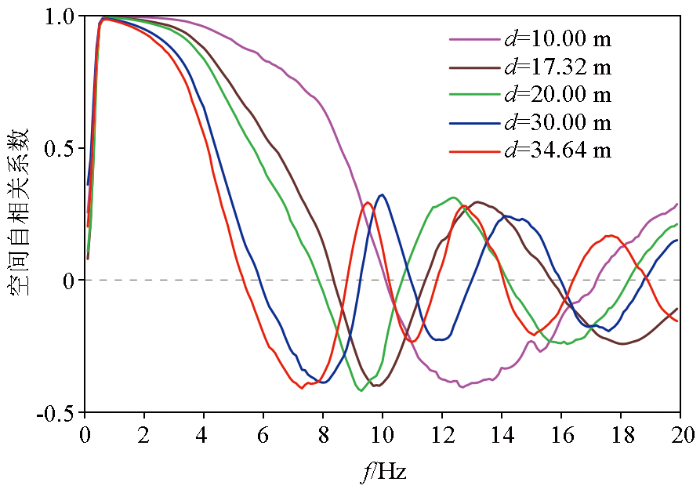
图4
3.2 频散曲线
采用扩展空间自相关法(ESPAC)[26]计算频散曲线。相速度选取范围为10~1 000 m/s,间隔为10 m/s。频率选取范围为0.5~20 Hz,间隔为0.1 Hz。
图5
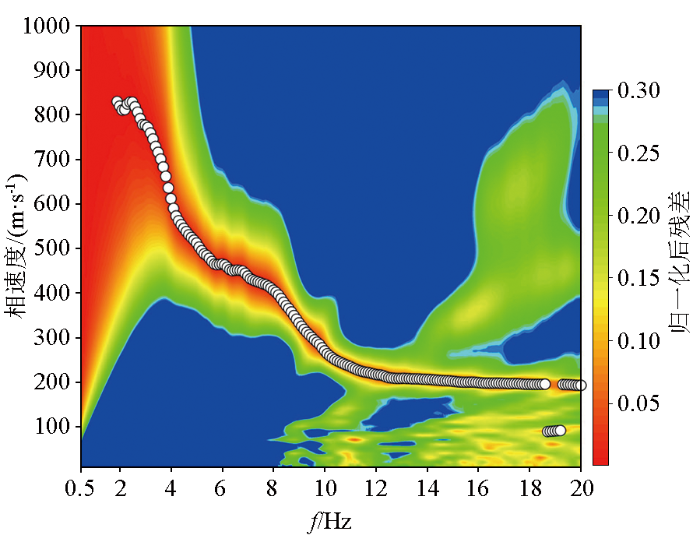
图5中不同频率范围的频谱特征有明显差异。频率在4~12 Hz时,频谱能量集中,容易拾取频散曲线。频率小于2 Hz时,频谱颜色几乎都为红色,结果有明显偏差,没有拾取频散曲线。频率在2~4 Hz范围,在较大相速度范围内,归一化后残差都小于0.05,频谱颜色都接近红色。对于这一范围的频谱,虽然颜色差异较小,但依然可以通过残差的大小提取频散曲线。频率大于12 Hz时,频谱能量分散,对频散曲线的拾取造成一定的干扰。
3.3 和理论频散曲线对比
使用表1所示的地层模型,采用Haskell传递矩阵法[18]计算理论频散曲线。在图6中,对比合成微动信号计算的频散曲线与理论频散曲线,发现两者在整体上具有较好的一致性。合成频散曲线和理论频散曲线具有相似特征,都可以划分出3个近似水平段,频率范围分别为2.5~3 Hz、5~7.5 Hz和大于10 Hz,对应的相速度范围分别为800~850 m/s、450~500 m/s和190~200 m/s。频散曲线的这种特征与地层模型的3层结构有关,和横波速度由深到浅分别为1 000 m/s、500 m/s和200 m/s有一一对应关系。通过对比还发现,在不同频率段合成频散曲线和理论频散曲线略有差异。在3.5~18 Hz部分几乎完全重合;小于3.5 Hz的低频部分略有差异;大于18 Hz的高频部分合成频散曲线不连续,出现跳变,和理论频散曲线有较大差异。导致这种差异的原因是台阵尺寸有限,无法准确计算高低频部分的合成频散曲线。
图6
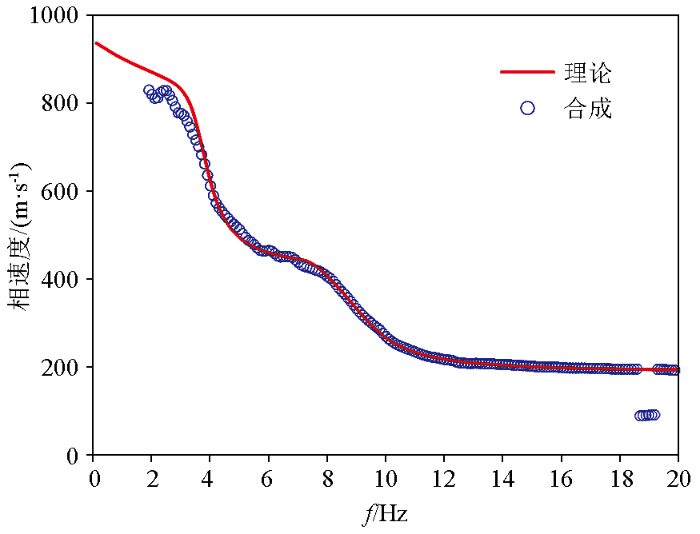
图6
理论频散曲线与合成频散曲线对比
Fig.6
Comparison of theoretical and synthetic dispersion curves
4 参数分析与讨论
微动信号模拟涉及许多参数,这些参数对微动勘探开展具有重要意义。本文对这些参数进行了数值试验,不同的参数设置得到不同的结果。试验结果分析如下。
4.1 震源距离
图7
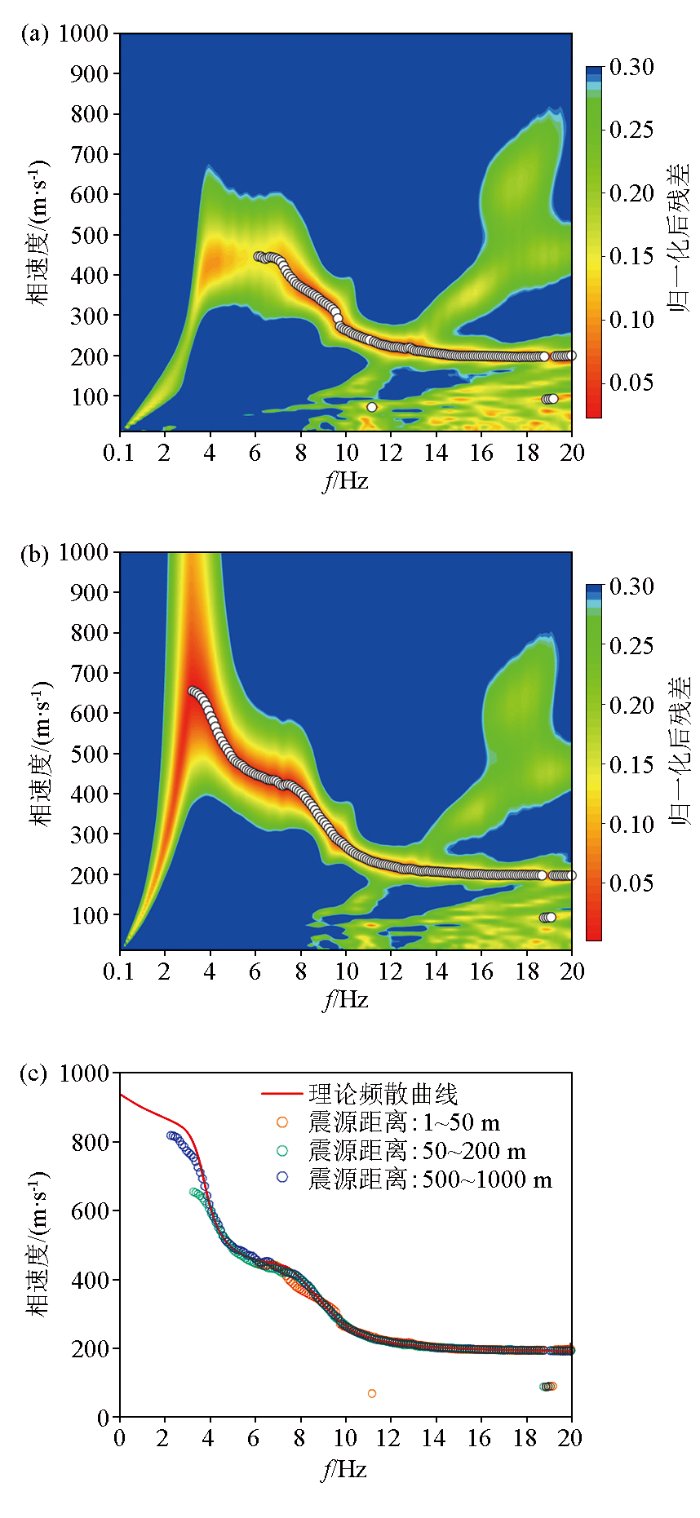
图7
使用不同震源距离计算的频散曲线
a—震源距离1~50 m;b—震源距离50~200 m;c—频散曲线对比
Fig.7
Dispersion curves with different sources distances
a—source distance in the range of 1 to 50 m;b—source distance in the range of 50 to 200 m;c—comparison of dispersion curves
4.2 台阵尺寸
图8
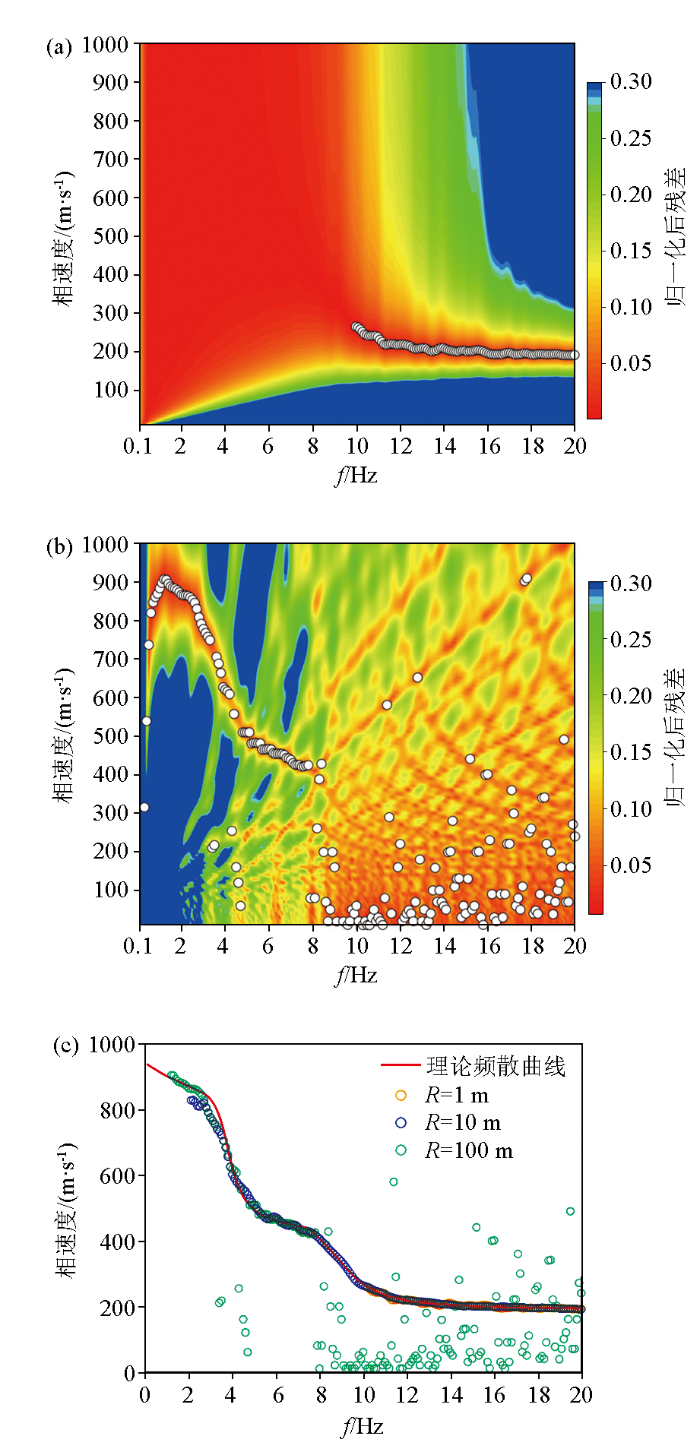
图8
使用不同台阵尺寸计算的频散曲线
a—台阵半径R=1 m;b—台阵半径R=100 m;c—频散曲线对比
Fig.8
Dispersion curves with different array sizes
a—R=1 m;b—R=100 m;c—comparison of dispersion curves
4.3 基阶和高阶
表2 含高速硬夹层的地层模型参数
Table 2
| 序号 | 层厚 度/m | 纵波速度/ (m·s-1) | 横波速度/ (m·s-1) | 密度/ (g·cm-3) |
|---|---|---|---|---|
| 1 | 10 | 1300 | 200 | 1.9 |
| 2 | 30 | 1800 | 500 | 2.2 |
| 3 | 20 | 2000 | 300 | 2.0 |
| 4 | ∞ | 2500 | 1000 | 2.5 |
图9
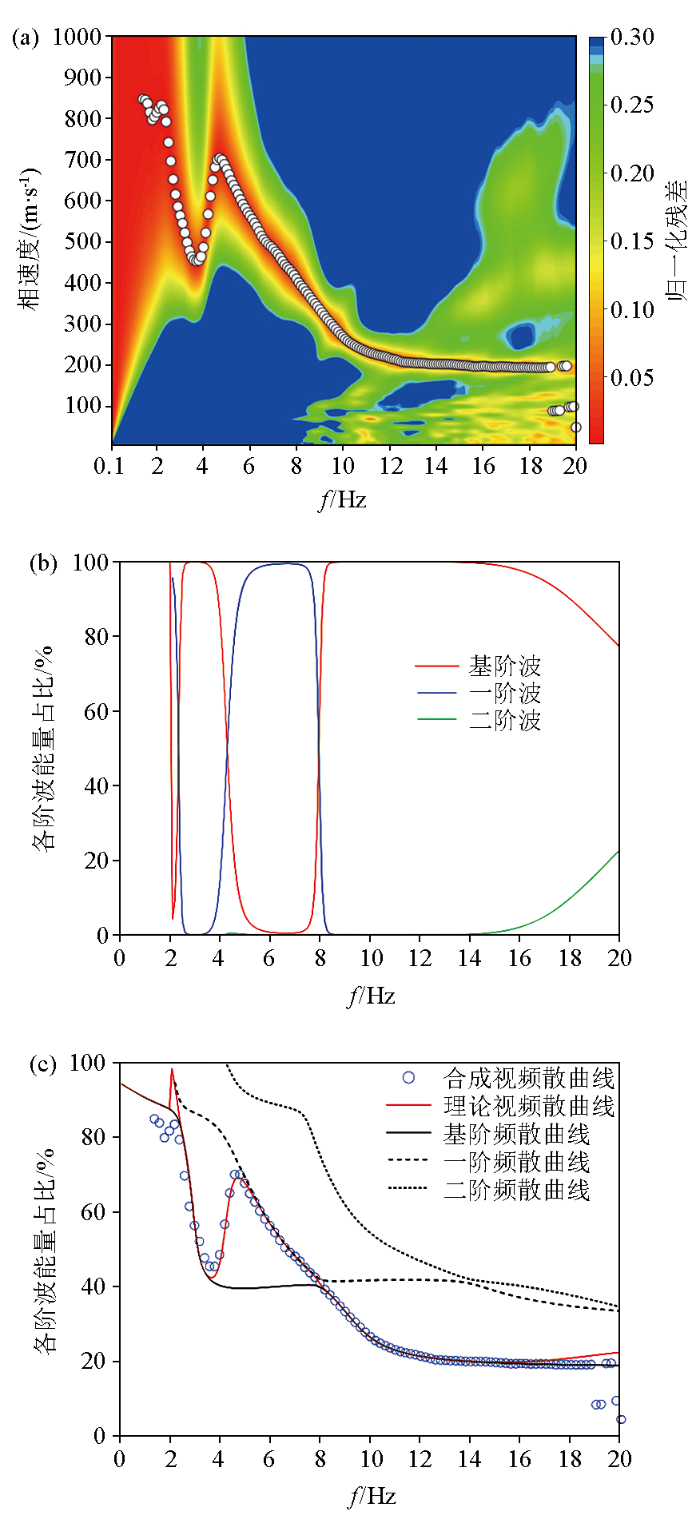
图9
含高速硬夹层的地层模型计算的频散曲线
a—合成微动信号的频散曲线;b—各阶瑞利波能量占比;c—频散曲线对比
Fig.9
Dispersion curves with high velocity interlayer
a—dispersion curve calculated by synthetic microtremor signal;b—power fractions to different modes of Rayleigh waves;c—comparison of dispersion curves
理论视频散曲线和合成频散曲线在高频处的差异可能与台阵尺寸有关,试验所用的台阵难以准确估算大于18 Hz部分的合成频散曲线,只有更小尺寸的台阵才能准确地估算高频部分的频散曲线。
4.4 频散曲线的有效最高频率
联合分析图5、6可知,虽然合成频散曲线在大于13 Hz部分频谱能量较分散(图5),但合成频散曲线与理论频散曲线在13~18 Hz范围仍较具有较好的一致性(图6)。这一结果表明频散曲线的有效最高频率至少为18 Hz。由图4可知,13 Hz是台站距离为10 m的空间自相关系数曲线的第一个极小值对应的频率,而台站距离10 m是台站距离组合中最小的一个。为了表述方便,将台站距离最小的空间自相关系数的第一个极小值点对应的频率,简称为“第一极小值频率”。对于本文合成的微动数据,因震源分布均匀,没有其他类型噪声,提取的频散曲线的有效最高频率突破了第一极小值频率的限制,达到了更高的18 Hz。对于实际采集的微动数据,由于台站数量有限、震源分布不均匀和存在非相关噪声等因素,提取的频散曲线有一定偏差,频散曲线的有效最高频率一般略小于第一极小值频率。采用小尺寸台阵,可以获得较高的第一极小值频率,从而提高频散曲线的有效最高频率。因此,对于微动波场较为均匀的安静场地,应用小尺寸台站往往能获得更高频的频散信息,有利于提高浅层分辨率。
5 结论
本文采用简正振型叠加法合成微动信号,应用空间自相关法计算合成频散曲线,并与理论频散曲线进行对比,发现两者具有较好的一致性。对微动信号模拟涉及的参数进行了数值试验,得到以下结论:
1)震源距离和台阵尺寸对结果有明显影响。模拟微动信号时应合理设置震源距离,实际观测时应根据勘探深度合理选择台阵尺寸。
2)在地层介质较复杂的情况下,特定频率范围的高阶瑞利波能量占主导地位,频散曲线呈现“之”字形,在这种情况下开展微动勘探应考虑高阶面波的影响。
3)在安静的观测场地,应用小尺寸台阵往往可以获得更高频的频散信息,有利于提高浅层分辨率。
参考文献
ESPAC-based 2D mini-array microtremor method and its application in urban rail transit construction planning
[J].DOI:10.1016/j.tust.2021.104070 URL [本文引用: 2]
二维微动剖面探测“孤石”:以深圳地铁7号线为例
[J].
Mapping spherically weathered "Boulders" using 2D microtremor profiling method:A case study along subway line 7 in Shenzhen
[J].
土石混合滑坡体微动探测:以衡阳拜殿乡滑坡体为例
[J].
Microtremor survey of soil-rock mixture landslides:An example of Baidian township,Heng yang City
[J].
微动勘探技术在城市地面沉降检测中的应用研究
[J].
Application of microtremor survey method in detection of urban land subsidence
[J].
综合利用多道瞬态面波和微动探测分析斜坡内部结构
[J].
Analysis of internal structure of slope by using multi-channel transient surface wave exploration and microtremor survey
[J].
不同台阵形式对微动探测结果的影响
[J].
Influence of different array type on the results of microtremor survey
[J].
微动多阶瑞雷波SPAC系数反演方法及应用研究
[J].
Microtremor survey method based on inversion of the SPAC coefficient of multi-mode Rayleigh waves and its application
[J].
Frequency-Bessel transform method for effective imaging of higher-mode Rayleigh dispersion curves from ambient seismic noise data
[J].
DOI:10.1029/2018JB016595
URL
[本文引用: 2]

It has been widely recognized that the cross‐correlation function of ambient seismic noise data recorded at two stations approximates to the part of Greens function between two stations. Therefore, the cross‐correlation function should include higher modes, aside from the fundamental mode. However, the problem of measuring or extracting overtones from ambient seismic noise data remains. In this paper, we propose the frequency‐Bessel transform method (F‐J method) for extracting the dispersion curves of higher modes from ambient seismic noise data. We then assess the validity, accuracy, and applicability of the F‐J method by conducting extensive numerical simulations and processing the observed ambient seismic noise data of the USArray. As demonstrated in this study, the F‐J method is a convenient, practical, and accurate method for extracting the dispersion curves of multimodes from ambient seismic noise data and therefore has significant potentiality in the field of ambient seismic noise tomography.
城市微动高阶面波在浅层勘探中的应用:以苏州河地区为例
[J].
Application of high-order surface waves in shallow exploration:An example of the Suzhou river,Shanghai
[J].
交错网格有限差分法模拟微动信号
[J].
Simulation of microtremor using staggered-grid finite difference method
[J].
微动中多模式面波频散曲线的映射式提取方法
[J].
Mapping extraction dispersion curves of multi-mode Rayleigh waves in microtremor
[J].
Computer programs in seismology:An evolving tool for instruction and research
[J].DOI:10.1785/0220110096 URL [本文引用: 1]
Excitation of the normal modes of the earth by earthquake sources
[J].
The calculation of the eigenfrequencies and eigenfunctions of the free oscillations of the Earth and the Sun
[J].
Synthetic seismograms by normal-mode summation:A new derivation and numerical examples
[J].DOI:10.1111/j.1365-246X.2010.04820.x URL [本文引用: 4]
The dispersion of surface waves on multilayered
[J].
DOI:10.1785/BSSA0430010017
URL
[本文引用: 2]
A matrix formalism developed by W. T. Thomson is used to obtain the phase velocity dispersion equations for elastic surface waves of Rayleigh and Love type on multilayered solid media. The method is used to compute phase and group velocities of Rayleigh waves for two assumed three-layer models and one two-layer model of the earth's crust in the continents. The computed group velocity curves are compared with published values of the group velocities at various frequencies of Rayleigh waves over continental paths. The scatter of the observed values is larger than the difference between the three computed curves. It is believed that not all of this scatter is due to observational errors, but probably represents a real horizontal heterogeneity of the continental crusts.
A matrix method for elastic wave problems
[J].
DOI:10.1785/BSSA0540010431
URL
[本文引用: 1]
The solution to problems of elastic wave propagation in multilayered media, in which each layer is homogeneous and where the ensemble of layers has physical properties that vary only with one coordinate, may be given as the quotient of products of matrices. In the case of SH waves, the matrices are of order two; in the case of P-SV waves the matrices are of order four. The individual matrix elements are themselves determinants of order two or four in the two cases. The solution is obtained by means of Laplace's development by minors.
Free-mode surface-wave computations
[J].DOI:10.1111/gji.1996.124.issue-3 URL [本文引用: 1]
Dispersion function computations for unlimited frequency values
[J].DOI:10.1111/j.1365-246X.1979.tb01011.x URL [本文引用: 1]
A systematic and efficient method of computing normal modes for multilayered half-space
[J].DOI:10.1111/gji.1993.115.issue-2 URL [本文引用: 1]
计算瑞利波频散曲线的快速矢量传递算法
[J].
Fast vector-transfer algorithm for computation of Rayleigh wave dispersion curves
[J].
Effects of multiple modes on Rayleigh wave dispersion characteristics
[J].DOI:10.1061/(ASCE)0733-9410(1992)118:10(1529) URL [本文引用: 1]
Surface waves in multilayered elastic media. I. Rayleigh and Love waves from buried sources in a multilayered elastic half-space
[J].
DOI:10.1785/BSSA0540020627
URL
[本文引用: 1]
A matrix formulation is used to derive integral expressions for the time transformed displacement fields produced by simple sources at any depth in a multilayered elastic isotropic solid half-space. The integrals are evaluated for their residue contribution to obtain surface wave displacements in the frequency domain. The solutions are then generalized to include the effect of a surface liquid layer. The theory includes the effect of layering and source depth for the following: (1) Rayleigh waves from an explosive source, (2) Rayleigh waves from a vertical point force, (3) Rayleigh and Love waves from a vertical strike slip fault model. The latter source also includes the effect of fault dimensions and rupture velocity. From these results we are able to show certain reciprocity relations for surface waves which had been previously proved for the total displacement field. The theory presented here lays the ground work for later papers in which theoretical seismograms are compared with observations in both the time and frequency domain.
