|
|
|
| Research and application of the velocity modeling method for the eastern margin of the Pre-Caspian Basin |
WANG Zhen1( ), JI Zhi-Feng1, ZHANG Yi-Qiong1, WANG Xue-Ke1, JIANG Li2, LIN Ya-Ping1, KONG Ling-Hong1, ZHANG Ming-Jun1 ), JI Zhi-Feng1, ZHANG Yi-Qiong1, WANG Xue-Ke1, JIANG Li2, LIN Ya-Ping1, KONG Ling-Hong1, ZHANG Ming-Jun1 |
1. Research Institute of Petroleum Exploration and Development,PetroChina,Beijing 100083,China
2. PST Service Corp.,Beijing 100101,China |
|
|
|
|
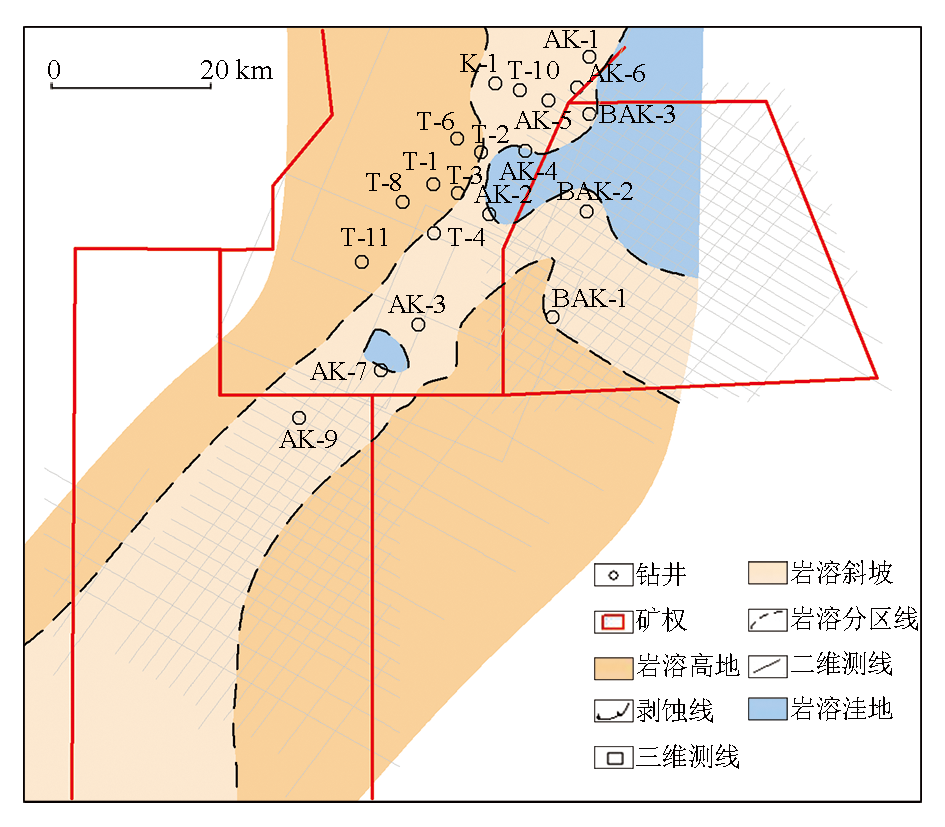
Abstract The low-amplitude structures on the top of the Carboniferous carbonate rocks in the Akzor area on the eastern margin of the Pre-Caspian Basin show considerable potential for oil and gas exploration.However,the complex distribution of overlying Lower Permian strata and significant changes in lateral velocities pose high challenges for the mapping of the Carboniferous low-amplitude structures.To achieve the rapid mapping of the structures in the study area,this study selected the frequency-division interval velocity inversion method to build the velocity model for the study area after comparing three methods for velocity modeling.The velocity model built in this study,solving the problem that the frequency-division interval velocity inversion is constrained by the lateral continuity of conventional interval velocity inversion methods,yielded more accurate velocity characterization of anomalies in the Lower Permian carbonate rocks.Moreover,compared to the collaborative velocity modeling method based on well-seismic velocity spectra and the conventional interval velocity inversion method constrained by log data,the frequency-division interval velocity inversion method effectively improved the depth-domain mapping accuracy of the underlying Carboniferous low-amplitude structures in the study area,boasting high performance.
|
|
Received: 17 April 2023
Published: 27 June 2024
|
|
|
|
|
|
|
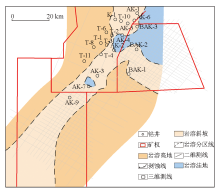
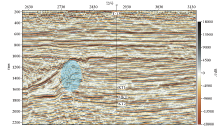
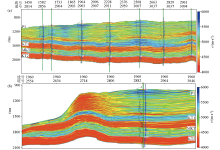
Top structure of the Carboniferous KT2 in the Akerl structural belt
|
|
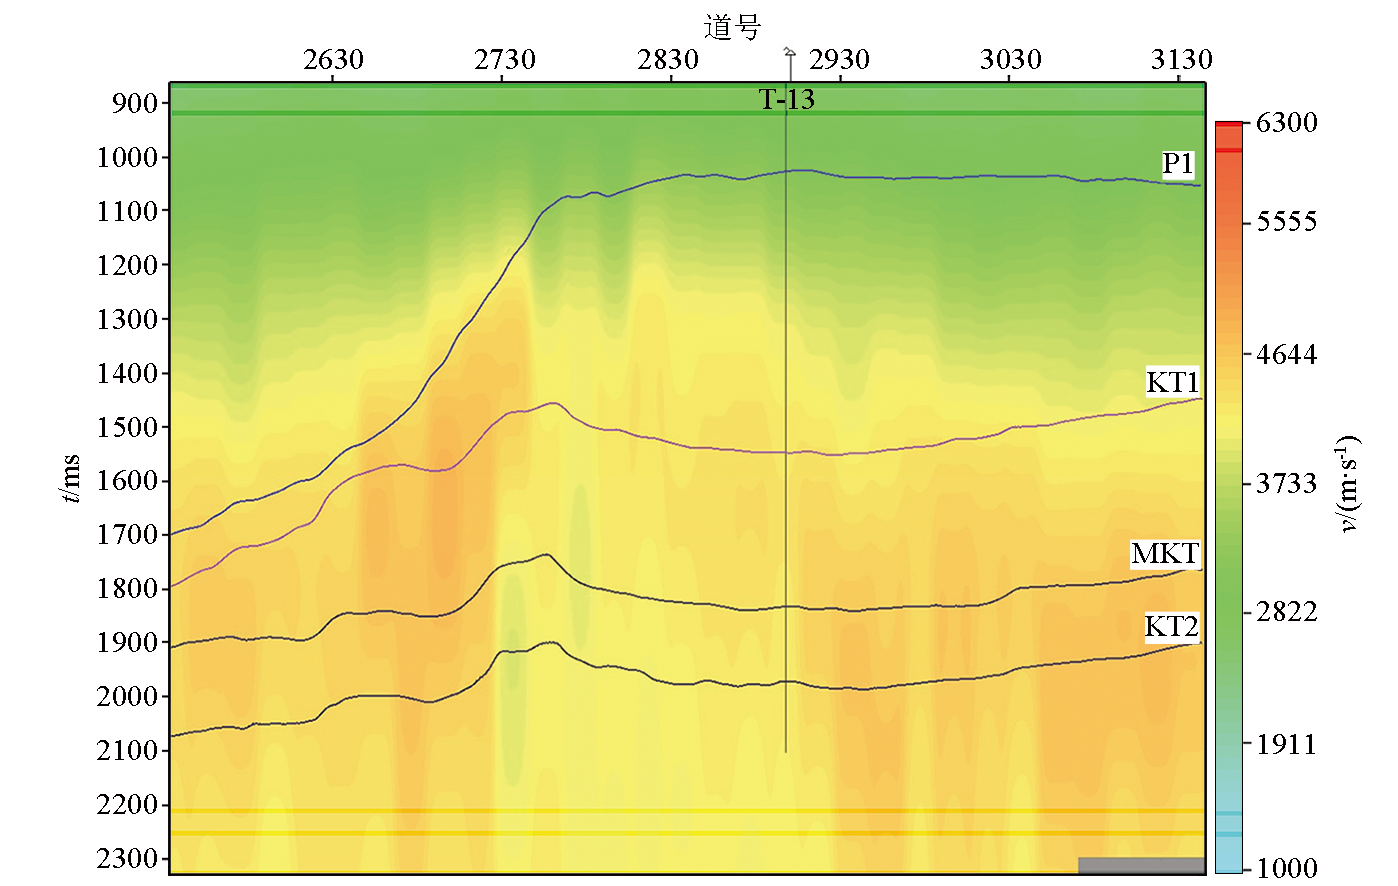
Near east-west seismic profile of well T-13 in the study area
|
|
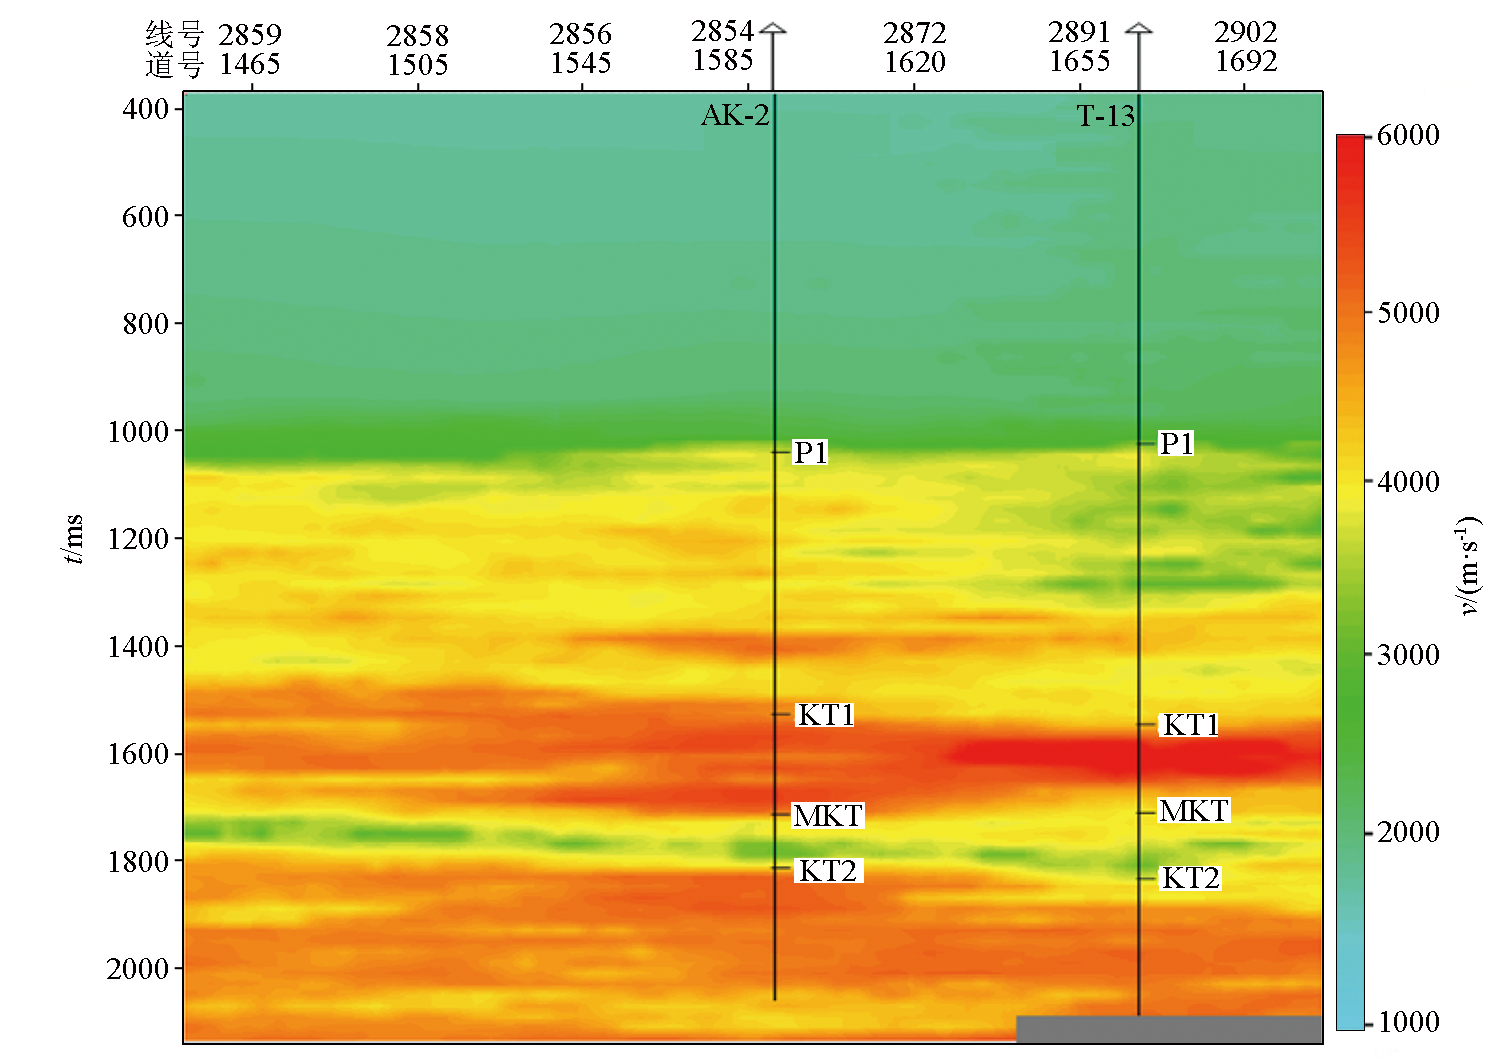
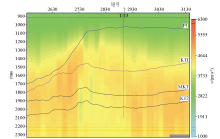
Near east-west velocity spectrum profile of well T-13 in the study area
|

|
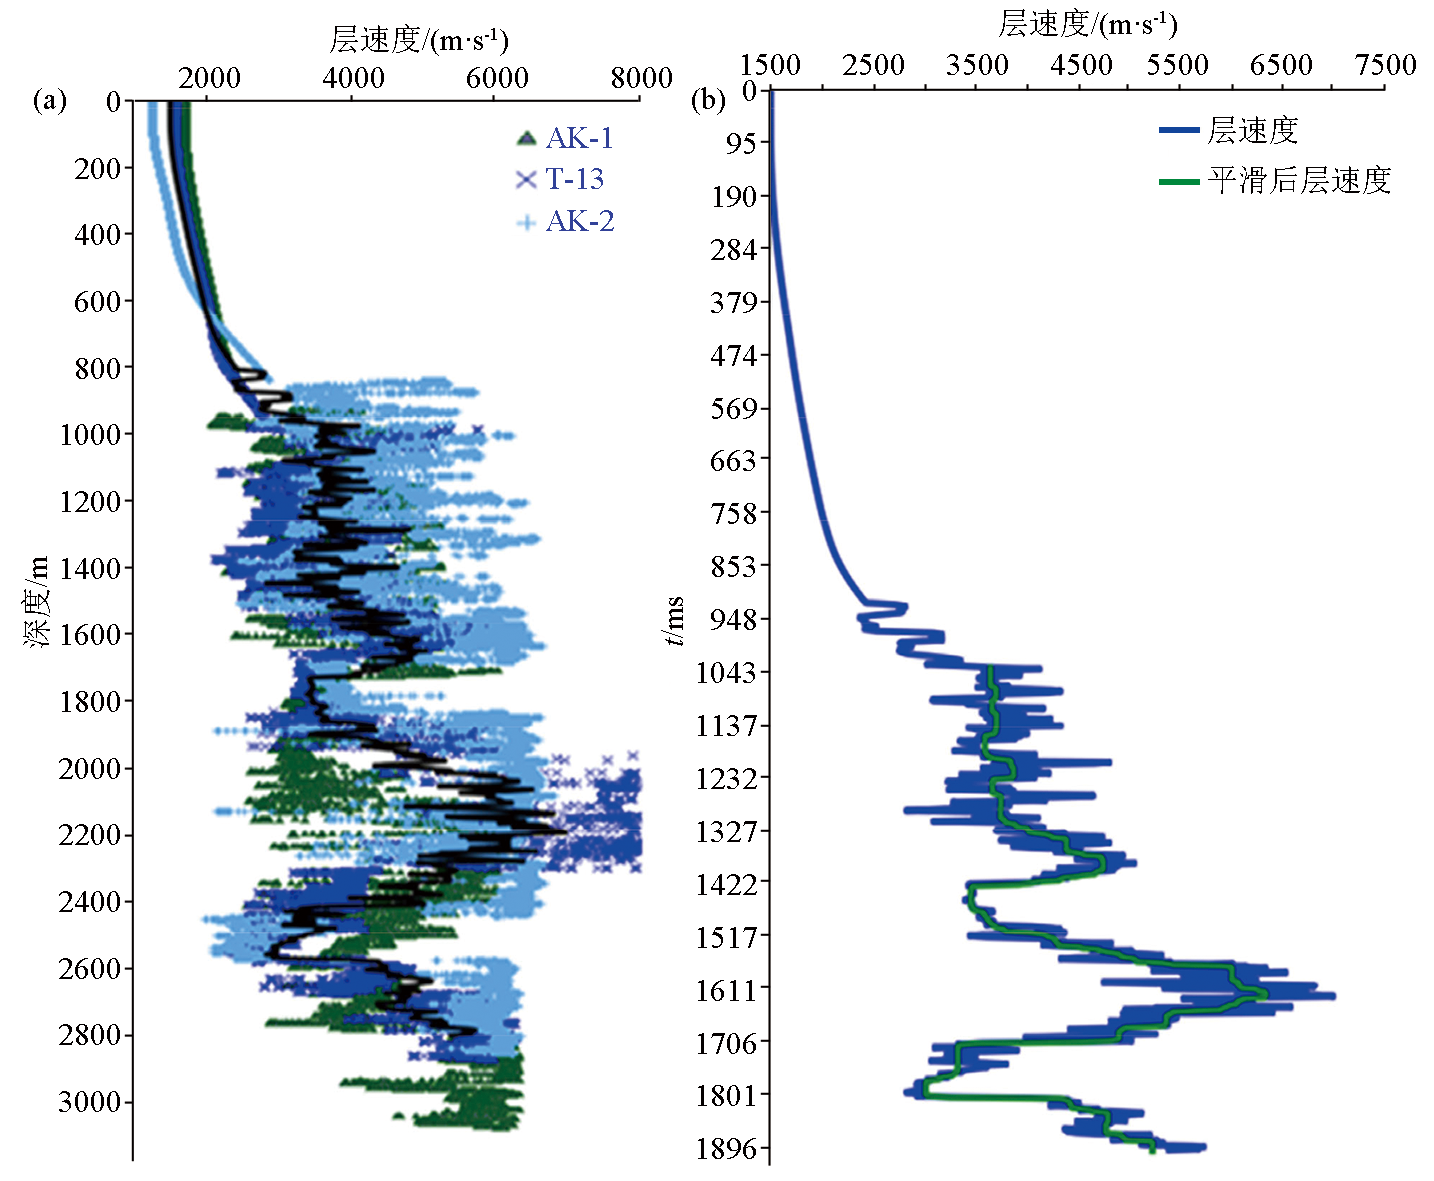
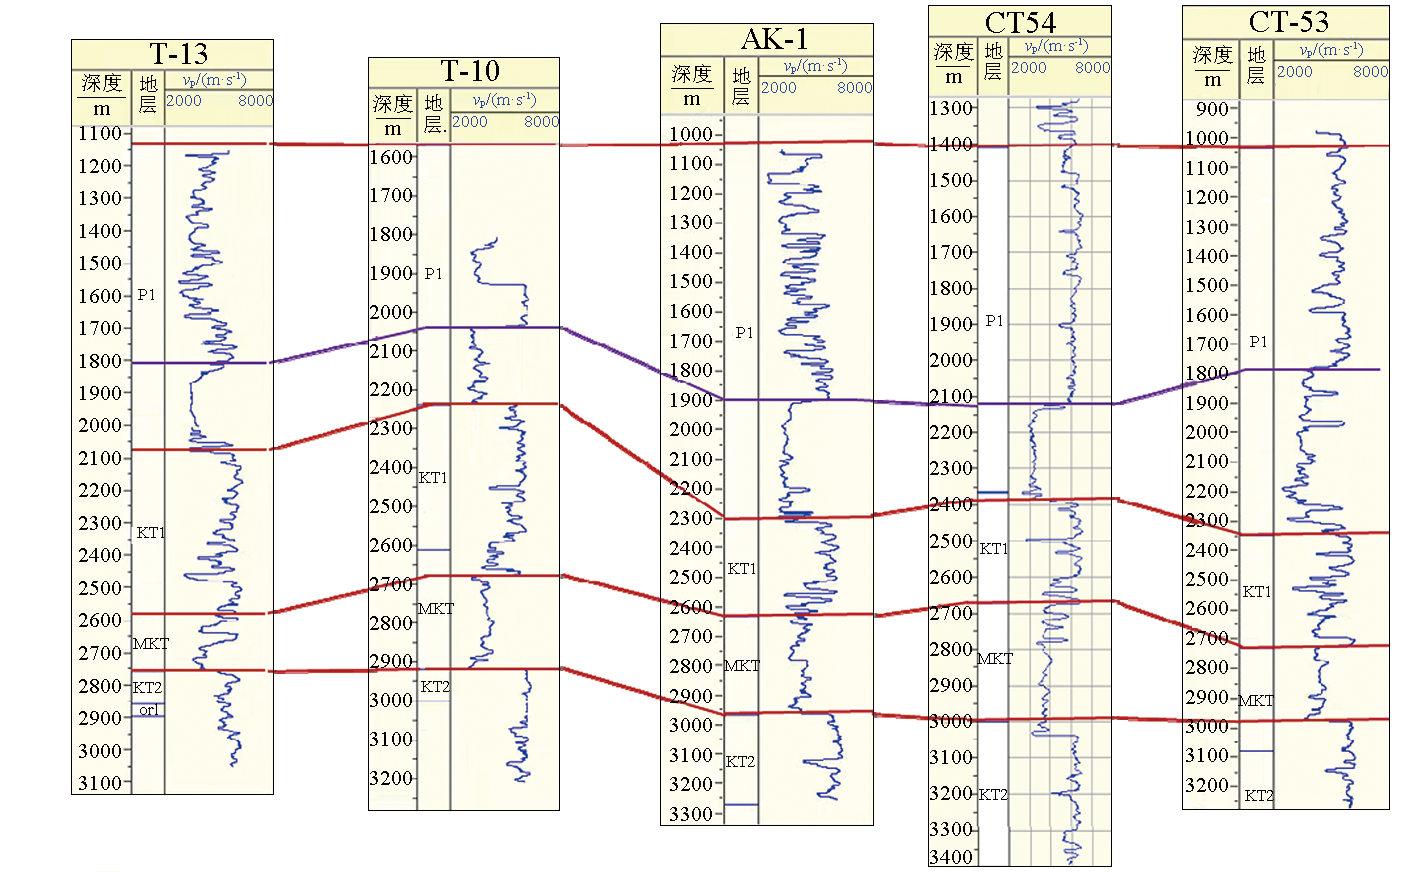
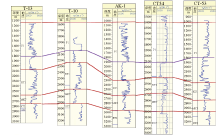
Velocity trend line fitting diagram of wells T-13,AK-1, and AK-2 in the study area
a—original speed curve;b—smoothed speed trend line
|
|
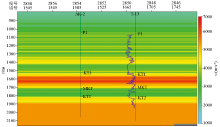
Velocity profile of the study area using well velocity trend line interpolation
|
|
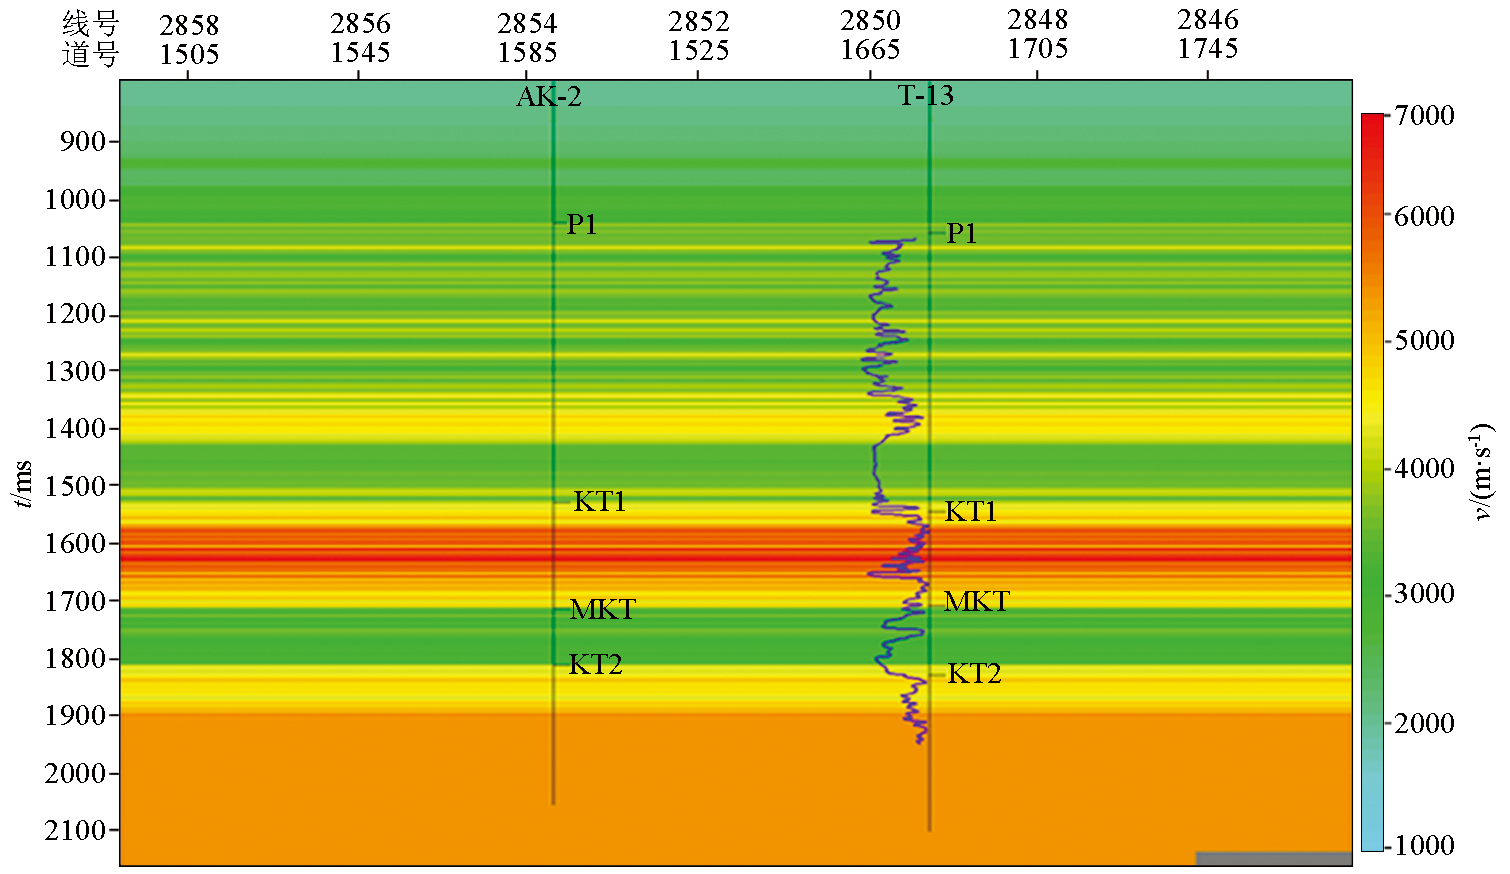
Velocity profile of collaborative modeling in the research area
|
|
Comparison of Single well formation velocities in the study area
|
|
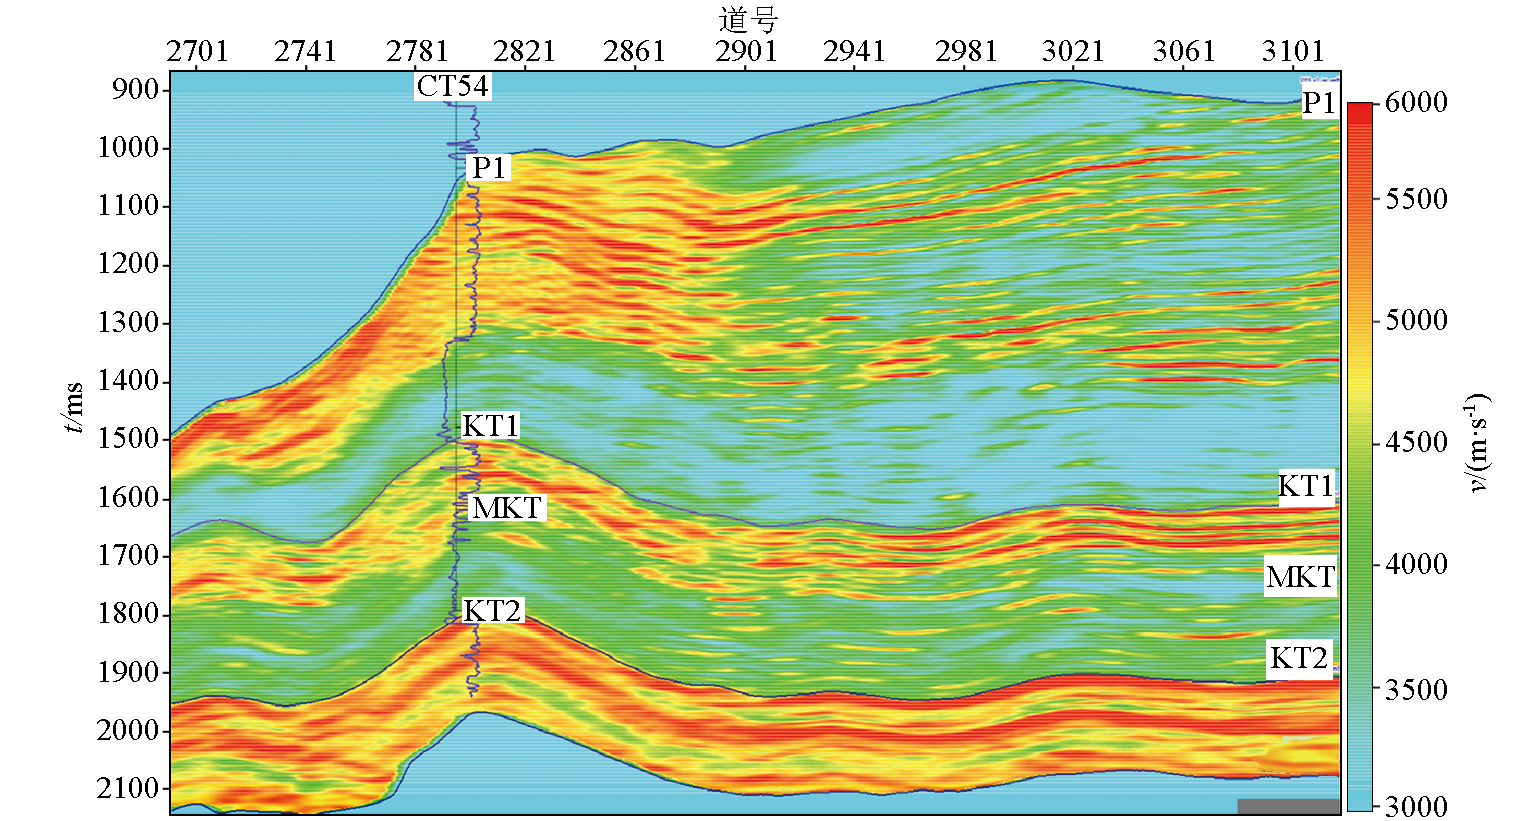
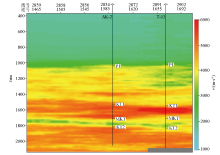
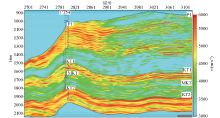
Inversion profile of near east-west layer velocity in the study area
|
|
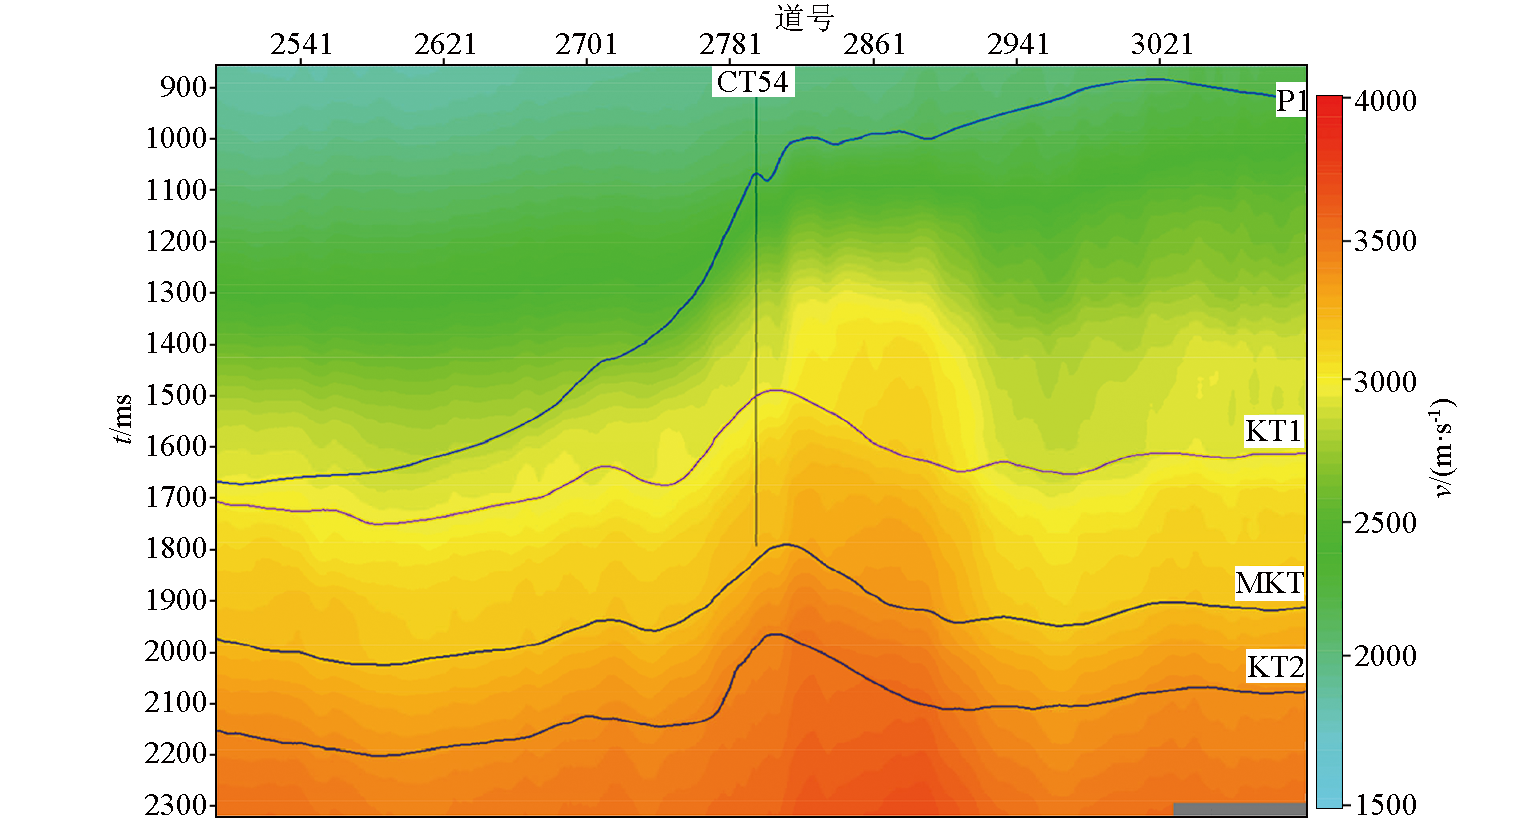
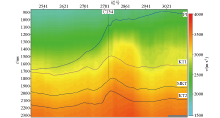
Profile of near east-west average velocity in the study area
|
|
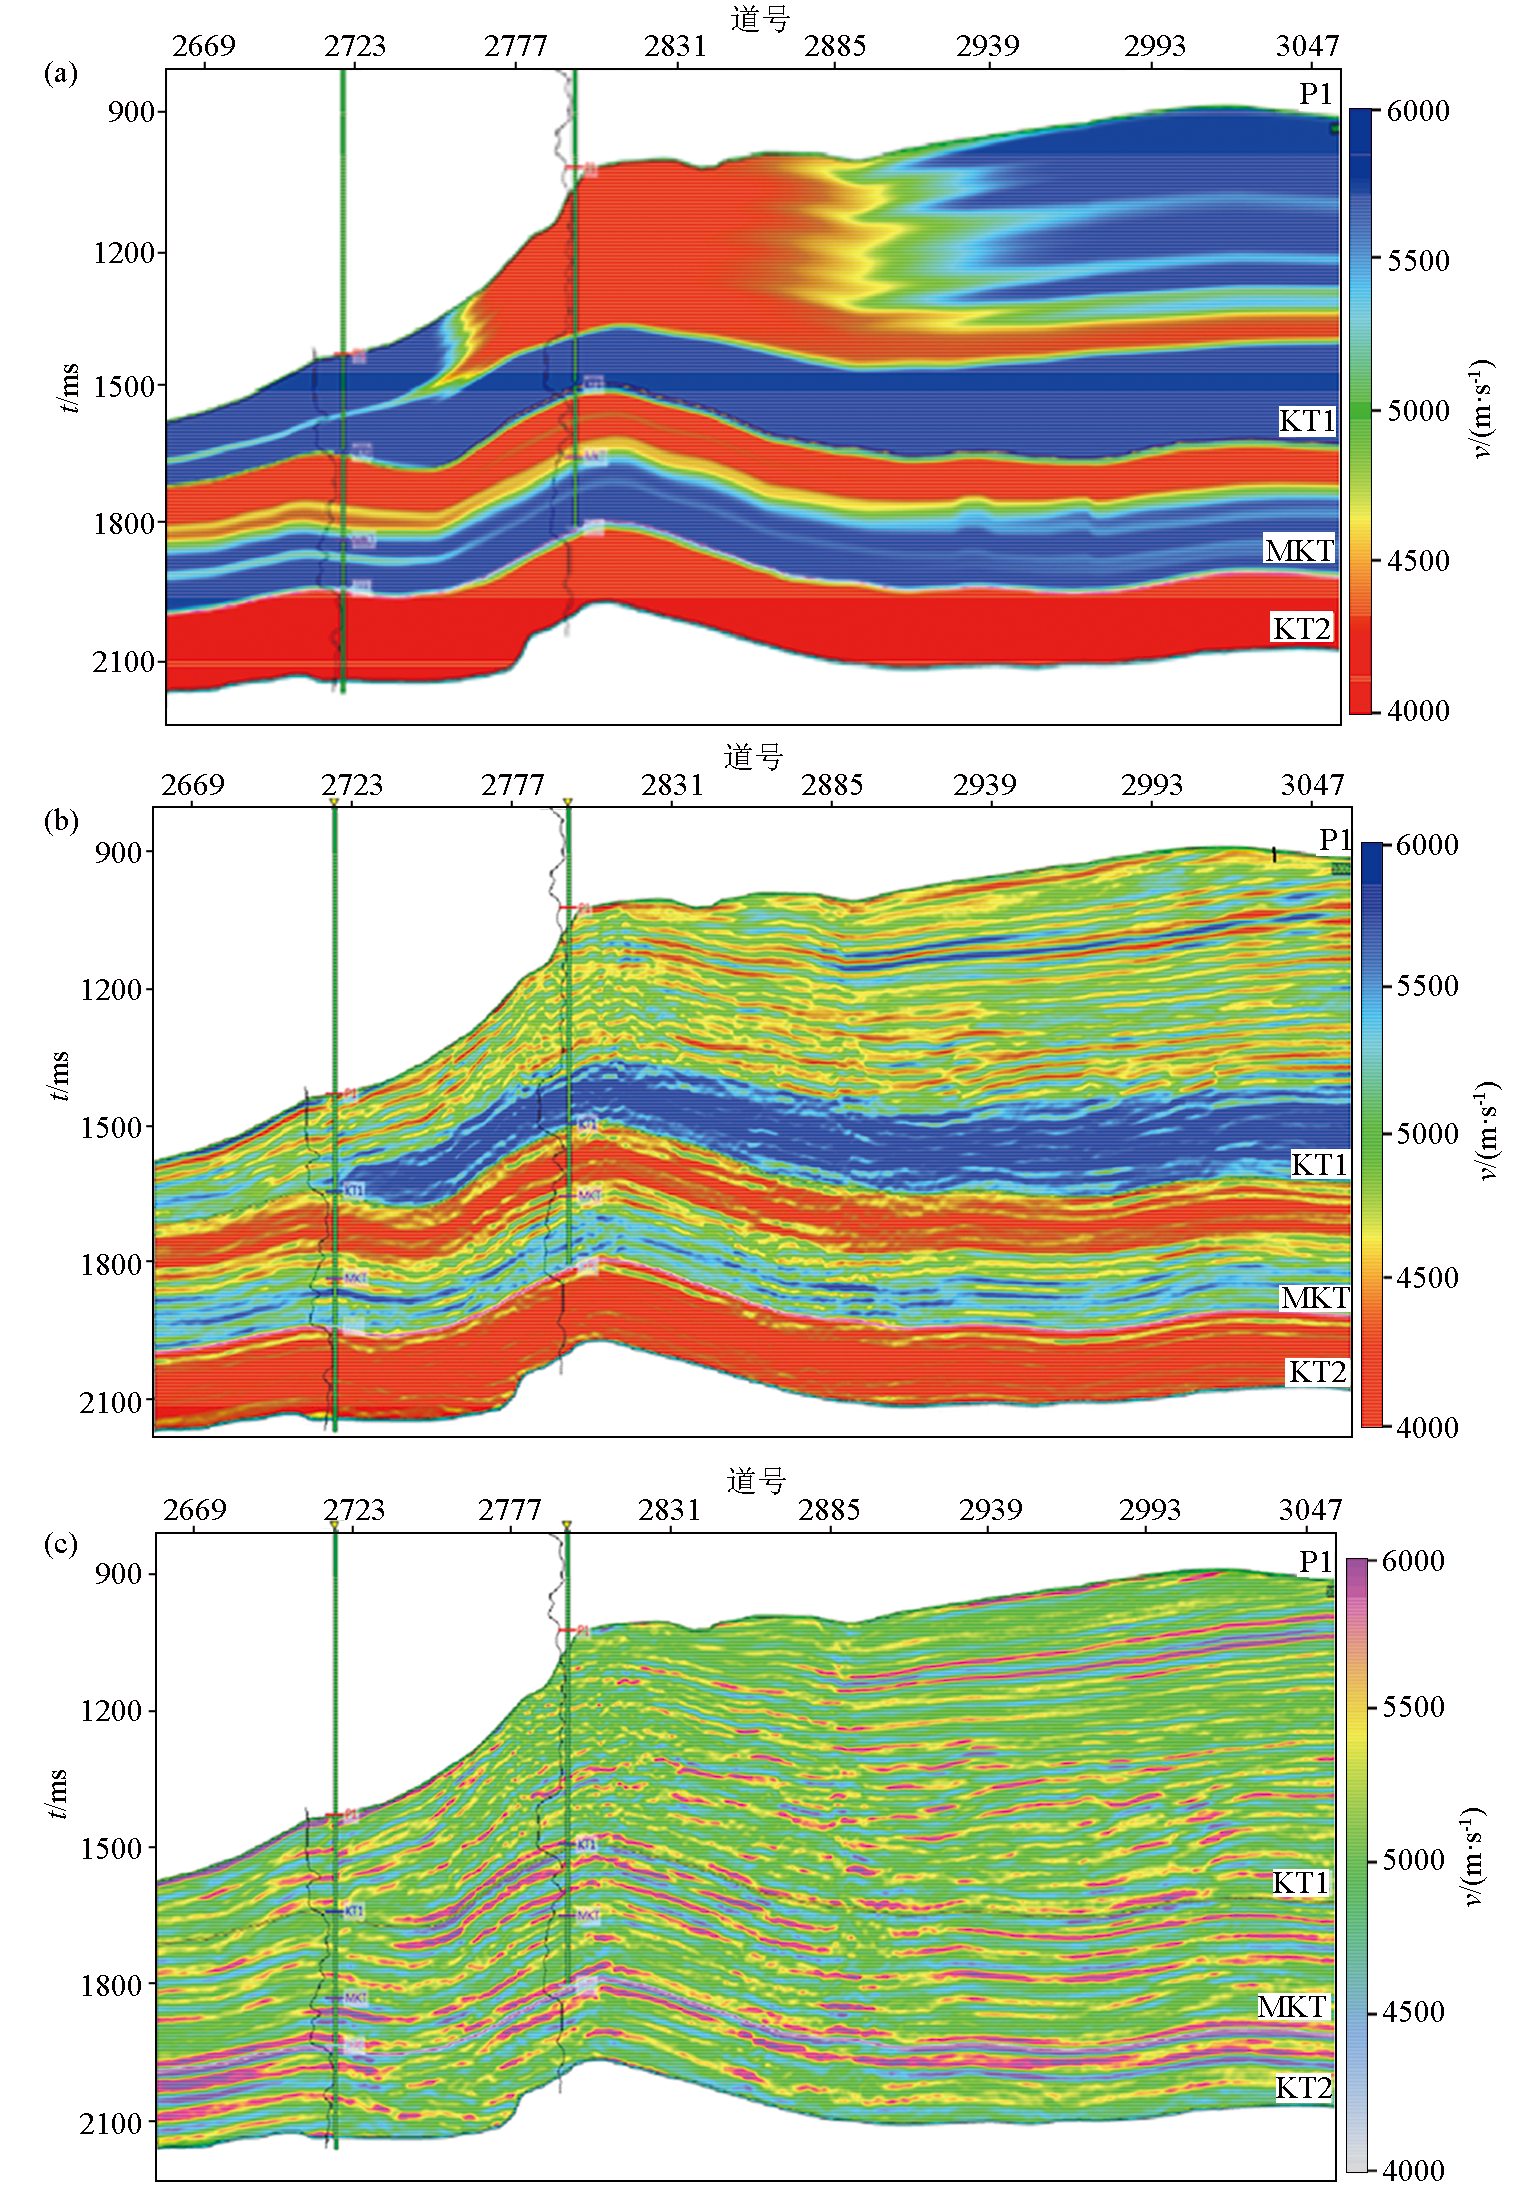
Velocity profile of near east-west frequency inversion in the study area
a—low frequency inversion;b—intermediate frequency inversion;c—high frequency inversion
|
|
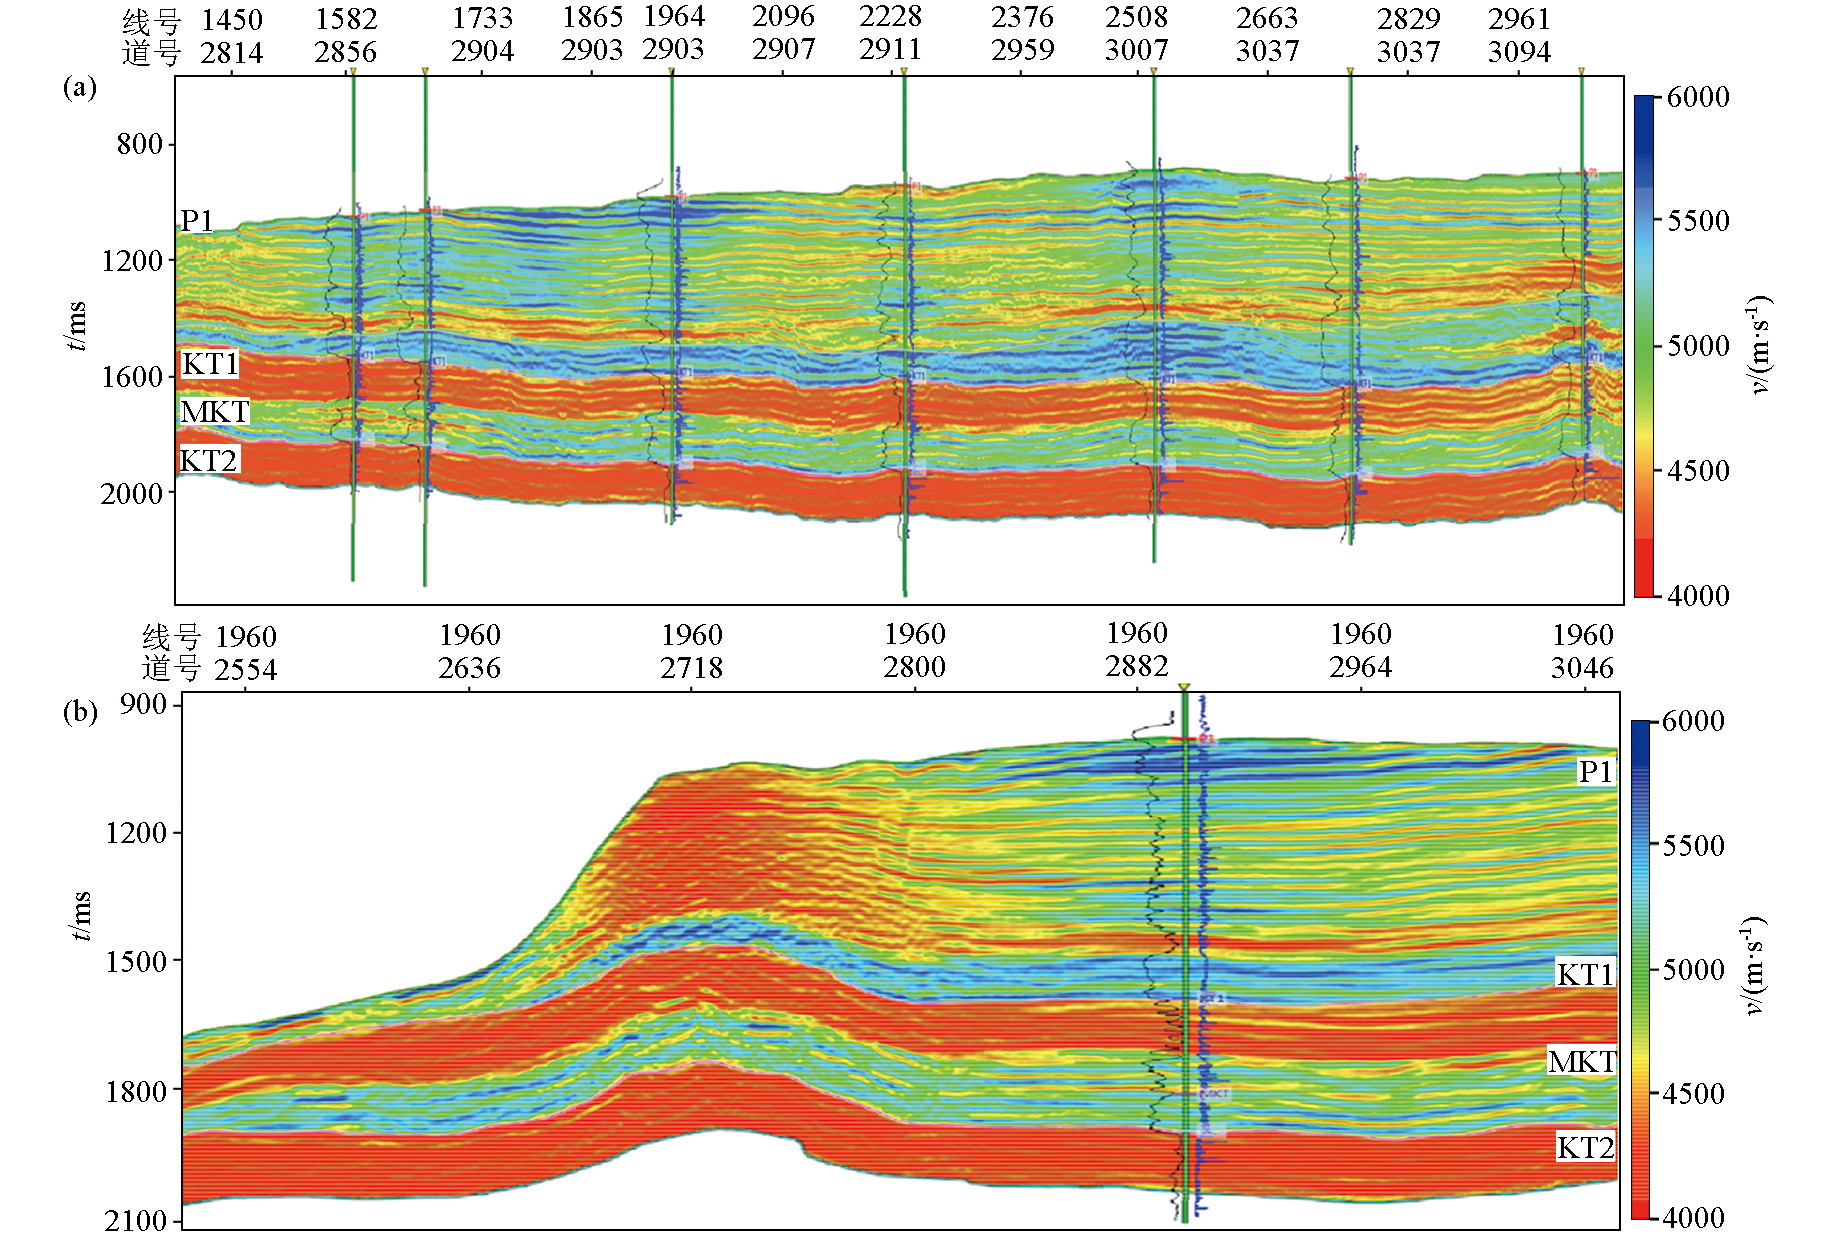
Velocity profile of different direction frequency division inversion in the study area
a—near north-south direction frequency division inversion;b—near east-west direction frequency division inversion
|
|
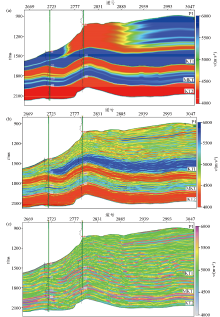
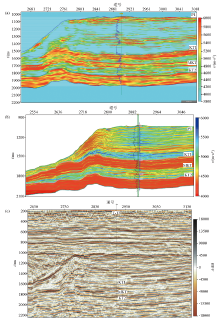
Comparative analysis of velocity profiles obtained from constrained layer velocity inversion and frequency division velocity inversion in the near east-west conventional well of T-13 in the research area
a—velocity profile of conventional well constrained inversion layer;b—velocity profile of frequency division inversion layer;c—seismic reflection characteristic profile
|

|
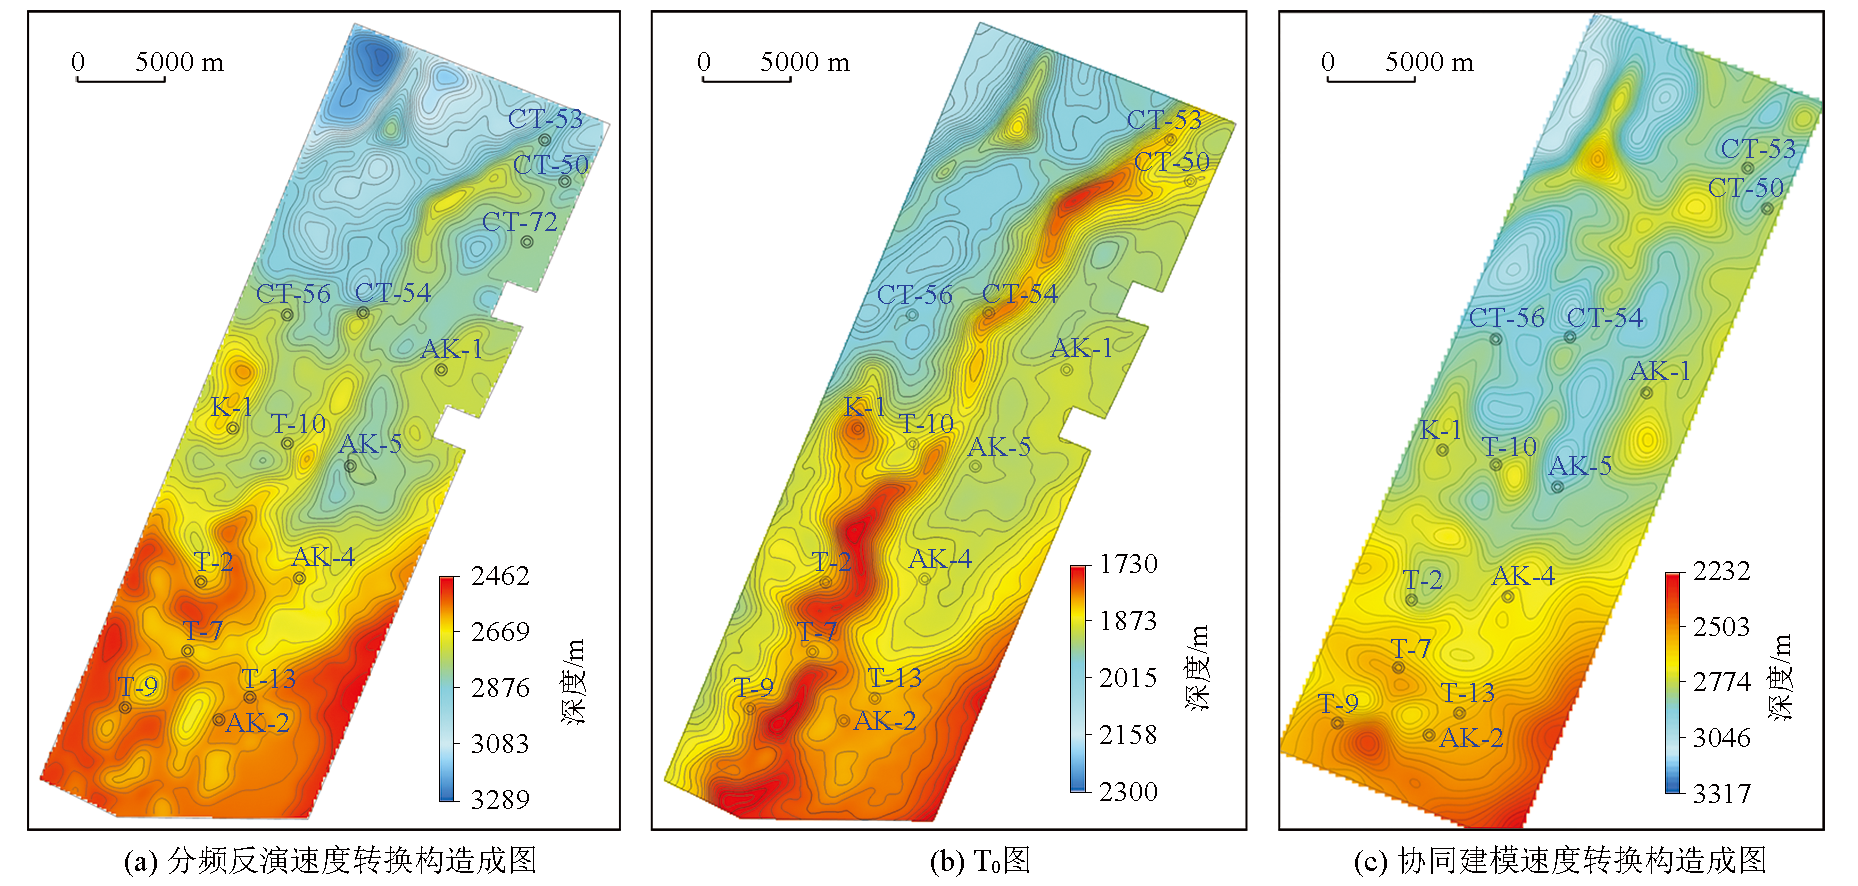
Comparison between the top structure map of the Carboniferous KT2 in the study area and the T0 map
|

| 井号 | KT2深
度/m | 构造图
深度/m | 绝对误
差/m | 相对误
差/‰ | | T-10 | 2708.5 | 2720 | -11.5 | 4.93 | | T-9 | 2549.55 | 2562 | -12.45 | 5.72 | | T-7 | 2593 | 2615 | -22 | 8.48 | | T-2 | 2629.4 | 2612 | 17.4 | 6.62 | | T-13 | 2580.72 | 2584 | -3.28 | 1.27 | | K-1 | 2696 | 2670 | 26 | 9.64 | | CT-56 | 2745.3 | 2768 | -22.7 | 8.26 | | CT-53 | 2816.1 | 2843 | -26.9 | 9.55 | | CT-50 | 2801.8 | 2833 | -21.2 | 7.13 | | AK-4 | 2633.7 | 2639 | -5.3 | 2.01 | | AK-2 | 2581.89 | 2580 | 1.89 | 0.73 | | AK-1 | 2718.39 | 2718 | 0.39 | 0.14 | | CT-54 | 2792 | 2778 | 14 | 5.01 |
|
Error statistics of time-depth conversion for establishing velocity field using frequency division inversion
|
| 井号 | KT2
深度/m | 构造图
深度/m | 绝对误
差/m | 相对误
差/‰ | | T-10 | 2708.5 | 2800 | -91.5 | 33.78 | | T-9 | 2549.55 | 2530 | 19.55 | 7.66 | | T-7 | 2593 | 2570 | 23 | 8.87 | | T-2 | 2629.4 | 2766 | -136.6 | 51.9 | | T-13 | 2580.72 | 2580 | 0.72 | 0.27 | | K-1 | 2696 | 2770 | -74 | 27.44 | | CT-56 | 2745.3 | 2890 | -144.7 | 52.7 | | CT-53 | 2816.1 | 2840 | -23.9 | 8.48 | | CT-50 | 2801.8 | 2850 | -48.2 | 17.2 | | AK-4 | 2633.7 | 2700 | -66.3 | 25.1 | | AK-2 | 2581.89 | 2575 | 6.89 | 2.66 | | AK-1 | 2718.39 | 2785 | -66.61 | 24.5 | | CT-54 | 2792 | 2904 | -112 | 40.11 |
|
Error statistics of time depth conversion in establishing velocity field by collaborative modeling method
|
| [1] |
梁爽, 吴亚东, 王燕琨, 等. 滨里海盆地东缘盐下油气成藏特征与主控因素[J]. 中国石油勘探, 2020, 25(4):125-132.
|
| [1] |
Liang S, Wu Y D, Wang Y K, et al. Characteristics and main controlling factors of sub-salt oil and gas accumulation in the eastern margin of the Precaspian Basin[J]. China Petroleum Exploration, 2020, 25(4):125-132.
|
| [2] |
钱桂华. 哈萨克斯坦滨里海盆地油气地质特征及勘探方向[J]. 中国石油勘探, 2005, 10(5):60-66.
|
| [2] |
Qian G H. Oil-gas geological features and its exploration direction in marginal caspian basin,Kazakhstan[J]. China Petrleum Exploration, 2005, 10(5):60-66.
|
| [3] |
陈荣林, 叶德燎, 徐文明. 滨里海盆地与塔里木盆地油气地质特征的类比[J]. 中国西部油气地质, 2006, 2(3):261-266.
|
| [3] |
Chen R L, Ye D L, Xu W M. Analogy of petroleum geological characteristics between the Caspian Basin and the Tarim Basin[J]. Petroleum Geology of Western China, 2006, 2 (3):261-266.
|
| [4] |
张淮, 饶轶群, 张挺军, 等. 哈萨克斯坦滨里海盆地盐下层系油气成藏组合特征及勘探方向[J]. 中国石油勘探, 2007, 12(1):81-86.
|
| [4] |
Zhang H, Rao Y Q, Zhang T J, et al. Features and exploration trends of hydrocarbon accumulation assemblage of the subsalt strata in Marginal Caspian Basin of Kazakhstan[J]. China Petroleum Exploration, 2007, 12(1):81-86.
|
| [5] |
徐传会. 滨里海盆地油气地质特征与成藏组合[M]. 北京: 石油工业出版社, 2009.
|
| [5] |
Xu C H. Petroleum geological characteristics and reservoir-forming combination in Caspian Basin[M]. Beijing: Petroleum Industry Press, 2009.
|
| [6] |
马海珍, 雍学善, 杨午阳, 等. 地震速度场建立与变速构造成图的一种方法[J]. 石油地球物理勘探, 2002, 37(1):53-59,98.
|
| [6] |
Ma H Z, Yong X S, Yang W Y, et al. A method for building of seismic velocity field and structure mapping by variation in velocity[J]. Oil Geophysical Prospecting, 2002, 37(1):53-59,98.
|
| [7] |
徐文梅. 低幅度构造成图技术[J]. 新疆石油地质, 2003, 24(4):349-350.
|
| [7] |
Xu W M. Technique for mapping low-amplitude structure[J]. Xinjiang Petroleum Geology, 2003, 24(4):349-350.
|
| [8] |
蔡刚, 屈志毅. 构造复杂地区地震资料速度和成图方法研究与应用[J]. 天然气地球科学, 2005, 16(2):246-249.
|
| [8] |
Cai G, Qu Z Y. Study of seismic data velocity and mapping method in complicated structure area and its application[J]. Natural Gas Geoscience, 2005, 16(2):246-249.
|
| [9] |
王兴军, 满益志, 刘昌国, 等. 低幅度构造变速成图技术[J]. 石油地球物理勘探, 2008, 43(S1):69-72,195,8-9.
|
| [9] |
Wang X J, Man Y Z, Liu C G, et al. Variable speed mapping technology of low amplitude structure[J]. Oil Geophysical Prospecting, 2008, 43(S1):69-72,195,8-9.
|
| [10] |
陈广军, 宋国奇. 低幅度构造地震解释探讨[J]. 石油物探, 2003, 42(3):395-398.
|
| [10] |
Chen G J, Song G Q. Discussion on interpretation of low amplitude structures[J]. Geophysical Prospecting for Petroleum, 2003, 42(3):395-398.
|
| [11] |
王树华, 刘怀善, 张云银, 等. 变速成图方法及应用研究[J]. 中国海洋大学学报, 2004, 34(1):139-146.
|
| [11] |
Wang S H, Liu H S, Zhang Y Y, et al. Research on variable-velocity structure mapping and its application[J]. Journal of Ocean University of China, 2004, 34(1):139-146
|
| [12] |
焦存礼, 周杰, 尚雅珍. 变速成图系统技术关键及其在塔中西部的应用[J]. 物探与化探, 2003, 27(3):189-193.
|
| [12] |
Jiao C L, Zhou J, Shang Y Z. The varying velocity mapping technique:Its key problems and its application to western Tazhong area[J]. Geophysical and Geochemical Exploration, 2003, 27(3):189-193.
|
| [13] |
杨勤林, 王彦春, 张菊梅, 等. 低幅度构造识别技术在Carmen油田三维工区的应用[J]. 地球物理学进展, 2009, 24(3):965-969.
|
| [13] |
Yang Q L, Wang Y C, Zhang J M, et al. Application of low-amplitude structure recognition technique to the 3-D seismic exploration in the Carmen field[J]. Progress in Geophysics, 2009, 24(3):965-969.
|
| [14] |
王鹏, 王小卫, 雍运动, 等. 马头营地区低幅度构造速度建模方法[J]. 石油地球物理勘探, 2020, 55(4):766-773.
|
| [14] |
Wang P, Wang X W, Yong Y D, et al. Modeling method of low amplitude tectonic velocity in Matouying area[J]. Oil Geophysical Prospecting, 2020, 55(4):766-773.
|
| [15] |
王艳香, 苏勤, 乐幸福, 等. 四川盆地西北部深层低幅度构造建模及成像[J]. 石油地球物理勘探, 2021, 56(1):109-117.
|
| [15] |
Wang Y X, Su Q, Le X F, et al. Modeling and imaging of deep low-amplitude structure in northwest Sichuan Basin[J]. Oil Geophysical Prospecting, 2021, 56(1):109-117.
|
| [16] |
代玲, 万钧, 罗泽. 分频反演精细储层预测[J]. 中外能源, 2021, 26(12):48-53.
|
| [16] |
Dai L, Wan J, Luo Z. Fine reservoir prediction by frequency-divided inversion[J]. Sino-Global Energy, 2021, 26(12):48-53.
|
| [1] |
LIU Wei-Nan, GUAN Yao, LIU Dao-Li, SHI Lei, SONG Wei. Research and application of the log-based comprehensive identification method for low-contrast oil layers:A case study of the Lufeng oilfield in the Pearl River Mouth Basin[J]. Geophysical and Geochemical Exploration, 2024, 48(3): 573-583. |
| [2] |
HE Xian-Ke, LOU Min, LI Bing-Ying, LIU Jiang, HU Wei, CAI Hua. Geophysical forecasting of deep reservoirs in the Z gas field[J]. Geophysical and Geochemical Exploration, 2024, 48(3): 609-617. |
|
|
|
|