|
|
|
| A multivariate statistical analysis of the distribution and influencing factors of heavy metal elements in the cultivated land of the Sanjiang Plain |
SONG Yun-Hong1,2,3( ), YANG Feng-Chao1(), LIU Kai1,2,3, DAI Hui-Min1,2,3, XU Jiang1,2,3, YANG Ze1,2,3 ), YANG Feng-Chao1(), LIU Kai1,2,3, DAI Hui-Min1,2,3, XU Jiang1,2,3, YANG Ze1,2,3 |
1. Shenyang Center of China Geological Survey, Shenyang 110034, China
2. Key Laboratory for Evolution and Ecological Effect in Black Land, Ministry of Natural Resources, Shenyang 110034, China
3. Key Laboratory for Evolution and Ecological Effect in Black Land of Liaoning Province, Shenyang 110034, China |
|
|
|
|
Abstract Geostatistical and multivariate analyses are effective methods to determine the source of heavy metal elements in the soil. The comparison of the contents and distribution of heavy metal elements in the topsoil and subsoil in different geological setting areas can provide a basis for studying the sources of heavy metal elements in the soil. As one of the areas with concentrated marsh wetlands in China, the Sanjiang Plain has a temperate humid and subhumid continental monsoon climate, is an important grain production base, and has a low degree of industrial activities. This study investigated the main factors affecting the distribution of heavy metal elements in the soil of cultivated land of the Sanjiang Plain on a regional scale. Samples were collected from the topsoil and subsoil of the Sanjiang Plain. The minimum, maximum, median, and average contents, coefficient of variation, and concentration coefficient of eight heavy metal elements (i.e., As, Cr, Cu, Hg, Ni, Cd, Pb, and Zn) in the samples were calculated. The results are as follows. The Sanjiang Plain has superior soil environmental quality. The topsoil samples had slightly lower contents of heavy metal elements except for Cd (e.g., As, Cr, Cu, Hg, Ni, Pb, and Zn) than the subsoil samples. All these elements in the topsoil samples had concentration coefficients less than 2, except for those in the topsoil samples collected at certain points, which had high concentration coefficients of Cd, Hg, and As elements. The main factors influencing heavy metal elements in the topsoil and subsoil in five soil parent material regions were determined through geostatistical and Pearson correlation analyses. The comprehensive analysis results show that elements Cr, Cu, Ni, and Zn mainly originate from the soil parent materials, and Cd, Hg, and As may also be affected by human activities in some areas.
|
|
Received: 27 January 2022
Published: 03 January 2023
|
|
|
|
Corresponding Authors:
YANG Feng-Chao
E-mail: yunhong408@163.com;yangfc123@163.com
|
|
|
|
|
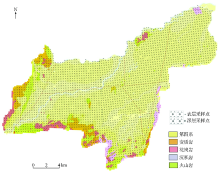
Sampling sketch map of soil sample from Sanjiang Plain
|
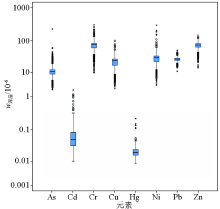
| 参数 | As | Cd | Cr | Cu | Hg | Ni | Pb | Zn | Sc | | 全部表层土壤,N=9873 | | 平均值/10-6 | 8.85 | 0.083 | 65.09 | 21.76 | 0.034 | 25.69 | 25.62 | 63.52 | 11.75 | | 中位数/10-6 | 8.40 | 0.075 | 65.30 | 21.90 | 0.031 | 24.90 | 25.5 | 62 | 11.9 | | 变异系数/% | 37.26 | 50.83 | 18.78 | 22.16 | 54.73 | 22.73 | 10.70 | 20.87 | 15.51 | | 数据范围/10-6 | 1.80~116.8 | 0.009~1.740 | 16.5~281 | 4~74 | 0.013~1.25 | 5.8~147 | 2.3~68.3 | 24.4~225.1 | 2.3~21.9 | | (平均值±标准离差)/10-6 | 8.41±1.30 | 0.076±1.39 | 64.27±1.18 | 21.38±1.24 | 0.032±1.282 | 25.06±1.22 | 25.53±1.10 | 62.09±1.21 | 11.72±1.16 | | 黑龙江省A层背景值[24]/10-6 | 7.3 | 0.086 | 58.6 | 20 | 0.037 | 22.8 | 24.2 | 70.7 | 10.79 | | 全部深层土壤,N=2697 | | 平均值/10-6 | 11.16 | 0.075 | 71.40 | 21.98 | 0.036 | 28.42 | 25.97 | 71.33 | 12.17 | | 中位数/10-6 | 10.80 | 0.072 | 75.30 | 23.6 | 0.035 | 29.50 | 26.3 | 73.6 | 13.1 | | 变异系数/% | 51.07 | 36.60 | 29.75 | 30.27 | 34.43 | 38.45 | 12.84 | 20.67 | 24.11 | | 数据范围/10-6 | 1.82~225 | 0.013~0.36 | 9.6~371.6 | 2.5~98.25 | 0.006~0.274 | 3.4~294.4 | 10.75~49.6 | 13.8~142.5 | 1.6~24.6 | | (平均值±标准离差)/10-6 | 10.50±1.34 | 0.071±1.40 | 73.11±1.19 | 21.78±1.32 | 0.034±1.34 | 27.48±1.31 | 25.82±1.13 | 72.44±1.19 | 12.42±1.22 | | 黑龙江省C层背景值[24]/10-6 | 11.4 | 0.078 | 59.5 | 21 | 0.040 | 24.3 | 24.4 | 69.9 | 无 | | 第四系表层,N=8383 | | 平均值/10-6 | 8.21 | 0.079 | 65.50 | 21.88 | 0.032 | 25.43 | 25.18 | 60.47 | 11.65 | | 中位数/10-6 | 8.00 | 0.072 | 65.70 | 22.40 | 0.031 | 24.80 | 25.10 | 58.00 | 11.80 | | 变异系数/% | 27.55 | 44.36 | 18.15 | 21.39 | 47.43 | 19.61 | 9.16 | 20.45 | 15.93 | | 数据范围/10-6 | 1.80~43.45 | 0.009~1.167 | 16.5~121.6 | 4~49.4 | 0.013~0.986 | 8.08~47.9 | 9.2~61.75 | 27.4~212.1 | 2.9~19.1 | | (平均值±标准离差)/10-6 | 7.96±1.26 | 0.074±1.42 | 64.86±1.19 | 21.52±1.24 | 0.031±1.253 | 25.00±1.21 | 25.12±1.08 | 59.16±1.21 | 11.61±1.16 | | 变质岩表层,N=454 | | 平均值/10-6 | 10.32 | 0.093 | 69.98 | 21.64 | 0.034 | 27.11 | 27.90 | 72.45 | 12.29 | | 中位数/10-6 | 9.98 | 0.083 | 70.00 | 21.45 | 0.030 | 26.50 | 27.40 | 71.05 | 12.40 | | 变异系数/% | 41.44 | 59.11 | 20.61 | 24.02 | 50.82 | 23.00 | 12.39 | 21.32 | 13.01 | | 数据范围/10-6 | 1.84~59.70 | 0.023~0.790 | 31.40~197.8 | 9.15~55.15 | 0.015~0.258 | 10.40~62.10 | 19.40~53.20 | 42.00~213.4 | 6.76~17.2 | | (平均值±标准离差)/10-6 | 9.71±1.32 | 0.083±1.30 | 68.39±1.17 | 20.94±1.23 | 0.031±1.303 | 26.61±1.23 | 27.67±1.11 | 70.47±1.18 | 12.27±1.14 | | 沉积岩表层,N=481 | | 平均值/10-6 | 10.15 | 0.085 | 68.78 | 21.52 | 0.035 | 25.71 | 27.29 | 66.42 | 12.32 | | 中位数/10-6 | 10.40 | 0.077 | 68.80 | 21.30 | 0.032 | 24.60 | 27.10 | 63.90 | 12.40 | | 变异系数/% | 24.45 | 44.98 | 18.45 | 18.35 | 37.57 | 24.55 | 11.78 | 18.10 | 13.10 | | 数据范围/10-6 | 4.32~19.4 | 0.032~0.445 | 29.85~167.7 | 9~39 | 0.018~0.180 | 9.3~67.2 | 19.9~46.6 | 44~119.7 | 6.58~18 | | (平均值±标准离差)/10-6 | 9.89±1.29 | 0.077±1.34 | 67.45±1.15 | 21.23±1.18 | 0.032±1.265 | 24.94±1.22 | 27.04±1.12 | 65.16±1.18 | 12.25±1.13 | | 花岗岩表层,N=251 | | 平均值/10-6 | 10.03 | 0.085 | 69.16 | 20.40 | 0.039 | 26.73 | 28.03 | 71.55 | 12.06 | | 中位数/10-6 | 9.70 | 0.081 | 68.10 | 20.10 | 0.032 | 25.60 | 27.80 | 69.90 | 12.20 | | 变异系数/% | 38.19 | 30.83 | 21.65 | 20.20 | 198.07 | 22.73 | 14.36 | 15.21 | 12.20 | | 数据范围/10-6 | 3.80~33.05 | 0.030~0.255 | 36.9~170 | 11.5~33.8 | 0.016~1.25 | 13.1~56.2 | 20.2~46 | 46.7~108.7 | 8.26~15.4 | | (平均值±标准离差)/10-6 | 9.31±1.37 | 0.081±1.27 | 66.99±1.17 | 20.0±1.23 | 0.032±1.309 | 25.88±1.21 | 27.67±1.14 | 70.80±1.16 | 11.97±1.14 | | 参数 | As | Cd | Cr | Cu | Hg | Ni | Pb | Zn | Sc | | 火山岩表层,N=304 | | 平均值/10-6 | 10.85 | 0.083 | 73.79 | 23.18 | 0.033 | 28.20 | 26.69 | 67.84 | 12.86 | | 中位数/10-6 | 9.99 | 0.080 | 69.85 | 22.90 | 0.031 | 26.15 | 26.40 | 67.05 | 12.70 | | 变异系数/% | 50.85 | 28.56 | 25.29 | 21.77 | 29.46 | 31.06 | 11.73 | 16.48 | 14.02 | | 数据范围/10-6 | 4.76~63.80 | 0.041~0.20 | 45~163.3 | 13.05~43.2 | 0.019~0.095 | 15.8~65.50 | 17.3~37.60 | 43.35~105.3 | 7.51~21.8 | | (平均值±标准离差)/10-6 | 9.84±1.30 | 0.079±1.31 | 71.45±1.25 | 22.65±1.23 | 0.032±1.276 | 26.92±1.31 | 26.49±1.12 | 66.99±1.18 | 12.74±1.13 | | 第四系深层,N=2214 | | 平均值/10-6 | 10.98 | 0.074 | 69.61 | 21.88 | 0.036 | 27.99 | 26.09 | 70.11 | 12.02 | | 中位数/10-6 | 10.65 | 0.070 | 76.30 | 24.30 | 0.036 | 30.30 | 26.60 | 72.60 | 13.20 | | 变异系数/% | 45.32 | 37.47 | 25.88 | 29.19 | 27.86 | 27.32 | 12.53 | 21.29 | 25.19 | | 数据范围/10-6 | 2.35~225 | 0.013~0.22 | 9.6~262 | 2.5~38.9 | 0.006~0.095 | 3.4~146.9 | 14~49.6 | 13.8~120.8 | 1.6~24.6 | | (平均值±标准离差)/10-6 | 10.30±1.31 | 0.070±1.45 | 71.78±1.22 | 21.63±1.35 | 0.034±1.33 | 27.42±1.32 | 26.00±1.13 | 70.80±1.21 | 12.05±1.28 | | 变质岩深层,N=115 | | 平均值/10-6 | 12.58 | 0.075 | 84.87 | 23.53 | 0.037 | 30.04 | 28.17 | 77.15 | 12.84 | | 中位数/10-6 | 11.20 | 0.073 | 83.50 | 23.4 | 0.032 | 30.50 | 28 | 78.70 | 13.40 | | 变异系数/% | 140.56 | 31.04 | 33.76 | 40.02 | 41.26 | 45.93 | 12.75 | 16.17 | 19.40 | | 数据范围/10-6 | 2.27~225 | 0.028~0.18 | 12.9~301.3 | 3.5~98.25 | 0.011~0.128 | 5.2~154.4 | 10.75~40.3 | 21~117.5 | 2.96~24.6 | | (平均值±标准离差)/10-6 | 10.94±1.28 | 0.071±1.32 | 82.04±1.16 | 22.18±1.29 | 0.034±1.38 | 28.91±1.23 | 28.18±1.11 | 76.56±1.18 | 12.91±1.16 | | 沉积岩深层,N=131 | | 平均值/10-6 | 11.32 | 0.073 | 80.62 | 23.03 | 0.038 | 29.63 | 27.32 | 74.15 | 12.91 | | 中位数/10-6 | 11.30 | 0.071 | 79.80 | 23.6 | 0.037 | 29.20 | 27.3 | 75.00 | 13.20 | | 变异系数/% | 28.61 | 30.57 | 20.99 | 22.93 | 32.25 | 26.65 | 11.71 | 14.90 | 17.76 | | 数据范围/10-6 | 2.66~28.4 | 0.017~0.20 | 15.75~180.7 | 4.7~40.6 | 0.013~0.115 | 6.9~68.00 | 17.80~40.3 | 39.5~108.3 | 3.96~19.2 | | (平均值±标准离差)/10-6 | 10.99±1.24 | 0.070±1.30 | 79.62±1.16 | 22.86±1.24 | 0.036±1.32 | 28.45±1.27 | 27.23±1.11 | 73.45±1.17 | 12.97±1.17 | | 花岗岩深层,N=134 | | 平均值/10-6 | 10.43 | 0.072 | 83.90 | 22.62 | 0.038 | 32.09 | 27.50 | 77.39 | 12.96 | | 中位数/10-6 | 11.0 | 0.071 | 80.60 | 21.60 | 0.035 | 29.40 | 27.7 | 78.6 | 13.1 | | 变异系数/% | 27.39 | 26.53 | 32.29 | 34.66 | 37.41 | 68.26 | 11.76 | 15.79 | 17.73 | | 数据范围/10-6 | 3.72~21.3 | 0.041~0.16 | 24.9~251.1 | 8.1~76.1 | 0.015~0.128 | 9.9~202.9 | 14.2~35.1 | 48.4~117.7 | 7.28~24.3 | | (平均值±标准离差)/10-6 | 10.26±1.32 | 0.070±1.29 | 78.52±1.16 | 21.33±1.27 | 0.035±1.32 | 28.84±1.23 | 27.48±1.12 | 76.38±1.17 | 12.79±1.16 | | 火山岩深层,N=105 | | 平均值/10-6 | 11.47 | 0.081 | 93.37 | 26.93 | 0.037 | 41.64 | 25.72 | 80.67 | 14.30 | | 中位数/10-6 | 10.95 | 0.079 | 81.20 | 24.80 | 0.036 | 32.60 | 26.1 | 80.6 | 14.2 | | 变异系数/% | 31.55 | 36.26 | 41.49 | 36.68 | 29.78 | 88.93 | 12.25 | 17.21 | 19.78 | | 数据范围/10-6 | 2.39~28.4 | 0.032~0.33 | 45.4~262.6 | 10.2~76.1 | 0.013~0.115 | 15.5~294.4 | 14.2~40.5 | 42.8~142.5 | 6.15~24.3 | | (平均值±标准离差)/10-6 | 11.09±1.23 | 0.076±1.34 | 82.99±1.27 | 24.83±1.21 | 0.036±1.27 | 33.19±1.37 | 25.88±1.10 | 80.17±1.15 | 14.19±1.15 |
|
The statistical data of heavy metal elements in topsoils and subsoils from Sanjiang Plain
|
|
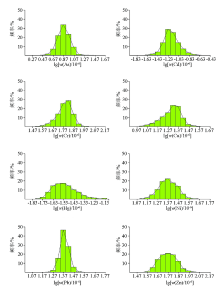
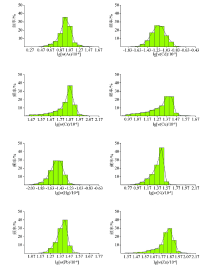
Histograms for heavy metal elements in topsoils from Sanjiang Plain
|
|
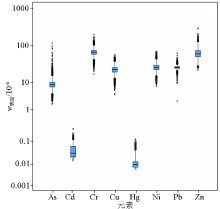
Box-plot diagram for heavy metal elements in topsoils from Sanjiang Plain
|
|
Box-plot diagram for heavy metal elements insubsoils from Sanjiang Plain
|
|
Histograms for heavy metal elements in subsoils from Sanjiang Plain
|
|
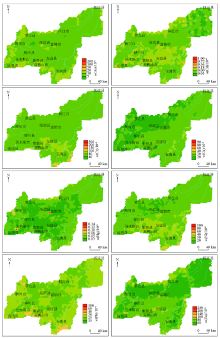
Spatial distribution of heavy metal elements concentrations in the top soil from Sanjiang Plain
|
|
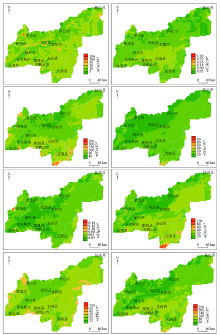
Spatial distribution of heavy elements concentrations in the deep soil from Sanjiang Plain
|
| 元素 | Pearson相关系数 | | 第四系 | 变质岩 | 沉积岩 | 花岗岩 | 火山岩 | | As | 0.018 | 0.009 | 0.380** | 0.266** | 0.216** | | Cd | 0.332** | 0.178** | 0.176** | 0.091 | 0.140* | | Cr | 0.602** | 0.185** | 0.480** | 0.395** | 0.625** | | Cu | 0.584** | 0.308** | 0.440** | 0.512** | 0.414** | | Hg | 0.137** | 0.250** | 0.218** | 0.100 | 0.249** | | Ni | 0.500** | 0.252** | 0.527** | 0.488** | 0.449** | | Pb | 0.264** | 0.206** | 0.268** | 0.367** | 0.045 | | Zn | 0.314** | 0.333** | 0.299** | 0.203** | 0.470** |
|
The Pearson correlation coefficient between heavy metal elements in topsoils and subsoils from Sanjiang Plain
|
| [1] |
宋运红, 刘凯, 戴慧敏, 等. 东北松辽平原35年来耕地土壤全氮时空变化最新报道[J], 中国地质, 2021, 48(1):332-333.
|
| [1] |
Song Y H, Liu K, Dai H M, et al. Spatio-temporal variation of total N content in farmland soil of Songliao Plain in Northeast China during the past 35 years[J]. Geology in China, 2021, 48(1):332-333.
|
| [2] |
宋运红, 刘凯, 戴慧敏, 等. 松嫩平原东部典型黑土剖面孢粉组合及其时代和古气候意义[J]. 地质通报, 2020, https://kns.cnki.net/kcms/detail/11.4648.P.20201015.0930.002.html.

|
| [2] |
Song Y H, Liu K, Dai H M, et al. Palynological assemblages of typical black soil profile in the eastern Songliao Plain and their age and paleoclimatic significances[J]. Geological Bulletin of China, 2020a, https://kns.cnki.net/kcms/detail/11.4648.P.20201015.0930.002.html.
|
| [3] |
宋运红, 刘凯, 戴慧敏, 等. 东北松辽平原典型黑土—古土壤剖面AMS14C年龄首次报道[J]. 中国地质, 2020, 47(6):1926-1927.
|
| [3] |
Song Y H, Liu K, Dai H M, et al. The first reported of the AMS14C age of typical black soil mollisol—paleosol profile of Songliao Plain[J]. Geology in China, 2021,2020b, 47(6):1926-1927.
|
| [4] |
李斌, 段亚军, 张娜, 等. 典型农业区土壤 6 种重金属的人为污染情况及健康风险评价[J]. 环境与健康杂志, 2020, 37(3):246-248.
|
| [4] |
Li B, Duan Y J, Zhang N, et al. Anthropogenic pollution and health risk assessment of six heavy metals in soil of a typical agricultural area[J]. J Environ Health, 2020, 37(3):246-248.
|
| [5] |
Song Y H, Dai H M, Yang F C, et al. Temporal and spatial change of soil organic matter and pH in cultivated land of the Songliao Plain in Northeast China during the past 35 years[J]. Acta Geologica Sinica, 2019, 93(S):142-143.
|
| [6] |
张哲寰, 宋运红, 赵君, 等. 黑龙江省讷河市土壤某些微量元素地球化学特征[J]. 地质与资源, 2019, 28(4):378-382.
|
| [6] |
Zhang Z H, Song Y H, Zhao J, et al. Trace element geochemistry of the soil in Nehe city,Heilongjiang Province[J]. Geology and resources, 2019, 28(4): 378-382.
|
| [7] |
张继舟, 吕品, 于志民, 等. 三江平原农田土壤重金属含量的空间变异与来源分析[J]. 华北农学报, 2014, 29(S):353-359.
|
| [7] |
Zhang J Z, Lyu P, Yu Z M, et al. Spatial variability and source analysis of heavy metal content of agricultural soil in Sanjiang Plain[J]. Acta Agriculturae Boreali-Sinica, 2014, 29(S):353-359.
|
| [8] |
曹宏杰, 王立民, 罗春雨, 等. 三江平原地区农田土壤中几种重金属空间分布状况[J]. 生态与农村环境学报, 2014, 30(2):155-161.
|
| [8] |
Cao H J, Wang L M, Luo C Y. Spatial distribution of heavy metals in agricultural soil in Sanjiang Plain[J]. Journal of Ecology and Rural Environment, 2014, 30(2):155-161.
|
| [9] |
张宪依, 庞成宝, 王安婷, 等. 海南岛表层及深层土壤重金属分布特征及源解析[J]. 现代地质, 2020, 34(5):970-978.
|
| [9] |
Zhang X Y, Pang C B, Wang A T, et al. Distribution characteristics and source identification of heavy metals in topsoils and subsoils of Hainan Island[J]. Geoscience, 2020, 34(5):970-978.
|
| [10] |
杨帅斌, 刘恋. 北京市不同功能区土壤黑碳的含量特征及其来源分析[J]. 地质力学学报, 2017, 23(6):846-855.
|
| [10] |
Yang S B, Liu L. Concentration and sources of black carbon in different function zones of Beijing,China[J]. Journal of Geomechanics, 2017, 23(6):846-855.
|
| [11] |
Lu A X, Wang J H, Qin X Y, et al. Multivariate and geostatistical analyses of the spatial distribution and origin of heavy metals in the agricultural soils in Shunyi,Beijing,China[J]. Science of the Total Environment, 2012, 425:66-74.
|
| [12] |
Bini C, Sartori G, Wahsha M, et al. Background levels of trace elements and soil geochemistry at regional level in NE Italy[J]. Journal of Geochemical Exploration, 2011, 109(1/3) :125-133.
|
| [13] |
Rodríguez J A, Arias M L, Grau J M. Heavy metals contents in agricultural topsoils in the Ebro basin (Spain):Application of the multivariate geostatistical methods to study spatial variations[J]. Environmental Pollution, 2006, 144(3):1001-1012.
|
| [14] |
李欢, 黄勇, 张沁瑞, 等. 北京平原区土壤地球化学特征及影响因素分析[J]. 物探与化探, 2021, 45(2):502-516.
|
| [14] |
Li H, Huang Y, Zhang Q R, et al. Soil geochemical characteristics and influencing factors in Beijing Plain[J]. Geophysical and Geochemical Exploration, 2021, 45(2):502-516.
|
| [15] |
Lyu J, Liu Y, Zhang Z, et al. Factorial kriging and stepwise regression approach to identify environmental factors influencing spatial multi-scale variability of heavy metals in soils[J]. J.Hazard.Mater, 2013, 261:387-397.
|
| [16] |
Frattini P, De Vivo B, Lima A, et al. Elemental and gamma-ray surveys in the volcanic soils of Ischia island,Italy[J]. Geochemistry:Exploration, Environment,Analysis, 2006, 6 (4):325-339.
|
| [17] |
Ansari A A, Singh I B, Tobschal H J. Importance of geomorphology and sedimentation processes for metal dispersion in sediments and soils of the Ganga Plain:Identification of geochemical domains[J]. Chemical Geology, 2000, 162(3):245-266.
|
| [18] |
Rognerud S, Hongve D, Fjeld E, et al. Trace metal concentrations in lake and overbank sediments in southern Norway[J]. Environ.Geol, 2000, 39(7):723-732.
|
| [19] |
Fergusson, J E. The heavy elements: Chemistry,environmental impact and health effects[J]. New York:Pergamon Press, 1990:412.
|
| [20] |
尚二萍, 许尔琪, 张红旗, 等. 中国粮食主产区耕地土壤重金属时空变化与污染源分析[J]. 环境科学, 2018, 39(10):4670-4683.
|
| [20] |
Shang E P, Xu E Q, Zhang H Q, et al. Spatial temporal trends and pollution source analysis for heavy metal contamination of cultivated soils in five major grain producing regions of China[J]. Environmental Science, 2018, 39(10):4670-4683.
|
| [21] |
Yuan G L, Sun T H, Han P, et al. Source identification and ecological risk assessment of heavy metals in topsoil using environmental geochemical mapping:Typical urban renewal area in Beijing,China[J]. Journal of Geochemical Exploration, 2014, 136:40-47.
|
| [22] |
张炜华, 于瑞莲, 杨玉杰, 等. 厦门某旱地土壤垂直剖面中微量迁移规律及来源解析[J]. 环境科学, 2019, 40(8):3764-3773.
|
| [22] |
Zhang W H, Yu R L, Yang Y J, et al. Migration and source analysis of heavy metals in vertical soil profiles of the drylands of Xiamen City[J]. Environmental Science, 2019, 40(8):3764-3773.
|
| [23] |
Zhang H H, Chen J J, Zhu L, et al. Anthropogenic mercury enrichment factors and contributions in soils of Guangdong Province,South China[J]. Journal of Geochemical Exploration, 2014, 144:312-319.
|
| [24] |
魏复盛, 郑春江, 刘志虹, 等. 中国土壤元素背景值[M]. 北京: 中国环境科学出版社, 1990:330-380.
|
| [24] |
Wei F S, Zhen C J, Liu Z H, et al. Chinese soil element background values[M]. Beijing: China Environmental Science Press, 1990:330-380.
|
| [25] |
柴立立, 崔邢涛. 河北省重点城市土壤重金属污染评价与防治对策——以石家庄市为例[J]. 科学技术与工程, 2019, 19(3):261-269.
|
| [25] |
Chai L L, Cui X T. Pollution assessments and prevention countermeasures of heavy metals of soil in main cities of Hebei Province:Taking Shijiazhuang as an example[J]. Science Technology and Engineering, 2019, 19(3) :261-269.
|
| [26] |
刘银飞, 孙彬彬, 贺灵, 等. 福建龙海土壤垂向剖面元素分布特征[J]. 物探与化探, 2016, 40(4): 713-721.
|
| [26] |
Liu Y F, Sun B B, H L, et al. Distribution characteristics of elements in vertical soil profile in Longhai,Fujian province[J]. Geophysical and Geochemical Exploration, 2016, 40(4): 713-721.
|
| [27] |
宋运红, 张哲寰, 杨凤超, 等. 黑龙江海伦地区垦殖前后典型黑土剖面主要养分元素垂直分布特征[J]. 地质与资源, 2020, 26(6):543-549.
|
| [27] |
Song Y H, Zhang Z H, Dai H M, et al. Vertical distribution characteristics of main nutrient elements in typical black soil profile before and after reclamation in Helun Area, Heilongjiang Province[J]. Geology and Resources, 2020, 26(6):543-549.
|
| [1] |
LIU Qing-Yu, MA Ying, CHENG Li, SHEN Xiao, ZHANG Ya-Feng, MIAO Guo-Wen, HUANG Qiang, HAN Si-Qi. Density and spatial distribution of organic carbon in the topsoil of eastern Qinghai[J]. Geophysical and Geochemical Exploration, 2023, 47(4): 1098-1108. |
| [2] |
ZHANG Qin-Rui, LI Huan, DENG Yu-Fei, HUANG Yong, ZHANG Bo, XU Yi-bo. Distribution of heavy metal elements in soil of the Southeastern suburbs of Beijing and their enrichment characteristics in surface soil[J]. Geophysical and Geochemical Exploration, 2022, 46(2): 490-501. |
|
|
|
|


