|
|
|
| Scale effects of spatial variations in SOM and STN in semi-arid regions: A case study of Yan'an |
WANG Peng1( ), ZHAO Jun1(), LIU Tuo1, ZHOU Yi-Fan2, WEI Jin-Ping1, WANG Lei1 ), ZHAO Jun1(), LIU Tuo1, ZHOU Yi-Fan2, WEI Jin-Ping1, WANG Lei1 |
1. Xi'an Center of China Geological Survey Northwest China Center for Geoscience Innovation,Xi'an 710054,China
2. Xi'an Institute of Prespecting and Mapping,Xi'an 710059,China |
|
|
|
|
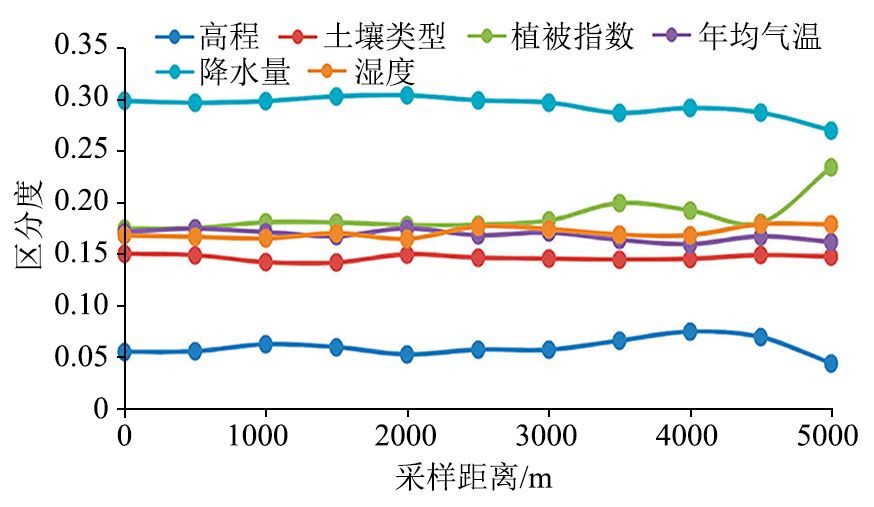
Abstract Taking high-density sampling data as a dataset, the sampling spatial distribution scenarios on different scales were simulated through resampling analysis. Spatial analysis methods, such as Moran's I index, semi-variance function value, and fractal dimension FD, were used to explore the scale effects of spatial variations in soil organic matter (SOM) and soil total nitrogen (STN) and to analyze the conversion of influencing factors between different scales. The results are as follows. With an increase in scale, the spatial agglomeration decreased, and the spatial variation of SOM and STN in general increased first and then tended to be stable. By contrast, the random variation decreased gradually and the structural variation increased first and then decreased as the scales increased. The spatial variation generated on small scales consisted of a large proportion of random variation and a small proportion of structural variation, while the opposite is true on large scales. Different influencing factors had different distinguishing degrees for the spatial variations in SOM and STN. Their distinguishing degrees were in the order of height<factors such as soil type, vegetation index, annual average temperature, and humidity<precipitation. The influencing factors of the spatial variations in SOM and STN had scale effects. Specifically, with an increase in scale, the random variation caused by small-scale factors decreased gradually, while the structural variation caused by large-scale factors increased first and then weakened until the large-scale factors were transformed into relatively small-scale factors. The coordination mechanism of the effects of each factor on the SOM and STN contents was quite different between different scales, causing the random and structural variations to fluctuate between different scales. As a result, the spatial variations showed the law of decreasing first and then tending to stabilize.
|
|
Received: 20 July 2021
Published: 17 August 2022
|
|
|
|
Corresponding Authors:
ZHAO Jun
E-mail: 331559202@qq.com;28611635@qq.com
|
|
|
|
|
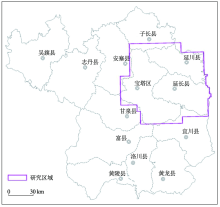
Location of the study area
|
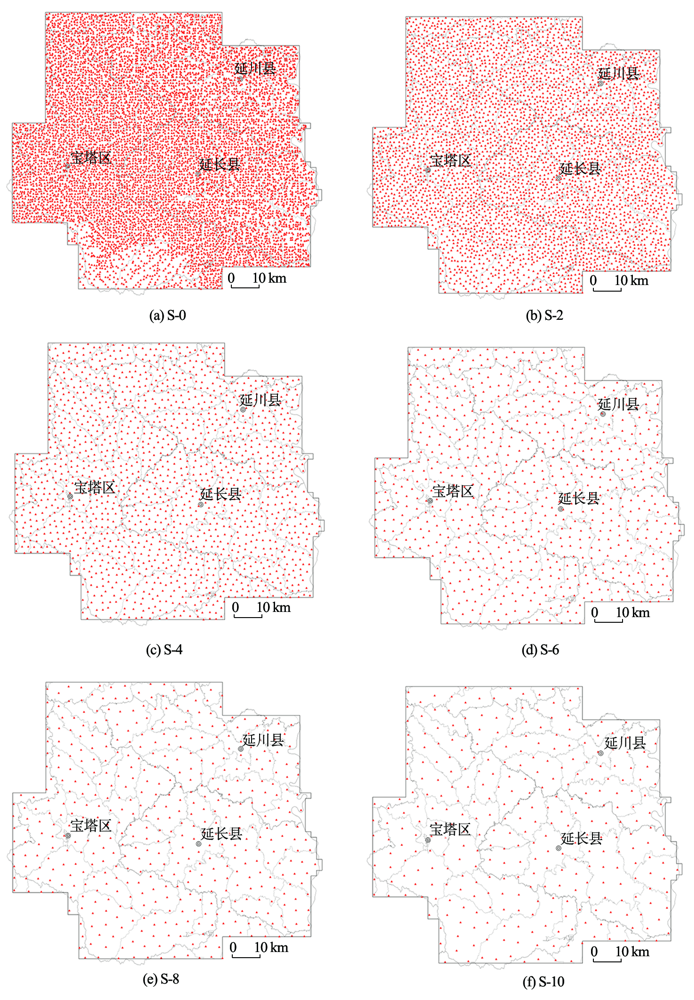
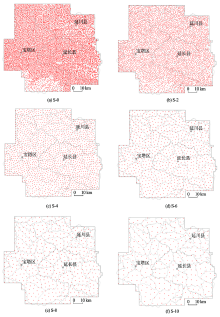
| 尺度 | S-0 | S-1 | S-2 | S-3 | S-4 | S-5 | S-6 | S-7 | S-8 | S-9 | S-10 | | 指定距离/m | | 500 | 1000 | 1500 | 2000 | 2500 | 3000 | 3500 | 4000 | 4500 | 5000 | | 样点数 | 8462 | 8037 | 4062 | 2301 | 1463 | 936 | 666 | 486 | 380 | 302 | 249 |
|
Relationship of different spacing after resampling analysis
|
|
Sampling distribution at different scales
|
|
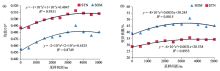
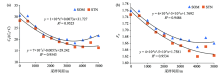
Scatter diagram of variation mean value(a) and codfficients(b) at different scales
|
|
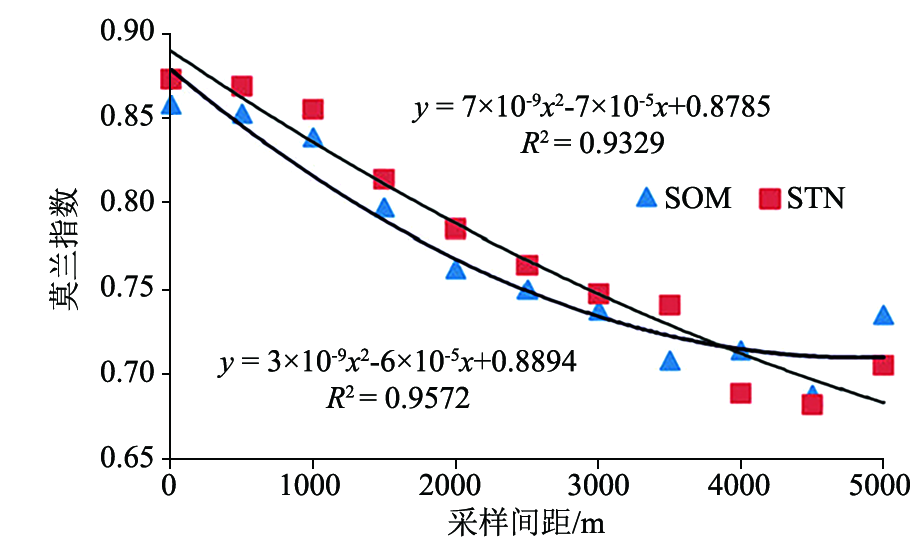
Scatter diagramof Moran’s I at different scales
|
| 指标 | 采样距离/m | 方向/(°) | 拟合模型 | C0 | C0+C | [C0/(C0+C)]/% | | 有机质 | 0 | 0 | G | 0.0368 | 0.1286 | 0.2862 | | 45 | G | 0.0366 | 0.1287 | 0.2845 | | 90 | G | 0.0368 | 0.1287 | 0.2859 | | 135 | G | 0.0365 | 0.1286 | 0.2839 | | 5000 | 0 | G | 0.0254 | 0.1178 | 0.2156 | | 45 | G | 0.0253 | 0.1177 | 0.2149 | | 90 | G | 0.0255 | 0.1178 | 0.2164 | | 135 | G | 0.0256 | 0.1183 | 0.2164 | | 全氮 | 0 | 0 | G | 0.0197 | 0.0698 | 0.2822 | | 45 | G | 0.0196 | 0.0696 | 0.2816 | | 90 | G | 0.0198 | 0.0698 | 0.2837 | | 135 | G | 0.0199 | 0.0699 | 0.2847 | | 5000 | 0 | G | 0.0125 | 0.0768 | 0.1628 | | 45 | G | 0.0126 | 0.0769 | 0.1640 | | 90 | G | 0.0126 | 0.0769 | 0.1642 | | 135 | G | 0.0126 | 0.0769 | 0.1633 |
|
Semivariogram heterogeneity analysis of SOM and STN
|
| 项目 | 采样
距离/m | 拟合
模型 | C0 | C0+C | [C0/(C0+
C)]/% | 变程/m | 决定
系数R2 | 残差
RSS | 分形
维数FD | | 有机质 | 0 | G | 0.0337 | 0.1114 | 30.25 | 45400 | 0.975 | 1.52×10⁻⁴ | 1.759 | | 500 | G | 0.0338 | 0.1116 | 30.29 | 45000 | 0.977 | 1.18×10⁻³ | 1.758 | | 1000 | G | 0.0321 | 0.1242 | 25.85 | 46900 | 0.981 | 1.49×10⁻⁴ | 1.730 | | 1500 | G | 0.0301 | 0.1362 | 22.10 | 49400 | 0.985 | 1.49×10⁻⁴ | 1.705 | | 2000 | G | 0.0277 | 0.1314 | 21.08 | 47500 | 0.986 | 1.42×10⁻⁴ | 1.690 | | 2500 | G | 0.0271 | 0.1342 | 20.19 | 47700 | 0.987 | 1.32×10⁻⁴ | 1.676 | | 3000 | G | 0.025 | 0.1250 | 20.00 | 47200 | 0.985 | 1.38×10⁻⁴ | 1.673 | | 3500 | G | 0.026 | 0.1410 | 18.44 | 50300 | 0.991 | 9.64×10⁻⁵ | 1.669 | | 4000 | G | 0.0218 | 0.1106 | 19.71 | 44400 | 0.988 | 9.80×10⁻⁵ | 1.649 | | 4500 | G | 0.0236 | 0.1112 | 21.22 | 46000 | 0.992 | 6.39×10⁻⁵ | 1.677 | | 5000 | G | 0.0254 | 0.1178 | 21.56 | 49900 | 0.989 | 8.25×10⁻⁵ | 1.660 | | 全氮 | 0 | G | 0.0197 | 0.0698 | 28.22 | 46100 | 0.98 | 4.64×10⁻⁵ | 1.747 | | 500 | G | 0.0196 | 0.0701 | 27.96 | 45800 | 0.982 | 4.44×10⁻⁵ | 1.744 | | 1000 | G | 0.019 | 0.0767 | 24.77 | 46200 | 0.985 | 4.66×10⁻⁵ | 1.721 | | 1500 | G | 0.0175 | 0.0825 | 21.21 | 48400 | 0.994 | 9.30×10⁻⁵ | 1.694 | | 2000 | G | 0.0164 | 0.0800 | 20.50 | 45900 | 0.986 | 8.36×10⁻⁵ | 1.683 | | 2500 | G | 0.0157 | 0.0832 | 18.87 | 47000 | 0.990 | 4.34×10⁻⁵ | 1.660 | | 3000 | G | 0.0141 | 0.0775 | 18.19 | 47100 | 0.989 | 4.10×10⁻⁵ | 1.653 | | 3500 | G | 0.0146 | 0.0877 | 16.65 | 48900 | 0.991 | 1.46×10⁻⁵ | 1.637 | | 4000 | G | 0.0121 | 0.0726 | 16.67 | 44700 | 0.992 | 2.79×10⁻⁵ | 1.620 | | 4500 | G | 0.0137 | 0.0738 | 18.56 | 47100 | 0.992 | 2.56×10⁻⁵ | 1.650 | | 5000 | G | 0.0125 | 0.0768 | 16.28 | 50900 | 0.990 | 3.38×10⁻⁵ | 1.623 |
|
Semi-variogram and fractal dimension of SOM and STN at different scales
|
|
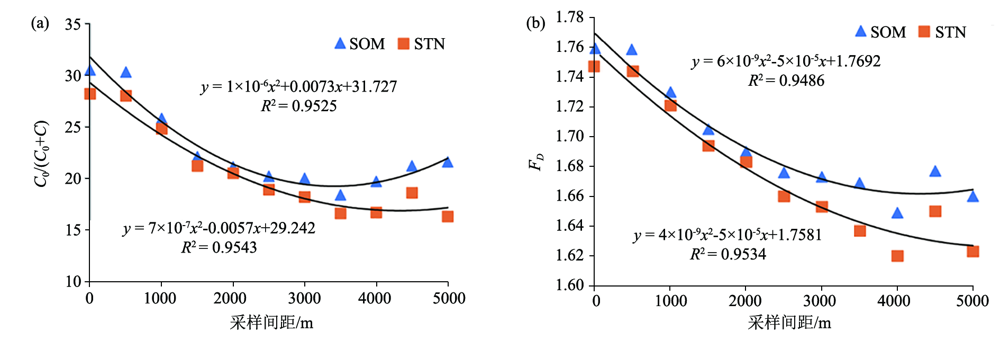
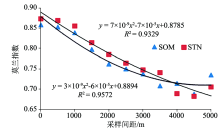
Scatter diagram of Nugget-Sill ratio(a) and fractal dimension(b) of SOM and STN at different scales
|

|
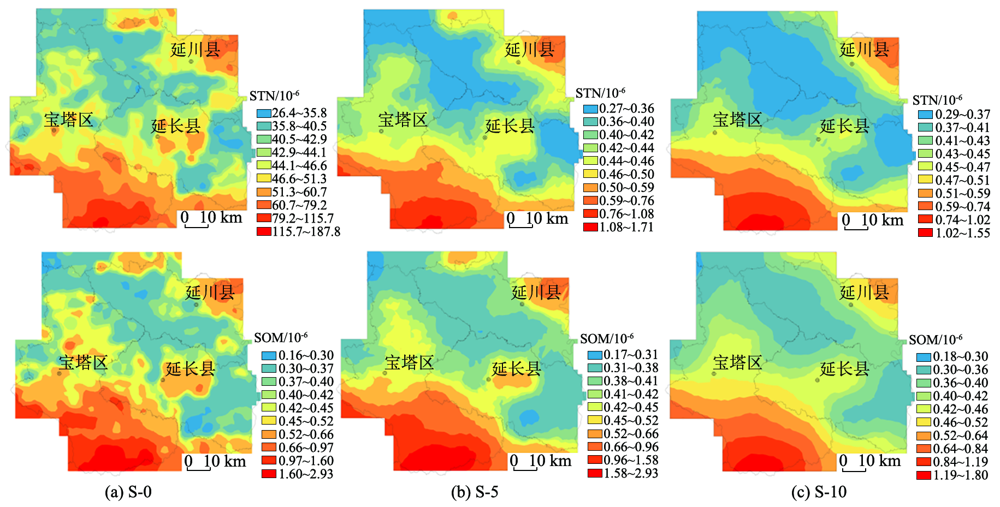
Spatial distribution of SOM and STN contentsat S-0、S-5、S-10 scales
|
|
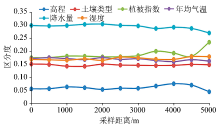
Differentiation of SOM and STN content by influencing factors
|
| 影响因素 | 指标 | S-0 | S-1 | S-2 | S-3 | S-4 | S-5 | S-6 | S-7 | S-8 | S-9 | S-10 | | 土壤类型 | 有机质 | 13/21 | 12/21 | 10/21 | 9/21 | 5/21 | 3/21 | 1/21 | 0/21 | 0/21 | 0/21 | 0/21 | | 全氮 | 8/21 | 8/21 | 7/21 | 6/21 | 5/21 | 2/21* | 2/21 | 0/21* | 0/21 | 0/21 | 0/21 | | 植被指数 | 有机质 | 6/6** | 6/6** | 6/6*** | 5/6*** | 5/6*** | 4/6*** | 4/6*** | 4/6*** | 3/6*** | 3/6*** | 3/6*** | | 全氮 | 5/6** | 5/6** | 5/6** | 5/6** | 5/6*** | 5/6*** | 5/6*** | 5/6*** | 3/6*** | 4/6*** | 3/6*** | | 年均气温 | 有机质 | 5/6 | 5/6 | 5/6 | 4/6 | 4/6 | 3/6 | 2/6 | 3/6 | 1/6 | 1/6 | 1/6 | | 全氮 | 3/6 | 3/6 | 3/6 | 2/6 | 3/6 | 2/6 | 0/6 | 0/6 | 0/6 | 0/6 | 0/6 | | 降水量 | 有机质 | 6/6** | 6/6** | 6/6** | 6/6** | 5/6** | 5/6** | 5/6*** | 5/6** | 4/6*** | 4/6*** | 4/6*** | | 全氮 | 6/6** | 6/6** | 6/6** | 6/6** | 6/6** | 5/6** | 5/6** | 4/6*** | 4/6** | 4/6** | 3/6*** | | 湿度 | 有机质 | 6/6** | 6/6** | 6/6** | 6/6** | 6/6** | 6/6** | 5/6** | 5/6** | 5/6** | 4/6** | 4/6** | | 全氮 | 6/6** | 6/6** | 6/6** | 6/6** | 6/6** | 5/6** | 5/6** | 4/6** | 5/6** | 4/6** | 4/6** | | 海拔 | 有机质 | 6/6 | 6/6 | 6/6 | 4/6 | 4/6 | 3/6 | 3/6 | 2/6 | 2/6 | 2/6 | 1/6 | | 全氮 | 5/6 | 5/6 | 3/6 | 3/6 | 2/6 | 2/6 | 1/6 | 1/6 | 0/6 | 1/6 | 0/6 |
|
Statistical significance of SOM and STN at different scales and different levels of influencing factors
|
| [1] |
齐雁冰, 常庆瑞, 刘梦云, 等. 县域农田土壤养分空间变异及合理样点数确定[J]. 土壤通报, 2014, 45(3):556-561.
|
| [1] |
Qi Y B, Chang Q R, Liu M Y, et al. County-scale spatial variability of soil nutrient distribution and determination of reasonable sampling density[J]. Chinese Journal of Soil Science, 2014, 45(3):556-561.
|
| [2] |
张法升, 刘作新. 分形理论及其在土壤空间变异研究中的应用[J]. 应用生态学报, 2011, 22(5):1351-1358.
|
| [2] |
Zhang F S, Liu Z X. Fractal theory and its application in the analysis of soil spatial variability:A review[J]. Chinese Journal of Applied Ecology, 2011, 22(5): 1351-1358.
|
| [3] |
Heuvelink GBM, Webster R. Modelling soil variation:Past, present and future[J]. Geoderma, 2001, 100: 269-301.

|
| [4] |
Jenny H. Factors of soil formation:A system of quantitative pedology[M]. New York: Dover Publications, 1994.
|
| [5] |
姜秋香, 付强, 王子龙. 空间变异理论在土壤特性分析中的应用研究进展[J]. 水土保持研究, 2007, 14(4): 413-415.
|
| [5] |
Jiang Q X, Fu Q, Wang Z L. Research progress of the spatial variability theory in application to soil characteristic analysis[J]. Research of Soil and Water Conservation, 2007, 14(4): 413-415.
|
| [6] |
霍霄妮, 李红, 张微微, 等. 北京耕作土壤重金属多尺度空间结构[J]. 农业工程学报, 2009, 25(3):223-229.
|
| [6] |
Huo X N, Li H, Zhang W W, et al. Multi-S spatial structure of heavy metals in Beijing cultivated soils[J]. Transactions of the CSAE, 2009, 25(3): 223-229.
|
| [7] |
潘瑜春, 刘巧芹, 阎波杰, 等. 采样尺度对土壤养分空间变异分析的影响[J]. 土壤通报, 2010, 41(2):257-262.
|
| [7] |
Pan Y C, Liu Q Q, Yan B J, et al. Effects of sampling S on soil nutrition spatial variability analysis[J]. Chinese Journal of Soil Science, 2010, 41(2): 257-262.
|
| [8] |
雷咏雯, 危常州, 李俊华, 等. 不同尺度下土壤养分空间变异特征的研究[J]. 土壤, 2004, 36(4):376-381.
|
| [8] |
Lei Y W, Wei C Z, Li J H, et al. Characters of soil nutrient spatial variability in different S[J]. Soil, 2004, 36(4): 376-381.
|
| [9] |
刘伟, 郜允兵, 周艳兵, 等. 农田土壤重金属空间变异多尺度分析——以北京顺义土壤Cd为例[J]. 农业环境科学学报, 2019, 38(1):87-94.
|
| [9] |
Liu W, Gao Y B, Zhou Y B, et al. Multi-S analysis of spatial variability of heavy metals in farmland soils: Case study of soil Cd in Shunyi District of Beijing,China[J]. Journal of Agro-Environment Science, 2019, 38(1): 87-94.
|
| [10] |
郑袁明, 陈煌, 陈同斌, 等. 北京市土壤中Cr、Ni含量的空间结构与分布特征[J]. 第四纪研究, 2003, 23(4):436-445.
|
| [10] |
Zheng Y M, Chen H, Chen T B, et al. Spatialdistribution patterns of Cr and Ni in soils of beijing[J]. Quaternary Sciences, 2003, 23(4): 436-445.
|
| [11] |
陈涛, 常庆瑞, 刘钊, 等. 耕地土壤有机质与全氮空间变异性对粒度的响应研究[J]. 农业机械学报, 2013, 44(10):122-129.
|
| [11] |
Chen T, Chang Q R, Liu Z, et al. Spatial variablility response of farmland soil organic matter and total nitrogen to sampling grain size[J]. Transactions of the Chinese Society for Agricultural Machinery, 2013, 44(10):122-129.
|
| [12] |
王鹏, 刘拓, 邱德明. 基于局部惩罚型变权的建设用地生态适宜性空间模糊评价——以陕西延安宝塔区为例[J]. 西北地质, 2021, 54(1):232-241.
|
| [12] |
Wang P, Liu T, Qiu D M. Spatial fuzzy assessment of ecological suitability for urban land based on local penalty variable weights:A case study of Baota district[J]. Northwestern Geogloy, 2021, 54(1):232-241.
|
| [13] |
杨奇勇, 杨劲松, 刘广明. 土壤速效养分空间变异的尺度效应[J]. 应用生态学报, 2011, 22(2):431-436.
|
| [13] |
Yang Q Y, Yang J S, Liu G M. S-dependency of spatial variability of soil available nutrients[J]. Chinese Journal of Applied Ecology, 2011, 22(2): 431-436.
|
| [14] |
Antonio P M. Spatial variability patterns of phosphorus and potassium in no-tilled soils for two sampling scales[J]. Soil Science Society of America Journal, 1996, 60(5): 1473-1481.
|
| [15] |
李小昱, 雷廷武, 王为. 农田土壤特性的空间变异性及分形特征[J]. 干旱地区农业研究, 2000, 18(4): 61-65.
|
| [15] |
Li X Y, Lei T W, Wang W. Spatial variablelity and fractal dimension of soil property in field[J]. Agricultural Research in the Arid Areas, 2000, 18(4): 61-65.
|
| [16] |
沈思源. 土壤空间变异研究中地统计学的应用及其展望[J]. 土壤学进展, 1989, 17(3):11-25.
|
| [16] |
Shen S Y. Application and prospect of geostatistics in soil spatial variability research[J]. Advances in Soil Science, 1989, 17(3): 11-25.
|
| [17] |
盛建东, 肖华, 武红旗, 等. 不同取样间距农田土壤全量养分空间变异特征研究[J]. 土壤通报, 2006, 37(6):1062-1065.
|
| [17] |
Sheng J D, Xiao H, Wu H Q, et al. Spatial variability of total nutrients in arable soil as affected by different sampling distances[J]. Chinese Journal of Soil Science, 2006, 37(6) : 1062-1065.
|
| [18] |
李雅琦, 田均良, 刘普灵. 黄土高原土壤元素含量地域分异规律[J]. 西北农业学报, 2000, 9(3):63-66.
|
| [18] |
Li Y Q, Tian J L, Liu P L. A Study on laws of regional variance of soil element in loess plateau through trend surface analysis method[J]. Acta Agriculturae Boreali-occidentalis Sinica, 2000, 9(3):63-66.
|
| [19] |
王鹏, 段星星, 赵禹, 等. 治沟造地新增耕地的土壤质量评价——延安宝塔区为例[J]. 土地开发工程研究, 2019, 4(1):41-45.
|
| [19] |
Wang P, Duan X X, Zhao Y, et al. The evaluation of soil nutrient status in newly reclaimed land from trench construction:Taking Baota district of Yan'an city as example[J]. Land Development and Engineering Research, 2019, 4(1):41-45.
|
| [20] |
陈云坪, 王秀, 马伟, 等. 小麦多年产量空间变异与空间关联分析[J]. 农业机械学报, 2010, 41(10):180-184.
|
| [20] |
Chen Y P, Wang X, Ma W, et al. Spatial autocorrelation analysis of wheat yield over five years[J]. Transactions of the Chinese Society for Agricultural Machinery, 2010, 41(10): 180-184.
|
| [21] |
Burrough P A. Multiscale sources of spatial variation in soil. I. The application of fractal concepts to nested levelsof soil variation[J]. European Journal of Soil Science, 1983, 34: 577-597.
|
| [22] |
张忠启. 采样点布设与区域土壤有机碳变异性研究[M]. 北京: 科学出版社, 2019:110-128.
|
| [22] |
Zhang Z Q. Sampling site arrangement and regional soil organic carbon variability[M]. Beijing: Science Press, 2019:110-128.
|
| [23] |
Lei G, Shao M A. The interpolation accuracy for seven soil properties at various sampling Ss on the Loess Plateau, China[J]. Journal of Soils and Sediments, 2012, 12(2): 128-142.
|
| [24] |
Daniels, Lee W. The Nature and Properties of Soils, 15th Edition[J]. Soil Science Society of America Journal, 2016, 80(5):1428.
|
| [25] |
李元年. 基于熵理论的指标体系区分度测算与权重设计[D]. 南京: 南京航空航天大学, 2008.
|
| [25] |
Li Y N. Evaluation and weight design of index system based on entropy theory[D]. Nanjing: Nanjing University of Aeronautics and Astronautics, 2008.
|
| [26] |
王鹏, 刘拓, 段星星, 等. 基于熵权的土壤养分地球化学多级模糊综合评判——以陕西省关中地区为例[J]. 水土保持通报, 2019, 39(6):136-141.
|
| [26] |
Wang P, Liu T, Duan X X, et al. Multi-stage fuzzy comprehensive evaluation of soil nutrient geochemistry based on entropy weight:Take Guanzhong region for example[J]. Bulletin of Soil and Water Conservation, 2019, 39(6):136-141.
|
| [27] |
金继运, 白山路. 精准农业与土壤养分管理[M]. 北京: 中国大地出版社, 2001:5l-57.
|
| [27] |
Jin J Y, Bai S L. Precision agriculture and soil nutrient management[M]. Beijing: China Dadi Publishing House, 2001:5l-57.
|
| [28] |
王鹏, 刘拓. 延安市宝塔区土壤养分地球化学评价中的变权效果[J]. 物探与化探, 2020, 44(4):847-854.
|
| [28] |
Wang P, Liu T. Variational weight effect in the geochemical evaluation of soil nutrients in Baota District of Yan'an City[J]. Geophysical and Geochemical Exploration, 2020, 44(4):847-854.
|
| [1] |
YANG Ze, ZHANG Yi-He, DAI Hui-Min, LIU Guo-Dong, LIU Kai, XU Jiang. Control factor of the spatial variations in the soil organic carbon content in the topsoil of the Xingkai Lake Plain[J]. Geophysical and Geochemical Exploration, 2022, 46(5): 1076-1086. |
| [2] |
JIANG Xiao-Jia, CHEN Xin, ZHENG You-Ye, GAO Shun-Bao, OUYANG-Song, ZHANG Yong-Chao, ZHENG Lei, HUANG Jian. The recognition and extraction of Au, Cu geochemical composite anomalies:A case study of the east of Laji Mountains[J]. Geophysical and Geochemical Exploration, 2017, 41(3): 459-467. |
|
|
|
|