

0 引言
我国金属和非金属矿山的开采以露天开采为主,滑坡事故严重威胁着露天矿的安全生产。国家安监总局要求,边坡高度200 m以上的露天矿山高陡边坡、堆置高度200 m以上的排土场、三等及以上等级的尾矿库,必须进行在线监测,定期进行稳定性分析[1]。建立在地球物理勘探基础上的综合评判方法,是近年来兴起的一种边坡稳定性分析方法,深受矿山现场的青睐。而高密度电法因其操作简单、探测深度大、数据处理简便等特点,在矿山上得到广泛应用。
传统的高密度电法要求测线布置在水平地面上,并且测线要平直,不出现弯曲[2-3]。但在生产实际中,难免出现起伏地形,为此,一般采用有限元法、立体投影法以及各种实验方法来解决这一问题。露天矿边坡的地形比较特殊,一边是高一级台阶的坡面,另一边是面向矿坑的临空面,是一种人工形成的台阶地形。由于场地限制,露天矿边坡采用高密度电法勘探时,只能沿清扫平台布线,且测线很难做到长距离平直,在这种情况下,测线下边坡内的电流分布会与水平地面下的电流分布有很大差异。传统的高密度电法正反演理论均是建立在水平无限地面这一基本假设上的,因此用于处理露天矿台阶时,在理论基础层面上就存在偏差,后期处理出来的解释结果将存在很大程度的畸变。地下稳定电流场的分布情况,由于无法直接探测,一般采用类比光学规律的“电像法”或“镜像法”进行求解,但其结论能否作为一般物理规律尚存在疑问。刘方文等[4]认为,稳定电流场反射现象起因于电性界面上积累的体电荷产生的畸变电场,此外的稳定电流场的矢量成分的折射满足折射定律;当考虑到畸变电场时,以水平分界面为基准得到的折射、反射等定律仅在特定条件下适用,不具备普适性。许多学者针对地下稳定电流场问题进行了研究[5⇓⇓⇓⇓⇓⇓⇓-13]。
1 实验原理及模型依据
水槽模型实验是将模型、场源和工作装置布置在盛水的水槽内进行观测的一种物理模拟方法。因为水不是良导体,其导电率小,而且水的导电率各向分布均匀,探针插入水中不影响水的导电性,所以水槽模型实验是常用的一种模拟实验方法。它通常用水做均匀介质来模拟均匀围岩,因此该方法适用于模拟在均匀各向同性的半无限介质中含有良导体和不良导体的情况。
图1
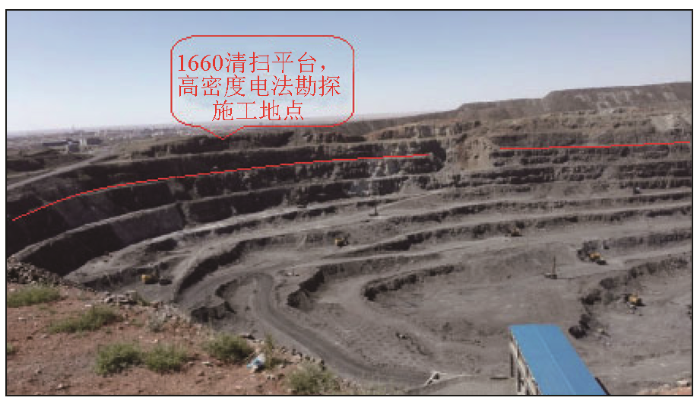
图2
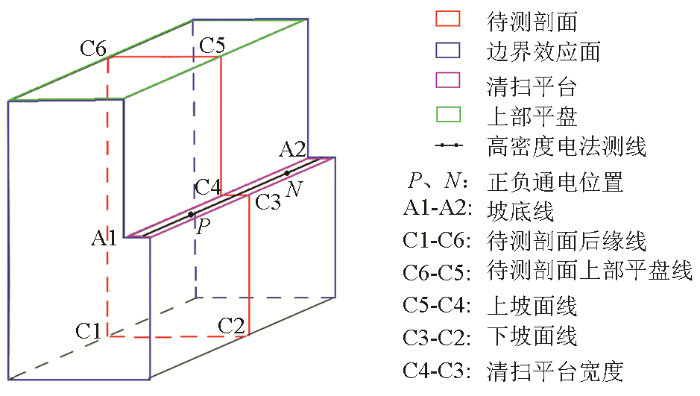
图3
2 水槽实验模型
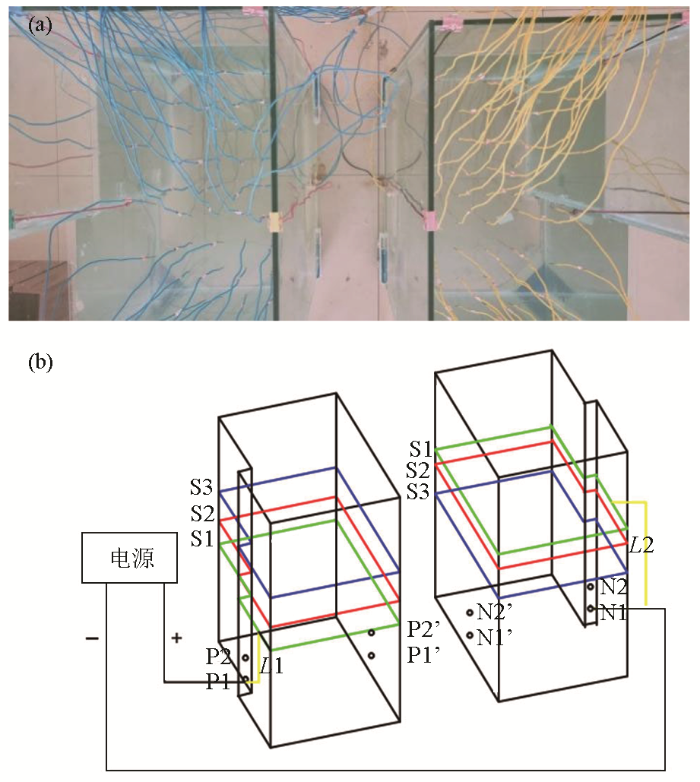
如图3所示,直流电源的正极接到P1处,负极接到N1处,左右两侧水槽的水位均加到图中所示绿色框线处,此时左侧水槽的P1点到水面的距离为L1,右侧水槽的N1点到水面的距离为L2,L1+L2=C。在改变实验参数时,此处的C保持不变,表示按照比例缩小的高密度电法勘探时的加电电极距,若L1/L2=3,表示截面位置位于两个加电电极之间的左侧1/4位置处。
在水槽上设有2组不同高度的通电位置,P1、N1、P1'、N1'为低通电位置,P2、N2、P2'、N2'为高通电位置。水槽上分为3个截面:1/4截面S1、 1/3截面S2、 1/2截面S3。布置大、小两组不同的加电电极距C,分别为78 cm和48 cm。通电位置及截面参数见表1。
表1 水槽通电位置及截面参数
Table 1
| 通电位置 | 通电位 置编号 | 通电位置离 地高度/cm | 水面离地高度/cm | |||
|---|---|---|---|---|---|---|
| 水槽 | 1/4截面 | 1/3截面 | 1/2截面 | |||
| 低通位置 | P1、N1、 P1'、N1' | 7 | 左槽 | 26.5 | 33 | 46 |
| 右槽 | 65.5 | 59 | 46 | |||
| 高通位置 | P2、N2、 P2'、N2' | 31 | 左槽 | 50.5 | 57 | 70 |
| 右槽 | 89.5 | 83 | 70 | |||
图4
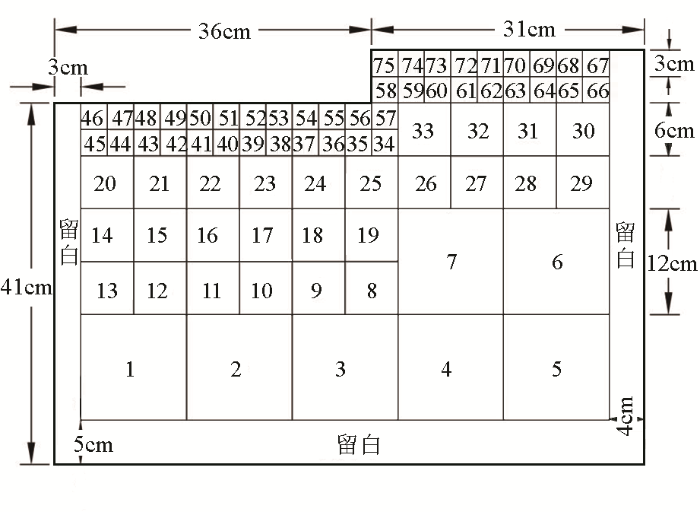
将电源的正、负极分别连接水槽,导线固定板悬垂到水面,令导线裸露端接触水面,并且用接线端子连接两块板之间的铜导线,电流从P1(+)流入,流经各个点位及分路,最后从N1(-)流出,形成并联电路。用万用表分别测出各路的电流I,算出对应点位的网格面积S,根据公式J=I/S即可计算出待测剖面上该网格处的近似电流密度J。
3 对比实验及结果分析
3.1 边界效应对比实验
在露天矿边坡处,台阶的上部平盘、上下坡面、清扫平台处的岩土与空气分界面是真实存在的,其余位置不存在这种分界面。但是在相似材料模拟时,受模型尺寸限制,需要人为制造分界面,这些人为制造的分界面对模拟结果的准确性存在影响,这种影响在本文所定义的两个边界效应面处尤其明显。
为了研究这两个边界效应面对高密度电法反演结果的影响,需要对比高、低通电位置的实验结果。由于一组对照难以说明情况,因此分别选择高、低通电位置的1/2截面和1/3截面做对比实验,实验参数如表2所示。
表2 边界效应研究实验
Table 2
| 实验 | 边界效应研究 |
|---|---|
| (1)P1(+)和N1(-),1/2截面 | (1)和(3)对比 (2)和(4)对比 |
| (2)P1(+)和N1(-),1/3截面 | |
| (3)P2(+)和N2(-),1/2截面 | |
| (4)P2(+)和N2(-),1/3截面 |
观察测出的实验数据,可以发现一部分区域会出现尖峰、低谷或波动,分析其原因可能为:①由于受实验条件限制,不能准确控制使得导线插入水中的深度保持一致,且无法保证导线垂直地“站”在水面上;②水中杂质也会影响所测实验结果;③电流遇不同界面出现反射现象,反射回来的不同电流出现干涉现象。考虑这些影响因素,剔除畸变数据后,可得到相对准确的实验数据,并据此绘制三维图和平面图。通过对实验数据的分析,发现1/2截面和1/3截面所呈现出的电流密度分布规律是相似的,因此文中仅针对1/2截面进行分析。
本次对比实验的1/2截面电流密度分布如图5示。经分析,可得如下规律。
图5
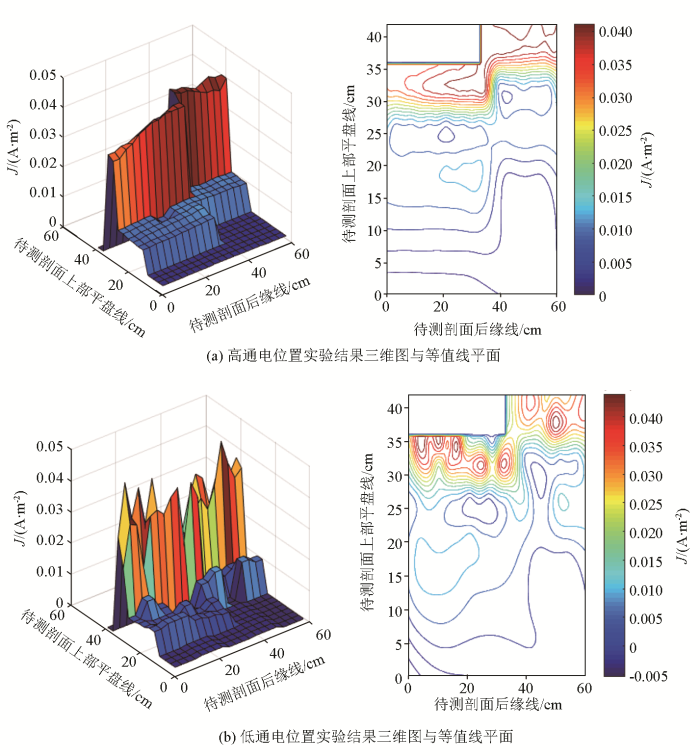
1)待测剖面上的所有位置处均可测得数值,由此表明在台阶地形下,电流不像水平大地仅仅垂直向下传播,而是向待测剖面内的所有位置传播。
2)等值线平面反映了电流密度大小与空间的关系,其中黄色曲线的形状近似为台阶状。黄色曲线到上、下坡面线,清扫平台宽度线之间的区域数量级为10-2,黄色曲线以外,向边坡深处的方向,电流密度数量级为10-3,表明待测剖面内的电流密度依台阶形状,离开上下坡面越远,电流密度越小。
3)黄色曲线处的等高线明显要比其他区域的密,即在该区域附近电流密度变化急剧,在远离上下坡面线的方向上,电流急剧衰减。
图5显示,接高通电位置测出的数据比接低通电位置测出的数据更具有规律性,接低通电位置测出的数据部分区域数值特别小,部分区域数值特别大。由此可说明通电位置靠近边界测出的数据波动大,且杂乱无章,容易产生边界效应,规律不清晰,故而之后的实验只连接高通电位置来测数据。
3.2 不同地形对比实验
表3 地形对比实验参数
Table 3
| 实验 | 地形对比 |
|---|---|
| (1)P2(+)和N2(-),1/2截面 | (1)和(3)对比 (2)和(4)对比 |
| (2)P2(+)和N2(-),1/3截面 | |
| (3)P2’(+)和N2’(-),1/2截面 | |
| (4)P2’(+)和N2’(-),1/3截面 |
图6
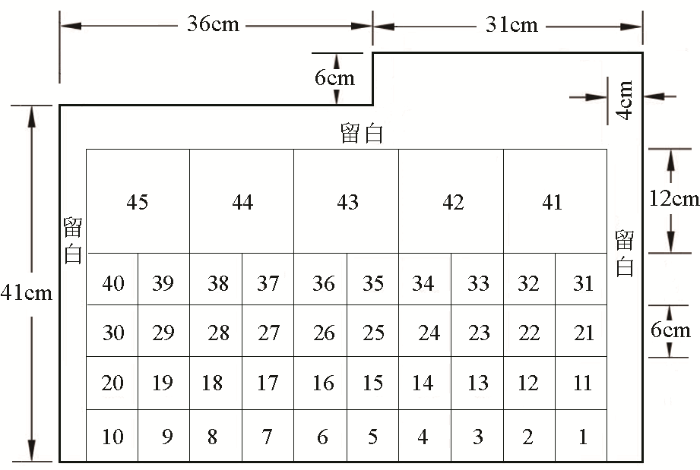
图7
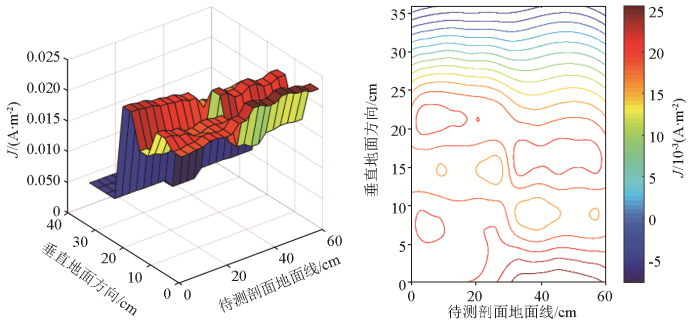
图7
平面地形实验结果三维图与等值线平面
Fig.7
Three-dimensional and contour figure from plane topographic experiment
1)在平面地形下的实验同样可测出有规律的数值,表明在平面地形下,电流都不仅仅是仅沿测线方向垂直向下传播,也向水平地形下的待测剖面内部各方向传播。
3)由接P2'和N2'测出的数据经插值处理所作的等值线图中可发现,平面地形待测剖面内的电流密度由通电位置(即点电源)向两边呈等距递减趋势,且远离地面方向的电流密度也逐渐减小。
3.3 含高、低阻异常体的对比实验
由地形影响实验可知,台阶下的电流场分布规律与平面地形的电流场分布规律不同,而且表明应用高密度电法勘探时电流方向不仅仅是垂直向下的,测出的数据不仅仅反映的是测线下纵向切面的地质构成。为了进一步研究台阶对电流密度分布的影响,设置了含高阻体和低阻体的实验,其中高阻体采用塑料板制成,其电阻率为
表4 含高阻或低阻地层的实验
Table 4
| 实验 | 含高阻或低阻地层 |
|---|---|
| (1)P2(+)和N2(-),1/2截面 | (1)、(2)、(3)对比 |
| (2)P2(+)和N2(-),1/3截面 | |
| (3)P2(+)和N2(-),1/4截面 |
首先进行含高阻体的实验。在水槽中平行于待测剖面放置一块30 cm×40 cm×2 mm的塑料薄板,薄板距离待测剖面20 cm。将观察测出的实验数据剔除畸变数据后进行插值处理,结果见图8。分析可得:①含高阻地层的实验所得待测剖面的各个位置、各个方向的电流密度都比均匀地层实验相对区域所得的电流密度小;②待测剖面内,靠近台阶转折区域的电流密度明显要比其他区域的电流密度大,呈现出一定的边界效应,电流密度由通电位置向台阶内部区域逐渐减小,沿上坡面线往上部平盘线的方向以及沿下坡面线向下的方向,均呈递减趋势。
图8
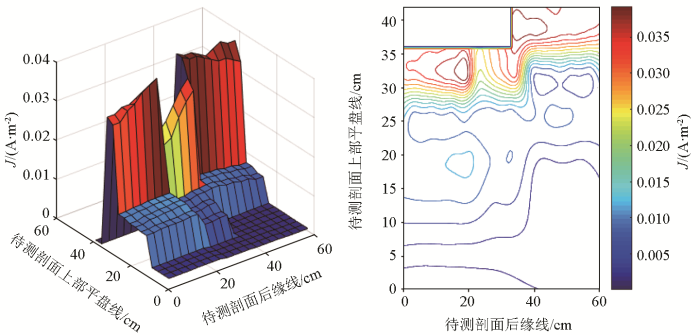
图8
含高阻地层实验结果三维图及等值线平面
Fig.8
Comparison diagram of the experimental results of uniform strata and high-resistance strata
含低阻体的实验是在水槽中与高阻体相同的位置上放置一块30 cm×40 cm×1 mm的薄钢板,其余参数与含高阻地层的实验相同。实验结果见图9。通过比对分析,并参考其他同参数的不同断面,可得如下结论:①在距薄钢板较远的区域薄板对电流分布影响小,其电流密度与均匀地层实验相对区域的电流密度基本相等;在逐渐靠近薄板的区域,由于良导体薄脉向下吸引电流,电流密度呈增大趋势。②靠近台阶转折区域的电流密度相对其他区域的电流密度大。③含低阻体的待测剖面内的电流密度在所有位置都比含高阻体的待测剖面大。
图9
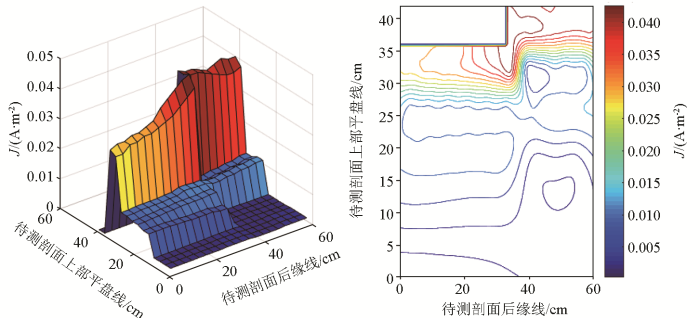
图9
含低阻地层实验结果三维图及等值线平面
Fig.9
Comparison of experimental results of uniform and low resistance strata
由含异常体的实验可看出,高阻或低阻地层会对电流分布产生影响,进一步说明地下稳定电流场的分布情况可类比光学规律的“电像法”或“镜像法”,稳定电流场在遇到电性分界面时,会发生反射和透射现象。电流场的矢量成分遇不同界面发生反射,反射回来的不同电流场矢量成分发生干涉,从而可以在断面上测得电流值,进而计算出电流密度。
4 结论
本文在既有的稳定电流场反射、折射等物理规律及对典型地形模型的电场解析计算方法的理论基础上,设计了3组对比实验来研究露天矿台阶对高密度电法勘探电流分布的影响,通过对实验结果的分析,可得到如下基本规律:
1)以上实验都可测得有规律的数值,由此证实露天矿台阶下,稳定电流场存在反射、透射和衍射现象;电流场的矢量成分遇不同界面发生反射,反射回来的不同电流场矢量成分发生干涉,从而可在断面上测得电流值,并计算出电流密度。
2)在露天矿台阶下,靠近台阶转折位置的电流密度比其他位置的电流密度大,电流容易在台阶转折位置聚集。
3)在露天矿台阶下的实验与在平面地形下的实验相比,在露天矿台阶下测出的电流密度偏大,表明在露天矿台阶下,用高密度电法实测时,地形因素对电流场分布会产生显著影响。
4)当异常体在通电位置正下方时,与不含异常体的实验相比,其数据变化比较明显,但是当异常体远离通电位置时,数据变化不太明显。这种现象表明在现场实测时,测线相对位置对于待勘测地下灾害源分布的准确测定影响很大。
受实验条件限制,基于露天矿台阶的电流场分布的计算公式需进一步研究考证。若获得高密度电法勘探时露天矿台阶内的电流场分布规律及计算公式,根据其规律进行地形校正,将可以使高密度电法对露天矿边坡灾害源的勘探更加精准可靠,为露天矿的边坡稳定评估工作提供良好的依据。
参考文献
非煤矿山领域遏制重特大事故工作方案
[R].
Work plan for curbing major accidents in non coal mining areas
[R].
综合电法在安徽西湾铅锌矿勘探中的应用
[J].
Application of comprehensive electric method in the exploration of the Xiwan lead-zinc deposit in Anhui Province
[J].
超高密度电法在上覆型岩溶勘察中的应用
[J].
Application of ultra-high density resistivity method in overlying Karst exploration
[J].
稳定电流场的反射、透射、衍射——波动性
[J].
Reflection,transmission and diffraction—Fluctuation of steady current field
[J].
论稳定电流场的入射、反射、透射间的关系
[J].
On the relationship among incidence,reflection and transmission of stable current field
[J].
稳定电流场的拟线性近似方法研究
[J].
Study of pseudo-linear approximate method for stable current field
[J].
三维地电体的静电场数值计算
[J].
Static electric field numerical calculation of three-dimensions geoelectric object
[J].
中国煤炭电法勘探36年发展回顾
[J].
Review on the development of Chinese coal electric and electromagnetic prospecting during past 36 years
[J].
高密度电法探测露天矿地下水的应用研究
[J].
Study on application of high density electrical method in detecting groundwater in open pit
[J].
综合电法在岩溶山区地下水勘探中的应用—以湖南怀化长塘村为例
[J].
The application of electrical prospecting method to groundwater exploration in Karst mountainous areas:A case study of Changtang Village,Huaihua area,Hunan Province
[J].
电法勘探地形影响问题研究进展
[C]//
A review of progress in research on terrain effects in electric and electromagnetic explorations
[C]//
起伏对高密度电法探测地下岩溶管道的影响试验研究
[J].
Experimental study on influence of terrain fluctuation to high-density resistivity method for detecting underground karst pipes
[J].
包头市固阳县矿集区高密度电阻率法找水定井实例分析
[J].
A case analysis of multielectrode resistivity method for determining a well location in groundwater prospecting in the ore concentration area of Guyang County,Baotou City
[J].
Addenda to the paper:The topographic effect in resistivity prospecting
[J].
覆岩变形破坏电阻率响应特征的模拟实验研究
[J].
Simulation experiment on the response of resistivity to deformation and failure of overburden
[J].
有渗漏隐患黏土堤坝电阻率模拟试验及分析
[J].
Simulation test and analysis of resistivity of clay dam with hidden leakage trouble
[J].
龙门山断裂带及其邻区电性结构特征
[J].
Electrical structure characteristics of Longmen fault zone and its adjacent areas
[J].
考虑降雨入渗的非饱和土边坡流固耦合数值分析
[J].
Fluid solid coupling numerical analysis of unsaturated soil slope considering rainfall infiltration
[J].
裂隙膨胀土边坡的湿热耦合特性及稳定性研究
[J].
Moisture-heat coupling feature and stability of expansive soil slope with fissures
[J].
Topographic effects in resistivity and induced-polarization surveys
[J].
DOI:10.1190/1.1441041
URL
[本文引用: 1]

We have made a systematic study of dipole‐dipole apparent resistivity anomalies due to topography and of the effect of irregular terrain on induced‐polarization (IP) anomalies, using a two‐dimensional (2-D), finite‐element computer program. A valley produces a central apparent resistivity low in the resistivity pseudosection, flanked by zones of higher apparent resistivity. A ridge produces just the opposite anomaly pattern—a central high flanked by lows. A slope generates an apparent resistivity low at its base and a high at its top. Topographic effects are important for slope angles of 10 degrees or more and for slope lengths of one dipole‐length or greater. The IP response of a homogeneous earth is not affected by topography. However, irregular terrain does affect the observed IP response of a polarizable body due to variations in the distance between the electrodes and the body. These terrain‐induced anomalies can lead to erroneous interpretations unless topography is included in numerical modeling. A field case demonstrates the importance of including topography, where it is significant, in interpretation models. A technique for correcting apparent resistivity for topographic effects uses the finite‐element program to compute correction factors.
Calculation of electrical potentials along a longitudinal section of a 2-D terrain
[J].
DOI:10.1190/1.1468611
URL
[本文引用: 1]
The problem of 2-D terrain corrections for point-source electric resistivity data is considered. The total electric potential is divided into normal and anomalous terms. An integral equation is derived for the Fourier transform of the anomalous potential and is solved using a boundary element method. An inverse Fourier transform is applied to recover the anomalous potential along a “longitudinal” profile passing through the point source and oriented perpendicular to the vertical plane containing the 2-D terrain variations. The sum of the normal and anomalous potentials are then used to calculate an apparent resistivity. A sample calculation demonstrates that the longitudinal apparent resistivity calculated in this manner is less sensitive to terrain variations than the traditional “transverse” apparent resistivity that is computed from potential measurements made parallel to the vertical plane containing the 2-D terrain variations.
