

0 引言
由于重、磁异常资料是地质人员对区域进行定性解释和定量解释的基础,故异常资料的质量问题显得十分重要。目前利用重、磁异常资料进行区域地质解释、寻找油气与矿产,所以重、磁数据资料的质量问题一直受到学者们的重视[1]。不仅如此,利用重、磁数据还可提高对海洋区域和大陆区域的结构和演化的理解。修订后的异常数据之间的差异不会影响局部异常的解释,但可以改善区域异常研究[2]。高分辨率的磁力和重力数据可以揭示更多未知的地质结构,其中磁力数据可反映磁性岩石从地表到居里面任意深度的岩石分布,且磁力图和重力图包含了许多关于构造元素的特征[3⇓⇓-6]。EMAG2作为全球第一个被纳入Google和NASA World的磁异常网格数据文件,被选为官方世界数字磁异常图的基础网格,是CHAMP(具有挑战性的微型卫星有效载荷)卫星磁异常模型MF6(波长>330 km)的汇编,覆盖范围极广[7]。EMAG2也是对先前的世界数字磁异常图候选网格的重大更新,由卫星、舰船和航空磁测量数据编译而成,反映了大地水准面上方4 km高度处的磁异常,其对NGDC的WDMAM候选网格进行了显著改进,具体表现在:在海洋地壳年龄模型基础上,EMAG2利用定向网格化与外推法对海洋中稀疏的轨迹线进行了改进,分辨率从3弧分(大约5.5 km)提升至2弧分(约3.7 km),其中地磁异常网格(EMAG2 弧分)使用了总磁强度图生成了RTP图,RTP图消除了由研究区域中的感应磁场和环境磁场引起的不对称性[8⇓⇓⇓⇓-13]。以往的EMAG2磁异常数据依赖于已知或理想化的局部地质数据,并将异常插值到无数据的区域,而EMAG2v3仅依赖于可用的数据,因此,最新的EMAG2v3可以更好反映这些异常的复杂性(尤其是在海洋区域),并准确反映尚未收集到数据的区域。而斯克里普斯海洋研究所发布的最新全球重力数据库融合了大量测量年代较早的地面重力数据和航空重力数据,其中布格重力数据、自由空气和大地水准面异常数据已被广泛用于岩石圈成像和上地幔密度结构研究[14-15],且全球重力数据库V29中的重力网格数据已被用作研究北大西洋自由空气重力异常的基础数据[16⇓-18]。
本文基于EMAG2v3磁异常数据与V29重力异常数据,并选用Aegir轴裂谷及邻区约150 km区域范围的重、磁测量数据,通过对研究区域的EMAG2v3磁异常数据与船测磁异常数据、V29重力异常数据与船测异常数据分别进行相关性分析与差值对比,进而对两种数据库数据进行质量评估。
1 方法与技术
1.1 插值与白化(surfer)
由于数据集中分布在Aegir轴裂谷及两侧各约150 km的范围内,故将(-10°N~0°N,64°W~68°W)区域数字化框图成形,对EMAG2v3和船测磁力异常数据、全球重力数据库V29和船测重力异常数据、相关分析网格图件和差值异常网格图件进行白化处理,得到数据所在范围的结果图,再对数据所在范围及白化框内区域数据进行统计,如图1所示,得到了磁力和重力相关分析、差值范围的占比数据。对异常数据进行多次试验,确定网格线范围为(x:-10°N~0°N,y:64°W~68°W),x与y方向间距均为0.02°,其中搜索椭圆参数:半径1为0.5°,半径2为2.5°,角度为-15°,此时半径1与主要测线的方向较为一致,且异常效果较好。
图1
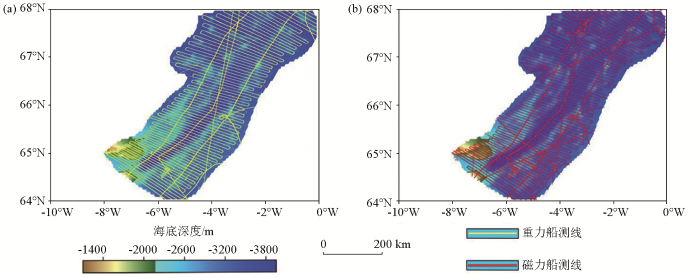
图1
Aegir轴裂谷海底地形及重力测线(a)和磁力测线(b)分布
Fig.1
The seafloor topography and the distribution of gravity survey lines (a) and magnetic survey lines (b) in the Aegir axis rift
本文使用的是常用内插方法之一的克里金插值法,克里金法可分为简单克里金和普通克里金,两者的区别在于插值的定义方式。本文使用的是普通克里金法,其插值公式为:
其中:
不同克里金插值法的主要差异之处在于假设条件不同,普通克里金插值法通常假设空间属性z是均匀一致的,对于空间任意一点
而普通克里金法的假设条件为:任意一点处的值
其中:
1.2 相关分析法
为了对EMAG2v3与船测磁力异常数据、全球重力数据库V29和船测重力异常数据之间的相关性分别进行研究分析,本文使用了相关分析方法。
相关分析的结果可用来反映测区内地形起伏对重力异常的影响情况,以及地形改正是否完全或改算方法是否完善。不同对象间的相互联系常表现为一定的公式关系,假设x为变量中随机一个或几个起着影响作用的变量,y为与其有相互联系的另一变量,设R为相关关系系数,用于衡量x、y两变量之间的相关性大小,相关分析公式为:
其中:
2 对比与分析
研究区位于挪威盆地西部、扬马延微陆块东部海域,地理坐标为-10°N~0°N,64°W~68°W,面积约为15.3×10⁴ km2。本文系统整理分析了已有的船测重力、卫星测高重力(美国斯克里普斯海洋研究所于2021 年发布的全球重力数据库V29)、船测磁力、美国国家环境信息中心(National Centers for Environmental Information,NCEI)于2017年发布的地球磁异常网格第3版(Earth magnetic anomaly grid at 2 arc minute resolution version 3,EMAG2v3)资料,编制了Aegir脊磁力异常(图2)与自由空气重力异常(图3)。其中,沿着Aegir 脊开展了覆盖宽度约 154 km、长度约564 km的船测重力和船测磁力工作,图1为研究区海底地形及重、磁测线分布,其中船测磁力测线间距约为7.5 km,点距约为0.71 km;船测重力测线间距约为7.5 km,点距约为0.66 km,两种数据测量比例尺相同,约为1∶100万;而全球重力数据库V29中海域重力数据为卫星测高重力数据,精度约在4×10⁻⁵/s2,空间分辨率接近8 km,比例尺优于1∶100万[27-28]。
图2
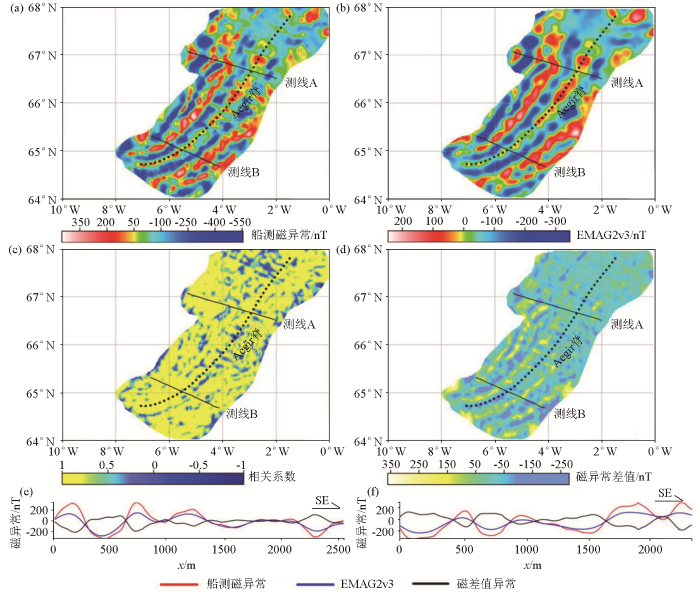
图2
Aegir轴裂谷磁力异常及数据对比
a—船测磁力异常;b—EMAG2v3地球磁异常;c—船测磁力异常与EMAG2v3的相关系数;d—船测磁力异常与EMAG2v3的差值;e—测线A磁异常及差值;f—测线B磁异常及差值
Fig.2
Aegir axis rift magnetic anomaly and data comparison
a—aeromagnetic anomaly; b—Earth magnetic anomaly grid(EMAG2v3); c—correlation coefficient between aeromagnetic anomaly and EMAG2v3; d—difference between aeromagnetic anomaly and EMAG2v3; e—line magnetic anomaly and difference of measurement A; f—line magnetic anomaly and difference of measurement B
表1 磁力相关系数数值与差值区间
Table 1
| 相关系数 | 占总面积 比例/% | 磁异常差值 绝对值/nT | 占总面 积比例/% |
|---|---|---|---|
| -1.0~0.3 | 9.94 | <10 | 16.07 |
| 0.3~0.5 | 4.83 | 10~50 | 48.31 |
| 0.5~0.8 | 16.32 | 50~100 | 24.27 |
| >0.8 | 68.89 | >100 | 11.34 |
如表1所示,EMVG2v3与船测磁力数据的差值绝对值小于10 nT的范围区域占总面积的16.07%,介于10~50 nT之间占总面积的48.31%,介于50~100 nT之间占总面积的24.27%,大于100 nT的区域范围占总面积的11.34%,表明这两种数据在Aegir轴裂谷及两侧约150 km范围内差异性极大。
由图3a与图3b所示,两种重力异常特征极为相似,表明船测重力异常与数据库重力异常变化趋势较为一致。从图3c中亦能看出两种数据存在显著的相关性,研究区内相关系数普遍大于0.8,仅在研究区西南部靠近冰岛大陆架处,相关系数显示为0.5及以下,表明数据库自由空气重力异常与船测自由空气异常在该处变化一致性较好。设相关系数为R,R≥0.8、0.5≤R<0.8、0.3≤R<0.5、-0.1≤R<0.3的区域占比见(表2),其中相关系数数值在-1~0.3范围之间仅有全局范围的6.03%,相关系数数值在0.3~0.5区间也占比极少仅有4.10%,而相关系数数值在0.5~0.8及0.8之上面积区域分别占比全局的16.40%与73.46%,由此可知,两种异常特征高度一致,都能较好反映Aegir脊轴部的横向分布特征。
图3
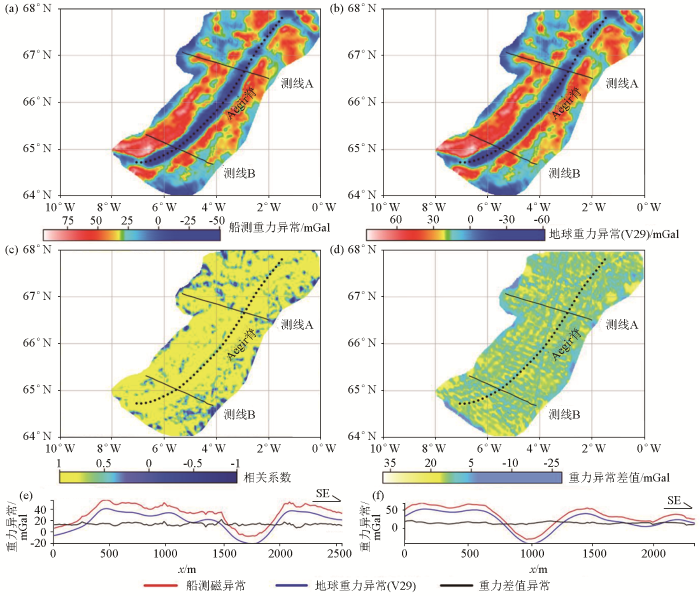
图3
Aegir轴裂谷重力异常及数据对比
a—船测重力异常;b—地球重力异常(V29);c—船测重力异常与地球重力异常(V29)的相关系数;d—船测磁力异常与地球重力异常(V29)的差值;e—测线A重力异常及差值;f—测线B重力异常及差值
Fig.3
Aegir axis rift gravity anomaly and data comparison
a—ship-measured gravity anomaly; b—Earth gravity anomaly (V29); c—correlation coefficient between ship-measured gravity anomaly and Earth gravity anomaly (V29); d—difference between ship-measured gravity anomaly and Earth gravity anomaly (V29); e—line A gravity anomaly and difference; f—line B gravity anomaly and difference
表2 重力相关系数数值与差值区间
Table 2
| 相关系数 | 占总面积 比例/% | 磁异常差 值绝对值/nT | 占总面 积比例/% |
|---|---|---|---|
| -1.0~0.3 | 6.03 | <10 | 10.65 |
| 0.3~0.5 | 4.10 | 10~50 | 89.35 |
| 0.5~0.8 | 16.40 | 50~100 | 0 |
| >0.8 | 73.46 | >100 | 0 |
Aegir轴裂谷及两侧约150 km范围内计算自由空气重力异常与船测重力异常的差值绝对值小于10×10-5m/s2的区域占比是10.65%,而另外剩下89.35%面积区域的差值绝对值都介于(10~50)×10-5m/s2之间,表明两数据在Aegir轴裂谷及两侧约150 km范围内差异性较大。
3 结论
由两种磁异常数据对比结果可知,船测磁异常更能反映出该地区磁异常的细节特征,测线磁异常显示:两种数据磁异常变化特征及走向较为一致,但船测磁异常比EMAG2v3磁异常起伏变化更加显著,故表明全球磁异常EMAG2v3库融合了本次大部分船测磁力数据,与该区域船测磁力数据相比,EMAG2v3库数据整体质量相对较低,异常细节特征有一定损失。
从重力数据对比分析结果来看,本次船测重力异常数据和V29库重力异常数据几乎完全契合,表明两种数据的横向分辨率基本一致。
在资料利用方面,本次船测磁力数据的使用效果比EMAG2v3库异常数据更好,而船测重力异常数据和V29重力库数据使用效果基本一致,故在使用重、磁数据资料时,可先将其进行对比与分析,选用较好的数据进行处理,使解释结果更加准确。
参考文献
联合卫星重力、卫星测高和海洋资料研究全球海平面变化
[J].
Combined satellite gravity,satellite altimetry and oceanographic data to study global sea level change
[J].
New standards for reducing gravity data:The north American gravity database
[J].
Stochastic data envelopment analysis—A review
[J].DOI:10.1016/j.ejor.2015.07.058 URL [本文引用: 1]
A continuous 55-million-year record of transient mantle plume activity beneath iceland
[J].DOI:10.1038/ngeo2281 [本文引用: 1]
Geological modeling of the new CHAMP magnetic anomaly maps using a geographical information system technique
[J].
EMAG2:A2-arc min resolution Earth magnetic anomaly grid compiled from satellite,airborne,and marine magnetic measurements
[J].
Derivation and error analysis of the earth magnetic anomaly grid at 2 arc min resolution version 3 (EMAG2v3)
[J].DOI:10.1002/ggge.v18.12 URL [本文引用: 1]
A high-resolution lithospheric magnetic field model over southern Africa based on a joint inversion of CHAMP,Swarm,WDMAM,and ground magnetic field data
[J].
DOI:10.5194/se-9-897-2018
URL
[本文引用: 1]

. We derive a lithospheric magnetic field model up to equivalent spherical harmonic degree 1000 over southern Africa. We rely on a joint inversion of satellite, near-surface, and ground magnetic field data. The input data set consists of magnetic field vector measurements from the CHAMP satellite, across-track magnetic field differences from the Swarm mission, the World Digital Magnetic Anomaly Map, and magnetic field measurements from repeat stations and three local INTERMAGNET observatories. For the inversion scheme, we use the revised spherical cap harmonic analysis (R-SCHA), a regional analysis technique able to deal with magnetic field measurements obtained at different altitudes. The model is carefully assessed and displayed at different altitudes and its spectral content is compared to high-resolution global lithospheric field models. By comparing the shape of its spectrum to a statistical power spectrum of Earth's lithospheric magnetic field, we infer the mean magnetic thickness and the mean magnetization over southern Africa.\n
A global reference model of Curie-point depths based on EMAG2
[J].
DOI:10.1038/srep45129
[本文引用: 1]
In this paper, we use a robust inversion algorithm, which we have tested in many regional studies, to obtain the first global model of Curie-point depth (GCDM) from magnetic anomaly inversion based on fractal magnetization. Statistically, the oceanic Curie depth mean is smaller than the continental one, but continental Curie depths are almost bimodal, showing shallow Curie points in some old cratons. Oceanic Curie depths show modifications by hydrothermal circulations in young oceanic lithosphere and thermal perturbations in old oceanic lithosphere. Oceanic Curie depths also show strong dependence on the spreading rate along active spreading centers. Curie depths and heat flow are correlated, following optimal theoretical curves of average thermal conductivities K = ~2.0 W(m°C)−1 for the ocean and K = ~2.5 W(m°C)−1 for the continent. The calculated heat flow from Curie depths and large-interval gridding of measured heat flow all indicate that the global heat flow average is about 70.0 mW/m2, leading to a global heat loss ranging from ~34.6 to 36.6 TW.
Integrating gravity and surface elevation with magnetic data:Mapping the curie temperature beneath the British Isles and surrounding areas
[J].DOI:10.3389/feart.2018.00165 URL [本文引用: 1]
Insights on the tectonic styles across Estonia using satellite potential fields derived from WGM-2012 gravity data and EMAG2 magnetic data
[R].
New insights on Kimberlite emplacement around the Bundelkhand Craton using integrated satellite-based remote sensing,gravity and magnetic data
[J].DOI:10.1080/10106049.2020.1756459 URL [本文引用: 1]
Petroleum systems asymmetry across the South Atlantic equatorial margins
[J].DOI:10.1144/SP431.13 URL [本文引用: 1]
Density contrasts in the upper mantle and lower crust across the continent—Ocean transition:Constraints from 3D gravity modelling at the Norwegian margin
[J].DOI:10.1111/gji.2009.179.issue-1 URL [本文引用: 1]
US Geological Survey National produced waters geochemical database v2.3 (PROVISIONAL)
[R].
Comparison of satellite altimetric gravity and ship-borne gravity—Offshore western Australia
[J].
利用多代卫星测高数据计算中国近海及邻域重力异常
[J].
Calculation of gravity anomalies over China Sea and its vicinity based on multi-generation satellite altimetry data
[J].
联合多代卫星测高资料反演中国南海重力异常
[J].
Inversion of the gravity anomalies by using multi-generation satellite altimeter data in the South China Sea
[J].
Surfer软件中利用趋势面方法圈定化探异常
[J].
Delineation of geochemical anomalies by trend surface method in Surfer software
[J].
Surfer8.0在环境评价和规划中的应用
[J].
Application of Surfer8.0 to environmental assessment and planning
[J].
基于surfer8.0实现雨量图形可视化
[J].
Realization of rainfall graphical visualization based on surfer8.0
[J].
Surfer网格化与白化处理在数据扩边中的应用——以1∶5万水系沉积物测量成图为例
[J].
The application of Surfer gridding and whitening in data edge expansion—Taking the measurement and mapping of 1∶50,000 river system sediments as an example
[J].
Long-distance impact of Iceland plume on Norway’s rifted margin
[J].
DOI:10.1038/s41598-017-07523-y
[本文引用: 1]
Results of a 3D modeling study inspired by recent seismic tomography of the Northern Atlantic mantle suggest that a complex pattern of hot mantle distribution with long horizontal flows originating from the Iceland mantle plume has been the norm in the geological past. In the Northern Atlantic the Iceland plume has a strong long-distance impact on intraplate deformation affecting both onshore and offshore parts of Norway’s rifted margin. As a result, this margin is characterized by large magnitude differential topography sustained over at least several tens of Myr. Here we use high-resolution 3D thermo-mechanical modeling to demonstrate that the long-distance plume impact can be explained by its fast lateral propagation controlled by pre-existing lithosphere structures. Numerical models show that these structures strongly affect the style of horizontal flow of plume head material. This results in long-distance propagation of hot material emplaced at the lithosphere-asthenosphere boundary causing long-wavelength anomalies in onshore topography of Norway’s rifted margin. Short-wavelength offshore topographic domes are likely caused by joint occurrence of plume-related thermal perturbations and gravitational forces related to plate thickening (ridge push). Our 3D modeling brings together plume impingement, spreading ridge dynamics, and the formation of anomalous intraplate structures offshore Norway in one scenario.
地球磁异常(EMAG2)数据中海域资料质量评估——以北极地区Kolbeinsey脊南段为例
[J].
DOI:10.11867/j.issn.1001-8166.2019.03.0288
[本文引用: 1]
为了评估地球磁异常(EMAG2)数据中海域资料的质量问题,选择Kolbeinsey脊南段地区约193 500 km<sup>2</sup>的1∶500 000及1∶1 000 000的航磁数据进行对比分析。基于地球磁异常(EMAG2)数据,利用解析延拓方法获得了EMAG2(向下延拓4 km)及航磁异常(向上延拓4 km)。利用相关分析法对EMAG2与航磁异常(向上延拓4 km)、EMAG2(向下延拓4 km)与航磁异常进行相关分析,得到了相应的相关系数。通过对这些数据之间相关系数及差值特征的综合分析,评估了EMAG2数据中Kolbeinsey脊南段地区磁力数据的质量。研究结果表明,EMAG2数据融合了大量海域航空磁测及海洋磁测资料,在测线较密的海域,其数据质量相对较高。然而若将4 km高度的EMAG2数据换算到海平面高度的异常数据,其数据质量较低。
Quality evaluation of offshore data in the earth magnetic anomaly grid (2-arc-minute resolution):Taking the southern section of the kolbeinsey ridge in the Arctic region as an example
[J].
威德尔海的重磁场特征及其构造意义
[J].
Gravity and magnetic field characteristics of the Weddell Sea and its tectonic significance
[J].
现代卫星测高重力异常分辨能力分析及在海洋资源调查中应用
[J].
Resolution of modern satellite altimetric gravity anomaly and its application to marine geological survey
[J].
最新全球重力数据库V23中陆域重力资料质量评估
[J].
DOI:10.11867/j.issn.1001-8166.2017.01.0075
[本文引用: 1]
为了评估最新全球重力数据库V23中陆域重力资料的质量问题,选择了美国、秘鲁、爱尔兰、南非、肯尼亚、澳大利亚、中国等7个国家的8个区块约133万km<sup>2</sup>的重力数据进行对比分析。基于V23中自由空间重力异常数据,利用纯球坐标系内重力校正方法获得了这些区块的计算布格重力异常。利用相关分析的方法对这些区块的实测布格重力异常和计算布格重力异常进行相关分析,得到了相应的相关系数。通过对实测布格重力异常和计算布格重力异常之间相关系数及差值特征的综合分析,评估了全球重力数据库V23中选取的8个区块重力数据的质量。研究结果表明,斯克里普斯海洋研究所发布的最新全球重力数据库V23中陆域重力资料融合了大量测量年代较早的地面重力数据或者航空重力数据,而近十几年新完成的地面重力资料或者航空重力资料可能未融合进该数据库。具有大量年代较早的地面或者航空重力测量资料的区域,该数据库中陆域重力资料的质量较高,而重力工作程度较低的区域,其资料的质量则较低。
Quality evaluation of land gravity data in the latest global gravity database V23
[J].
DOI:10.11867/j.issn.1001-8166.2017.01.0075
[本文引用: 1]
In order to evaluate the quality of the land gravity data in the latest global gravity database V23, the authors chose the gravity data of eight blocks with a total area of 1 330 000 km2 to compare and analyze, and these blocks involved seven countries, including the United States, Peru, Ireland, South Africa, Kenya, Australia, and China. Based on the free-air gravity anomaly data of the latest global gravity database V23, the authors obtained the calculated Bouguer gravity anomaly using the gravity correction methods within the pure spherical coordinate system in these eight blocks. Then, the correlation coefficients between the measured Bouguer gravity anomaly and the calculated Bouguer gravity anomaly were calculated by the correlation analysis method in these eight blocks. Finally, through comprehensive analysis of the features of these correlation coefficients and differences between the measured Bouguer gravity anomaly and the calculated Bouguer gravity anomaly in these eight blocks, the quality of the gravity data of these eight blocks was evaluated in the latest global gravity database V23. The results showed that the latest global gravity database V23, released by Scripps Institution of Oceanography, integrated a large number of the ground or airborne gravity data measuring in an earlier era, and the newly surveyed ground or airborne gravity data may not be integrated into the database. The quality of land gravity data is relatively high in the areas with a large number of older ground or airborne gravity data, otherwise it is low in the zones with a lower gravity working degrees.
