

0 引言
当前构建壳幔三维速度参考模型的方法较多,比如基于一维层状模型的构建方法[5⇓⇓⇓⇓⇓⇓⇓-13]、基于前人深地震测深结果进行速度模型插值的构建方法[14]、基于全球壳幔模型(CRUST1.0、Litho1.0等)[15⇓⇓⇓⇓-20]或前人地震成像结果的单一/多个速度模型进行三维插值的构建方法等[21⇓⇓⇓-25]。然而,不同方法获取的速度模型在尺度、精度、分辨率上存在较大差异,因此,为满足当前地震成像研究对高质量参考模型的需求,需要寻求精细化的模型构建方法。近年来,国内外学者研究并提出了一些参考模型构建方法,并在不同地区开展了应用,比如:EuCrust-07—欧洲地壳的新参考模型[26],欧洲板块莫霍面深度模型[27],EPCrust—欧洲板块的地壳参考模型[28],EUNAseis—欧洲、格陵兰岛和北大西洋地区莫霍面和地壳模型[29],NAC—北亚德里亚地壳模型[30],PRISM3D—伊比利亚及邻近地区的地壳参考模型[31],VMNC—中国华北地区地壳—上地幔地震波速度结构模型[32]等。这些参考模型构建方法的基本思路为:整体模型的分解,各子部分模型修正与加权融合,组合形成新模型。但是,这些方法缺乏对表层结构的精细构建。以Arroucau等[31]为例,他们的壳幔速度参考模型构建方法将模型分为4个子部分:沉积层、上地壳、下地壳和地幔,建造时以莫霍面和沉积基底面模型为约束,对前人模型的各子部分作垂向全局“压缩和拉伸”修正,再加权融合并组合形成新的参考模型。然而,Arroucau等[31]方法对参考模型采用了垂向全局尺度的修正,降低了前人模型的垂向结构精度,在一定程度上降低了模型的可靠性。
针对前人壳幔速度参考模型构建方法存在的问题,本文在Arroucau等[31]的方法基础上,改进了壳幔三维速度参考模型构建方法,包含莫霍面和沉积基底面模型构建、地壳和上地幔介质模型的垂向局部修正和加权融合、表层介质模型构建等。将该方法应用于华南陆块中部(104°~117°E,24°~32°N),构建出该地区壳幔三维速度参考模型,并与前人模型对比评价,证明了本文方法的有效性,也为该区提供了可靠的三维速度参考模型。
1 壳幔三维速度参考模型构建方法
1.1 总体思路
本文构建的壳幔速度参考模型由构造界面(主要包括沉积基底面、莫霍面)、地壳介质、上地幔顶部介质、表层介质组成。首先,设定模型的三维网格框架,含东向、北向起止点、横向网格间距、深度范围、深度步长等参数。然后,从沉积基底面、莫霍面等构造界面模型,到地壳和上地幔介质模型、表层介质模型,依次建模,形成最终的壳幔速度参考模型。其中,每部分建模都先优选出新近程度高、精度高、分辨率高、可靠性强的相关模型,按照质量高低分配权重大小的原则进行加权融合构建。
1.2 构建流程
本文壳幔三维速度参考模型构建流程如图1所示。参考模型构建从构建构造界面出发,依据质量好坏和可靠性高低对以往构造界面深度模型进行优选、权重分配和加权融合,从而构建出新构造界面模型。同理,优选出以往质量好、可靠性高的壳幔三维速度模型,依据新构造界面模型对壳幔速度模型进行垂向局部修正,并对修正后的壳幔速度模型进行加权融合。最后,将构建好的表层速度模型替换修正和加权融合后的壳幔模型的表层部分,完成整个壳幔三维速度参考模型的构建。
图1
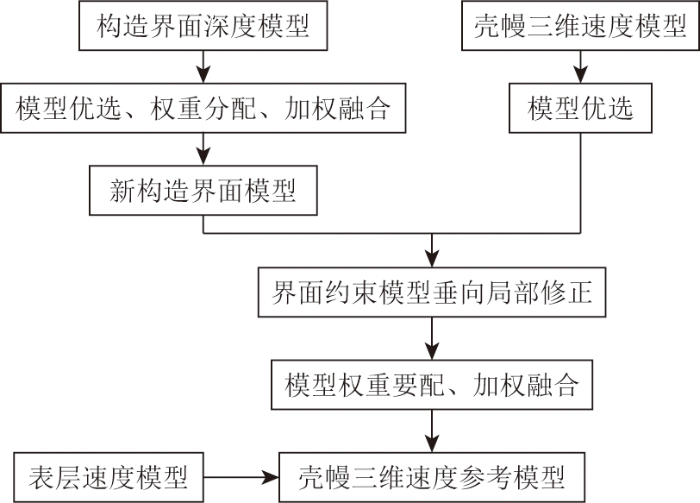
图1
壳幔三维速度参考模型构建流程
(构造界面包含莫霍面以及沉积基底面)
Fig.1
The flowchart of constructing 3D velocity reference model of the crust-mantle
(The crustal interfaces represent the Moho and sedimentary interfaces)
1.2.1 构造界面模型构建
本文构造界面模型主要包含莫霍面和沉积基底面,这里以莫霍面模型构建为例进行说明,沉积基底面模型构建同理。首先,收集研究区以往不同方法得到的莫霍面深度模型,然后,根据模型的新近程度、分辨率、精度、可靠性等方面优选出质量较高的若干模型,对这些模型按照质量和分辨率从高到低分别赋予从大到小的权重值,再进行加权融合,形成新的莫霍面参考模型。
1.2.2 地壳与上地幔介质模型垂向局部修正和加权融合
首先,收集研究区以往不同方法得到的三维速度模型,根据模型的新近程度、分辨率、精度、可靠性等方面优选出质量较高的若干模型;然后,以上述获得的新构造界面模型为约束,对优选的各模型在垂向上作局部修正;最后,对修正后的各模型按照质量和分辨率的高低分别赋予不同大小的权重值,再进行加权融合,形成新的壳幔三维速度参考模型。
下面以莫霍面约束为例说明模型垂向局部修正的原理,沉积基底面约束同理。
莫霍面是壳幔速度的突变界面,各模型原始的莫霍面(下文称为旧莫霍面,图2)可以通过搜寻各网格节点下方速度的突变点来确定。在模型修正步骤中,为了不破坏各模型整体的速度结构,减少深度失真,本文采用局部“压缩和拉伸”的方式,仅对莫霍面上下小范围内的速度点进行调节修正,即线性“拉伸”地壳部分的同时线性“压缩”地幔部分。下调旧莫霍面,线性“压缩”地壳部分同时线性“拉伸”地幔部分,上调旧莫霍面,使得新旧莫霍面深度一致。由于在“压缩”和“拉伸”过程中会改变模型局部的垂向间距,因此,需将调节好的三维速度模型按照前文设定的深度步长重新进行插值,从而得到垂向局部修正后的壳幔三维速度模型。
图2
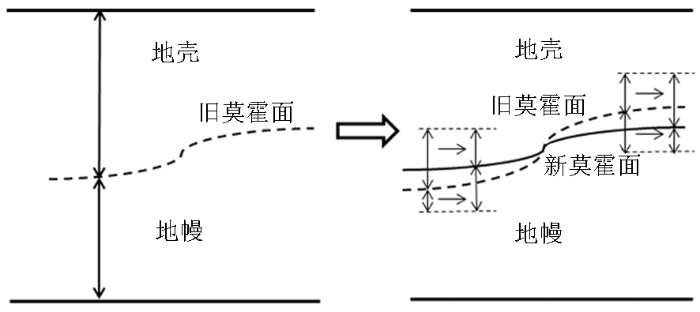
图2
壳幔垂向局部“压缩和拉伸”修正示意
Fig.2
Diagram of the partial "compression and stretching" correction of the crust-mantle structure vertically
1.2.3 表层速度模型构建
首先,收集研究区地表地质图和岩石密度资料,划分出研究区主要岩性类别并统计各类别的密度值,按照岩性类别对地质图赋予新的色标,形成研究区的岩性类别图。然后,读取岩性类别图色彩信息为色彩像素矩阵,根据岩性色标匹配出对应的岩性类别。接着,对其密度赋值形成表层密度模型,参考模型每个网格节点的近地表密度值可以从上述的表层密度模型内插值获取,或设定窗口并求取窗口内数值的平均值来获取。最后,通过速度与密度转换经验式[33]将密度转化为速度,即可获得表层速度模型。若研究区内存在海域,则需对表层的海水层以海水的速度值直接赋值。将上述构建的表层速度参考模型替换到构建好的壳幔三维速度参考模型的相应网格层,并对其下伏网格层做必要的平滑处理,使其上下层速度值衔接自然,形成最终的壳幔三维速度参考模型。
2 华南陆块中部壳幔三维S波速度参考模型构建
华南陆块包含扬子地块、华夏地块及其间的江南造山带[34]。受周边印度板块、菲律宾海板块和太平洋板块的共同影响,该地区构造背景复杂,地壳向东减薄明显[19,37]。虽然华南陆块地质、地球物理研究程度相对较高,但仍存在诸多科学问题待研究解决,比如:江南造山带或扬子与华夏拼合带的西延问题?钦杭成矿带的深部成矿机制?等[34⇓-36]。因此,高质量、高分辨率的壳幔结构模型对推动华南深部构造与动力学问题研究具有重要意义。本文以华南陆块中部(经纬度:104°~117°E,24°~32°N;深度:0~60 km)为例,应用上述改进的参考模型构建方法,构建该区域的壳幔三维S波速度参考模型,为高质量的地震层析成像提供初始模型和参考约束。
2.1 数据来源
本文收集了华南陆块及邻区诸多前人发表的莫霍面深度模型和壳幔三维S波速度模型[9⇓⇓⇓⇓-14,18⇓⇓⇓⇓⇓⇓-25,37⇓⇓⇓⇓⇓⇓⇓⇓⇓⇓⇓-49]。经过对比和优选,最终选取表1中Guo等[37]利用接收函数和重力联合反演方法得到的地壳厚度模型(将地壳厚度结果减去相应高程)作为本文的新莫霍面参考模型,该联合反演结果可信度高、误差小。本文优选出前人的华南壳幔三维S波速度模型(表1)有:Shen等[38]通过面波层析成像得到的S波速度模型,Zhou等[40]通过背景噪声层析成像得到的S波速度模型,Han等[47]通过体波面波联合反演获得的S波速度模型。由于研究区沉积基底面模型资料相对较少,本文构建的壳幔三维速度参考模型暂未考虑沉积基底面。本文表层速度参考模型构建所使用的地质图选自中国地质调查局2002年编制的中华人民共和国1:250万地质图,密度资料汇编自区域物性资料[50⇓⇓⇓-54](表2)。
表1 优选的前人壳幔结构模型汇总
Table 1
| 地区 | 前寒武 纪地层 | 显生 宇 | 花岗 岩 | 中性 岩 | 基性 岩 | 超基 性岩 | 喷出 岩 |
|---|---|---|---|---|---|---|---|
| 贵州 | 2.69 | 2.51 | 2.61 | 2.63 | 2.83 | 3.11 | 2.62 |
| 湖南 | 2.63 | 2.53 | 2.66 | 2.75 | 2.9 | 2.9 | 2.65 |
| 广西 | 2.58 | 2.59 | 2.55 | 2.65 | 2.84 | 2.91 | 2.55 |
| 广东 | 2.60 | 2.57 | 2.55 | 2.59 | 2.84 | 3.01 | 2.59 |
| 福建 | 2.65 | 2.56 | 2.62 | 2.8 | 2.92 | 3.23 | 2.6 |
| 浙江 | 2.65 | 2.56 | 2.62 | 2.8 | 2.92 | 3.23 | 2.6 |
| 平均 | 2.62 | 2.55 | 2.61 | 2.72 | 2.88 | 3.1 | 2.6 |
2.2 壳幔三维S波速度参考模型构建
本文将华南陆块中部研究区划分为66×41×31的三维网格模型,经纬度方向上间距为0.2°×0.2°,深度步长为2 km。
将Guo等[37]通过接收函数和重力联合反演获得的华南陆块地壳厚度值减去相应地形高程,作为新的莫霍面参考模型(图3),以此对上述优选的3个壳幔S波速度模型作垂向局部修正,而后加权融合。其中,Shen等[38]和Zhou等[40]所使用的面波层析成像方法对S波速度都较敏感,两者得到的模型在水平和垂向上的分辨率都较好,所以赋予两者较大的权重,而前者模型垂向分辨率更高,所以分配最大的权重;Han等[47]所使用的体波面波联合反演方法虽然对S波速度的敏感程度较好,但所得到的S波速度模型在垂向上的分辨率相对低些,所以赋予较小的权重。模型权重的分配主要依据模型本身的新近程度、精度和分辨率等。通常情况下,所用模型的时间越新,精度、分辨率越高,可靠性就越高,赋予模型的权重值也越高。在保证各模型的权重之和为1的前提下,可根据所用模型的数目进行具体分配。在实际应用中,参与数据融合的模型可能出现更为复杂的情况,如某一模型在不同深度上所体现的数据可靠性不同等,此时,其权重数值可作灵活处理,不同模型的具体权重值分配如表1所示。本文将研究区复杂的岩性分类为前寒武纪地层、显生宇、酸性岩、中性岩、基性岩、超基性岩和喷出岩7个类别,相应的密度值见表2。应用本文方法构建出研究区表层S波速度模型,见图4所示。合并上述模型形成最终的华南陆块中部壳幔三维S波速度参考模型,见图5所示。
图3
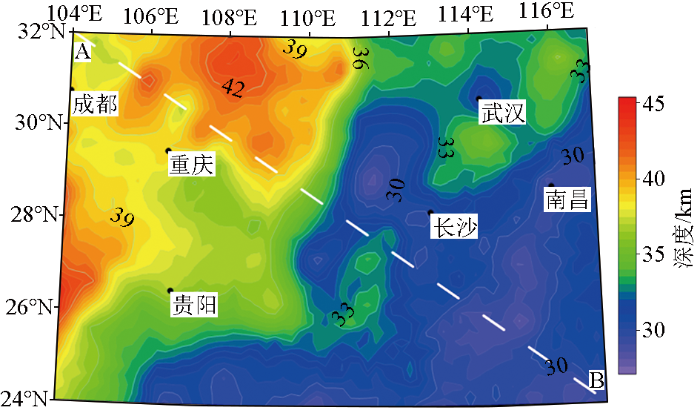
图3
华南陆块中部莫霍面模型
白色虚线表示AB剖面位置
Fig.3
Moho reference model of the central South China block
The white dotted line denotes the location of the profile AB
图4
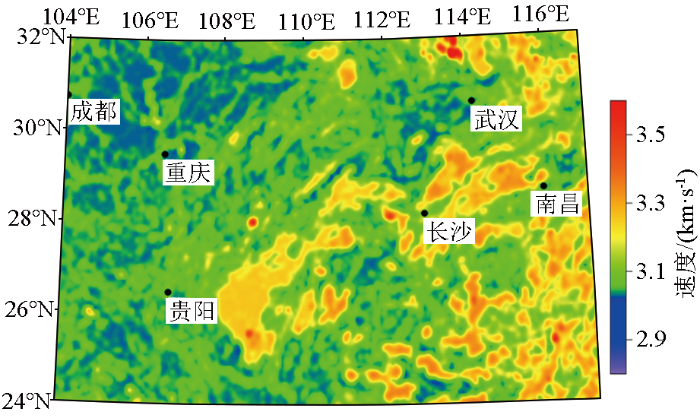
图4
华南陆块中部表层S波速度模型
Fig.4
The S-wave velocity reference model of near-surface in the central South China block
图5
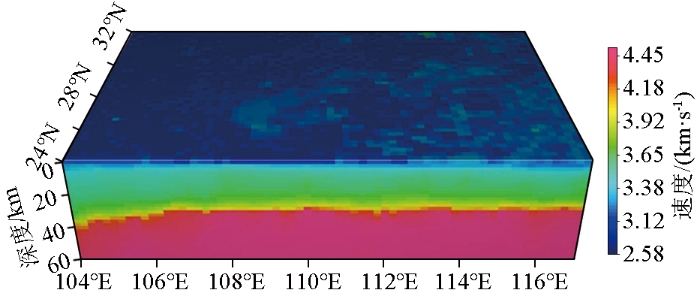
图5
华南陆块中部壳幔三维S波速度参考模型
Fig.5
The 3D S-wave velocity reference model of crust-mantle in the central South China block
图6显示了本文构建的华南陆块中部壳幔S波速度参考模型的不同深度切片。由图可见,研究区壳幔S波速度结构在横向上存在明显的不均匀性,不同深度的速度结构也有差异。在上地壳部分,研究区西北部呈现低速异常分布,对应扬子地块的川东褶皱带,研究区中部、东南部呈现相对高速异常分布,分别对应江南造山带和华夏地块。在中下地壳部分,研究区西北部扬子地块的低速异常分布范围加大。但在上地幔顶部,扬子地块呈现为高速异常分布,而华夏地块呈现为相对的低速异常分布。
图6
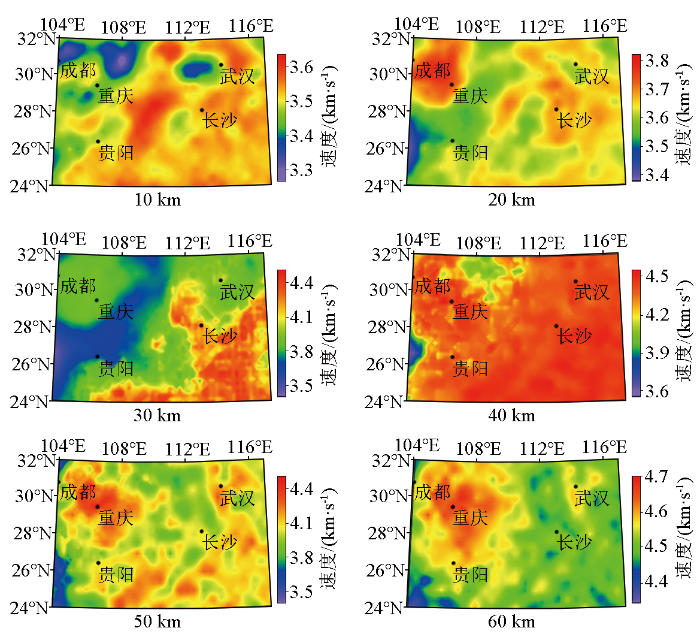
图6
华南陆块中部壳幔S波速度参考模型的不同深度切片
Fig.6
Maps showing S-wave velocity structure of reference model at different depths in the central South China block
2.3 与前人模型对比
为评价本文构建的壳幔三维S波速度参考模型的质量,本文从该参考模型截取一条WN—ES向剖面(见图3剖面AB)与前人模型(Shen等[38]、Han等[47]和Zhou等[40])进行对比,如图7所示。与Shen等[38]的模型相比,本文模型在垂向变化更平缓,在横向上变化更平滑;与Han等[47]的模型相比,本文模型在莫霍面深度上下分界明显,整体分辨率更高;与Zhou等[40]的模型相比本文模型展示出的速度跃变深度更浅,与该处莫霍面的深度更为贴合。总体上,本文构建的壳幔S波速度参考模型有效融合了Shen等[38]、Han等[47]和Zhou等[40]三者模型的特点,其表层速度分布刻画更精细且更接近实际地质构造。
图7
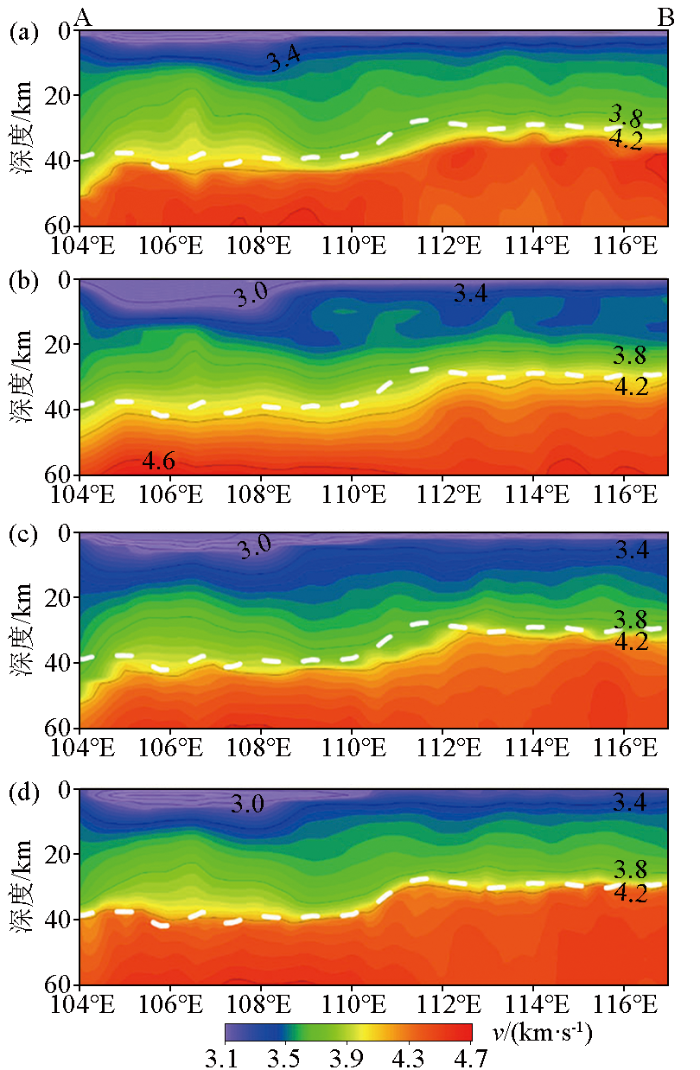
图7
不同S波速度模型在AB剖面的结构对比
a—Shen等[38]模型;b—Han等[47]模型;c—Zhou等[40]模型;d—本文构建的参考模型;白线表示莫霍面深度,剖面位置见
Fig.7
Comparisons of different S-wave velocity models in profile AB
a—Shen et al.[38] model;b—Han et al.[47] model;c—Zhou et al.[40] model;d—our model;The white line represents the Moho depth,the profile location is shown in
3 结论
针对壳幔速度参考模型的构建需要以及前人壳幔速度参考模型构建方法的一些不足之处,本文研究给出了壳幔三维速度参考模型的精细化构建方法和流程,通过构建高质量的莫霍面、沉积基底面模型来约束前人地壳和上地幔介质模型;通过对前人模型进行优选、垂向局部修正和加权融合实现地壳和上地幔顶部介质的模型构建,最大程度地避免了垂向结构失真,同时保留了原模型的整体趋势及部分细节;通过地表地质资料来约束表层介质模型构建,完善了前人参考模型忽略表层建模的不足。
本文收集了华南陆块中部的前人壳幔速度模型以及该区的表层地质资料,应用本文方法构建了华南陆块中部壳幔三维S波速度参考模型,并与前人模型对比,本文模型较前人结果具有更高的分辨率,对该区域莫霍面的刻画也更准确,由此验证了本文方法和所建参考模型的有效性。本文模型成果可为华南陆块中部地震层析成像提供有效、精细的初始模型和参考约束,本文方法也可进一步推广用于构建壳幔三维密度或其他物性结构参考模型。
参考文献
地震层析成像中模型参数化研究进展
[J].
Parameterization in seismic tomography
[J].
区域尺度地震体波和面波走时联合成像:进展与展望
[J].
Regional-scale joint seismic body- and surface-wave travel time tomography
[J].
近地表地震层析成像方法综述
[J].
Review of seismic tomography methods in near-surface structures reconstruction
[J].
地震环境噪声成像中的地形影响校正
[J].
Topographic correction in ambient noise tomography
[J].
青藏高原东部和周边地区地壳速度结构的背景噪声层析成像
[J].
Crust and upper mantle velocity structure of the eastern Tibetan Platean and adjacent regions from ambient noise tomography
[J].
天山中东段地震层析成像的初步研究
[J].
A preliminary study on seismic tomography in mid-eastern segment of Tianshan Mountain
[J].
人工地震测深揭示云南中部地区不同构造单元地壳结构特征
[J].
The crustal structure characteristics of different tectonic units in central Yunnan revealed by artificial seismic sounding
[J].
九嶷山及邻区地壳结构噪声成像及其对华南地区的构造演化启示
[J].
Crustal shear wave velocity structure near the Jiuyishan area from seismic ambient noise tomography:Implications for tectonic evolution in South China
[J].
基于三重震相拟合的华南地区上地幔P波与S波速度结构
[J].
P-wave and S-wave velocity structures of upper mantle beneath South China derived from seismic triplications
[J].
宁化—大田—惠安地壳构造与速度结构特征
[J].
The crust structure and velocity structure characteristics beneath Ninghua-Datian-Hui'an
[J].
深地震测深揭示的华南地区地壳结构及其动力学意义
[J].
Crustal structure beneath South China revealed by deep seismic soundings and its dynamics implications
[J].
辽宁及邻区S波速度结构反演
[J].
Inversion of S-wave velocity structure in Liaoning and adjacent areas
[J].
宜宾-金川剖面地壳上部速度结构及构造含义
[J].
Upper crustal velocity structure of the Yibin Jinchuan profile and its implications
[J].
基于三维模型中的射线追踪方法测定鲁甸Ms6.5地震震源深度
[J].
Focal depth determination of Ludian Ms 6.5 earthquake with a segmentally iterative ray tracing method in 3D geological models
[J].
Crust1.0地壳模型及其应用:以长江中下游成矿带为例
[J].
Crust 1.0 crustal model and its application:an example from Middle-Lower Yangtze Metallogenic Belt
[J].
华南地区地壳厚度变化及对成矿类型的制约:来自卫星重力数据的约束
[J].
Crust thickness and its apocalyptic of mineralization in South China:Constraint from satellite gravity data
[J].
华南地区上地幔P波三维速度结构和动力学意义:来自有限频层析成像的证据
[J].
3D velocity structure of upper mantle beneath South China and its tectonic implications:Evidence from finite frequency seismic tomography
[J].
中国东南部P波速度结构与构造分析
[J].
P wave velocity structure and tectonic analysis beneath southeastern China
[J].
华南及南海北部地区瑞利面波层析成像
[J].
Surface wave tomography for South China and the northern South China Sea area
[J].
长江中下游成矿带高分辨地壳三维横波速度结构及其形成的深部动力学背景
[J].
High-resolution 3D crustal S-wave velocity structure of the Middle-Lower Yangtze River Metallogenic Belt and implications for its deep geodynamic setting
[J].
EuCRUST-07:A new reference model for the European crust
[J].
The Moho depth map of the European Plate
[J].DOI:10.1111/gji.2008.176.issue-1 URL [本文引用: 1]
EPcrust:A reference crustal model for the European Plate
[J].DOI:10.1111/gji.2011.185.issue-1 URL [本文引用: 1]
EUNAseis:A seismic model for Moho and crustal structure in Europe,Greenland,and the North Atlantic region
[J].DOI:10.1016/j.tecto.2013.08.004 URL [本文引用: 1]
Deriving a new crustal model of Northern Adria:The Northern Adria Crust (NAC) model
[J].DOI:10.3389/feart.2020.00089 URL [本文引用: 1]
PRISM3D:A 3D reference seismic model for Iberia and adjacent areas
[J].
DOI:10.1093/gji/ggab005
URL
[本文引用: 4]

We present PRISM3D, a 3-D reference seismic model of P- and S-wave velocities for Iberia and adjacent areas. PRISM3D results from the combination of the most up-to-date earth models available for the region. It extends horizontally from 15°W to 5°E in longitude, 34°N to 46°N in latitude and vertically from 3.5 km above to 200 km below sea level, and is modelled on a regular grid with 10 and 0.5 km of grid node spacing in the horizontal and vertical directions, respectively. It was designed using models inferred from local and teleseismic body-wave tomography, earthquake and ambient noise surface wave tomography, receiver function analysis and active source experiments. It includes two interfaces, namely the topography/bathymetry and the Mohorovičić (Moho) discontinuity. The Moho was modelled from previously published receiver function analysis and deep seismic sounding results. To that end we used a probabilistic surface reconstruction algorithm that allowed to extract the mean of the Moho depth surface along with its associated standard deviation, which provides a depth uncertainty estimate. The Moho depth model is in good agreement with previously published models, although it presents slightly sharper gardients in orogenic areas such as the Pyrenees or the Betic-Rif system. Crustal and mantle P- and S-wave wave speed grids were built separately on each side of the Moho depth surface by weighted average of existing models, thus allowing to realistically render the speed gradients across that interface. The associated weighted standard deviation was also calculated, which provides an uncertainty estimation on the average wave speed values at any point of the grid. At shallow depths (<10 km), low P and S wave speeds and high VP/VS are observed in offshore basins, while the Iberian Massif, which covers a large part of western Iberia, appears characterized by a rather flat Moho, higher than average VP and VS and low VP/VS. Conversely, the Betic-Rif system seems to be associated with low VP and VS, combined with high VP/VS in comparison to the rest of the study area. The most prominent feature of the mantle is the well known high wave speed anomaly related to the Alboran slab imaged in various mantle tomography studies. The consistency of PRISM3D with previous work is verified by comparing it with two recent studies, with which it shows a good general agreement.The impact of the new 3-D model is illustrated through a simple synthetic experiment, which shows that the lateral variations of the wave speed can produce traveltime differences ranging from –1.5 and 1.5 s for P waves and from –2.5 and 2.5 s for S waves at local to regional distances. Such values are far larger than phase picking uncertainties and would likely affect earthquake hypocentral parameter estimations. The new 3-D model thus provides a basis for regional studies including earthquake source studies, Earth structure investigations and geodynamic modelling of Iberia and its surroundings.
Empirical relations between elastic wavespeeds and density in the Earth's crust
[J].DOI:10.1785/0120050077 URL [本文引用: 1]
Precambrian geology of China
[J].DOI:10.1016/j.precamres.2012.09.017 URL [本文引用: 2]
华南大陆东部若干构造问题的思考
[J].
A tentative discussion on some tectonic problems in the east of South China continent
[J].
江南造山带深部边界及成矿制约:来自综合地球物理的认识
[J].
The deep boundaries of Jiangnan orogenic belt and its constraints on metallogenic:From the understanding of integrated geophysics
[J].DOI:10.18654/1000-0569/2022.02.16 URL [本文引用: 1]
Crustal thickness and Poisson's ratios of South China revealed from joint inversion of receiver function and gravity data
[J].DOI:10.1016/j.epsl.2018.12.039 URL [本文引用: 5]
A seismic reference model for the crust and uppermost mantle beneath China from surface wave dispersion
[J].DOI:10.1093/gji/ggw175 URL [本文引用: 9]
The structure of the crust and uppermost mantle beneath South China from ambient noise and earthquake tomography
[J].DOI:10.1111/gji.2012.189.issue-3 URL [本文引用: 9]
Eikonal tomography:Surface wave tomography by phase front tracking across a regional broad-band seismic array
[J].DOI:10.1111/gji.2009.177.issue-3 URL [本文引用: 1]
Crustal thickness map of the Chinese mainland from teleseismic receiver functions
[J].DOI:10.1016/j.tecto.2013.11.019 URL [本文引用: 1]
Seismic evidence for a Geosuture between the Yangtze and Cathaysia Blocks,South China
[J].
Investigation of the Moho discontinuity beneath the Chinese mainland using deep seismic sounding profiles
[J].DOI:10.1016/j.tecto.2012.11.024 URL [本文引用: 1]
深地震探测揭示的华南地区莫霍面深度
[J].
The Moho depth of South China revealed by seismic probing
[J].
USTClitho2.0:Updated unified seismic tomography models for Continental China Lithosphere from joint inversion of body-wave arrival times and surface-wave dispersion data
[J].
DOI:10.1785/0220210122
URL
[本文引用: 9]
Xin et al. (2019) presented 3D seismic velocity models (VP and VS) of crust and uppermost mantle of continental China using seismic body-wave travel-time tomography, which are referred to as Unified Seismic Tomography Models for Continental China Lithosphere 1.0 (USTClitho1.0). Compared with previous models of continental China, the VP and VS models of USTClitho1.0 have the highest spatial resolution of 0.5°–1.0° in the horizontal direction and are useful for better understanding the complex tectonics of continental China. Although USTClitho1.0 is implicitly constrained by surface-wave data by using the VS model from surface-wave tomography and the converted VP model as initial models for body-wave travel-time tomography, the predicted surface-wave dispersion curves from USTClitho1.0 do not fit the observed data well. Here, we present updated 3D VP and VS models of the continental China lithosphere (USTClitho2.0) by joint inversion of body-wave arrival times and surface-wave dispersion data. Compared with the previous joint inversion scheme of Zhang et al. (2014), similar to Fang et al. (2016), it is further improved by including the sensitivity of surface-wave dispersion data to VP in the new joint inversion system. As a result, the shallow VP structure is also better imaged. In addition, the new joint inversion scheme considers the large topography variations between the eastern and western parts of China. Thus, USTClitho2.0 better resolves the upper-crustal structure of the Tibetan plateau. Compared with USTClitho1.0, USTClitho2.0 fits both body-wave arrival times and surface-wave dispersion data. Thus, the new velocity models are more accurate and can serve as a better reference model for regional-scale tomography and geodynamic studies in continental China.
High-resolution lithospheric velocity structure of continental China by double-difference seismic travel-time tomography
[J].DOI:10.1785/0220180209 URL [本文引用: 1]
扬子区地壳密度扰动成像和华南燕山期花岗岩成因
[J].
Crustal density imaging of Yangtze Craton and formation of the Yanshanian Granitites in South China
[J].
湖北大冶铜山口地区地球物理深部找矿模式
[J].
Geophysical deep ore-prospecting model for Tongshankou area of Daye,Hubei Province
[J].
基于地球物理重磁特征的扬子古陆与华夏陆块边界划分
[J].
Boundary division of Yangtze ancient land and Cathaysia land block in the Guangxi section based on geophysical gravity and magnetic feature
[J].
