

0 引言
谱蓝化利用实际地震频率与振幅正相关“蓝谱”特征,将地震和测井反射系数谱进行匹配求取蓝化算子,将该算子与地震褶积得到拓频数据,通过这种井控思路来提高地震分辨率。Blache-Fraser G[8]首次提出谱蓝化与有色反演开展叠后地震高分辨率处理思想。近几年,国内外学者也开展了诸多相关研究,Neep[9]提出时变谱蓝化思想,通过分时窗求取蓝化算子,解决大时窗谱均衡问题;国内学者杨瑞召等[10]、陈文雄[11]利用谱蓝化技术较好地解决了薄煤层识别、薄储层刻画难题,杨培杰[12]提出了复数域约束最小二乘谱蓝化,通过设计一个宽频约束目标谱,更好地提高地震主频,这些方法均取得较好应用效果,但方法应用主要聚焦叠后资料高分辨率处理。Kazemeini等[13]在叠后谱蓝化基础上,提出将谱蓝化算子应用到叠前道集处理中,并论证了叠前谱蓝化相较于叠后方法的优势;李贤兵等[14]利用叠前谱蓝化在薄隔层识别及砂体边界取得较好成效,但叠前谱蓝化技术应用依然局限于叠后资料优化对比,这对于中深层阻抗混叠区局限性较大。
1985年Shuey[15]简化了Zoeppritz方程,首次提出反射系数中AVO截距和梯度概念,随后,Rutherford等[16]、Castagna等[17]进一步深化了AVO属性油气检测研究。近几年,国内学者利用截距、梯度属性也开展了相关甜点、油气检测等研究,王迪等[18]通过变参数正演模拟建立了致密气甜点储层的AVO定量解释量板;付琛等[19]针对常规AVO属性识别气层难,提出一种相对AVO属性,较好地放大了气、水层的AVO差异,这些应用主要集中在油气识别上;在岩性识别上,刘力辉等[20]利用AVO梯度与泊松比变化率的正相关性,采用AVO梯度90°相移进行储层刻画,并在四川盆地取得较好应用效果,但缺乏对AVO梯度界面判别的系统性论证。
针对XH凹陷中深层薄储层刻画难及叠后谱蓝化局限性较大等问题,本文首先通过变参数正演模拟论证了AVO梯度对中深层砂岩顶界面辨别的精度及稳定性,在此基础上,针对薄互层刻画难问题,利用AVO梯度与泊松比变化率的正相关性,提出一种基于AVO梯度信息的谱蓝化拓频技术,该方法直接对反映叠前信息的AVO梯度作类似叠后地震谱蓝化拓频,规避了CRP道集高分辨率处理的复杂性,同时,提高了薄储层识别精度。
1 AVO梯度界面识别
1.1 AVO梯度原理
Shuey对Zoeppritz方程进行近似,提出AVO截距和梯度,其反射系数公式为:
其中:
式中,
进一步地,将式(1)简写成:
当
图1
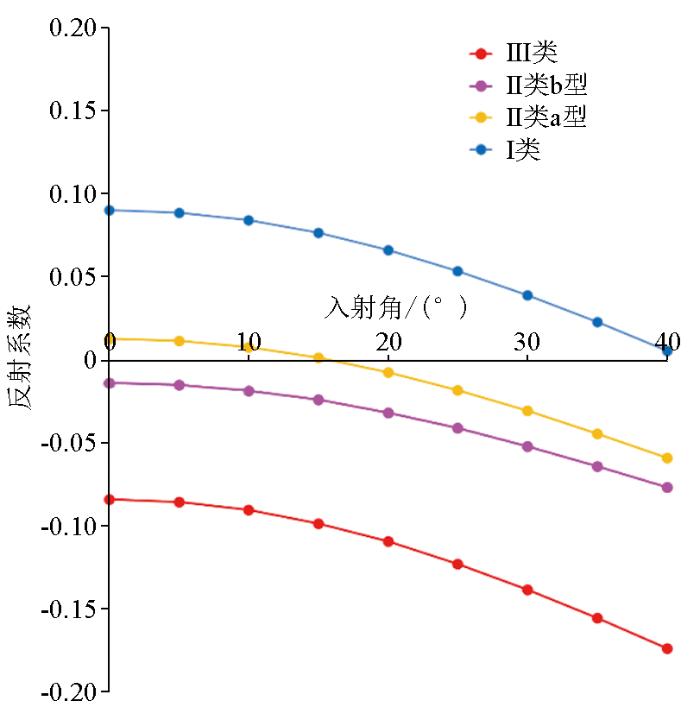
表1 4种AVO类型砂岩弹性参数
Table 1
| 纵波速度/ (m·s-1) | 横波速度/ (m·s-1) | 密度/ (g·cm-3) | 纵波阻抗/ (g·cm-3·m·s-1) | |
|---|---|---|---|---|
| Ⅰ类砂岩 | 5300 | 3050 | 2.55 | 13515 |
| Ⅱ类a型砂岩 | 4700 | 2800 | 2.49 | 11703 |
| Ⅱ类b型砂岩 | 4300 | 2610 | 2.47 | 10621 |
| 三类砂岩 | 3850 | 2600 | 2.40 | 9240 |
| 上覆介质 | 4150 | 2220 | 2.65 | 10997.5 |
1.2 界面辨别可靠性分析
结合公式原理及不同砂岩AVO类型,证实了AVO梯度在中深层砂岩顶界面辨识的可行性,进一步地,本次研究通过岩性组合模式、储层物性及流体等参数变化论证AVO梯度砂岩顶界面辨识的可靠性。
图2
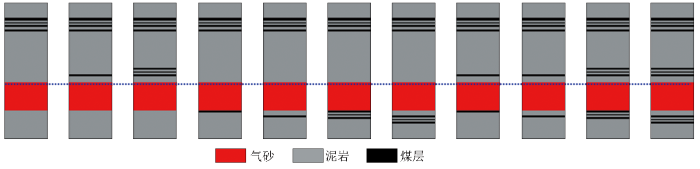
图2
靶区11类岩性组合模式
Fig.2
Eleven types of lithological association in the target area
表2 靶区不同岩性弹性参数
Table 2
| 岩相 | 纵波速度/(m·s-1) | 横波速度/(m·s-1) | 密度/(g·cm-3) | 纵波阻抗/(m·s-1·g·cm-3) | Vp/Vs |
|---|---|---|---|---|---|
| 泥岩 | 3920 | 2130 | 2.64 | 10349 | 1.84 |
| 煤层 | 3100 | 1615 | 1.94 | 6014 | 1.92 |
| 气层 | 4000 | 2469 | 2.40 | 9600 | 1.62 |
| 水层 | 4140 | 2437 | 2.42 | 10018 | 1.70 |
图3
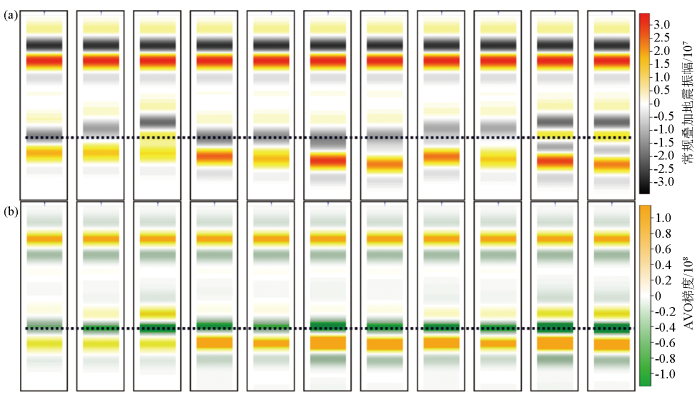
图3
气层模式下不同岩性组合正演分析
a—常规叠加地震;b—AVO梯度
Fig.3
Forward modeling of different lithological associations in gas case
a—normal post-stack seismic;b—AVO gradient
图4
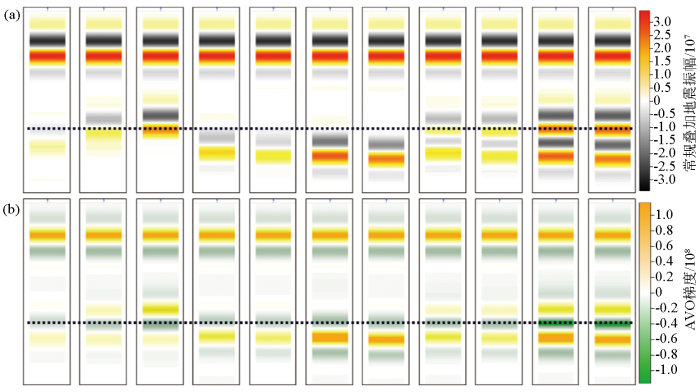
图4
水层模式下不同岩性组合正演分析
a—常规叠加地震;b—AVO梯度
Fig.4
Forward modeling of different lithological associations in water case
a—normal post-stack seismic;b—AVO gradient
图5
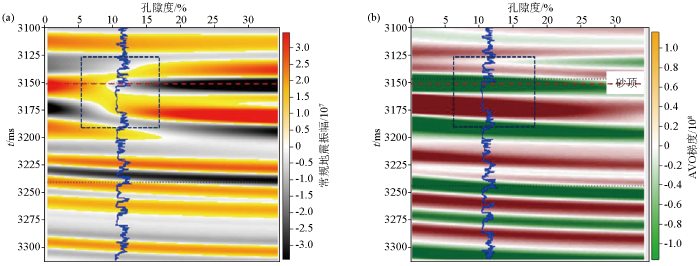
图5
储层孔隙度变化下的正演对比分析
a—不同孔隙下砂顶常规地震变化;b—不同孔隙下砂顶AVO梯度变化
Fig.5
Forward modeling based on reservoir porosity change
a—normal post-stack seismic change of different porosity;b—AVO gradient change of different porosity
通过岩性组合模式、流体及物性变化正演分析,研究表明:相比于常规地震,AVO梯度对储层顶界面指示性较好,表现为稳定的负相位,且不受地层埋深、压实等变化影响。基于此,直接利用反映叠前信息的AVO梯度,采用叠后方法解决中深层储层精细刻画问题。
2 叠前AVO梯度谱蓝化技术
2.1 技术原理及流程
谱蓝化地震高分辨率处理的实质是对测井反射系数频谱与地震数据频谱进行匹配求取蓝化算子,然后将算子和原始地震数据进行褶积得到优化后的拓频数据。本次研究在此基础上,对AVO梯度进行谱蓝化,提高中深层薄互砂岩刻画精度,具体流程如下:
1)AVO梯度地震频谱计算。选取目标井附近AVO梯度地震道,计算目的层段地震平均频谱
式中:
2)测井反射系数频谱计算。传统谱蓝化主要针对叠后地震,求取测井波阻抗反射系数频谱,基于AVO梯度与泊松比变化率的相关性,本次研究依据式(5)求取泊松比
通过傅里叶变换求取泊松比反射系数频谱
3)谱蓝化算子求取。计算AVO梯度地震频谱和泊松比反射系数频谱的谱蓝化算子,使得两者差异最小化:
式中:
4)AVO梯度拓频数据计算。将时间域谱蓝化算子
2.2 模型试算
图6
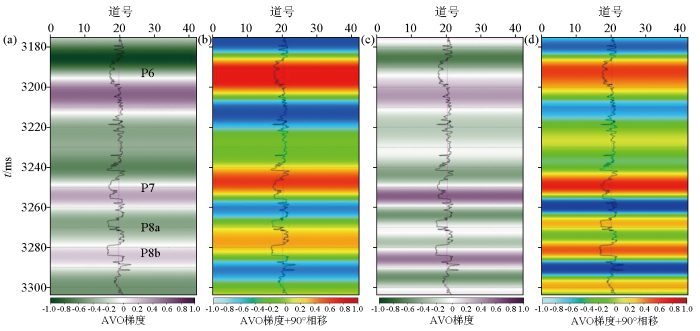
图6
靶区A-1井叠前AVO梯度谱蓝化效果分析
a—原始AVO梯度;b—原始AVO梯度+90°相移;c—谱蓝化AVO梯度;d—谱蓝化AVO梯度+90°相移
Fig.6
Analysis of pre-stack AVO gradient spectral bluing for well A-1
a—raw AVO gradient;b—90°phase shift of raw AVO gradient;c—spectral bluing AVO gradient;d—90°phase shift of spectral bluing AVO gradient
3 应用实例
前面通过理论模型正演论证了AVO梯度谱蓝化拓频可行性,进一步地,基于靶区实钻井、震数据验证该方法在实际应用中的效果。A-1、A-1S井为XH凹陷斜坡带钻遇的两口深探井,目的层埋深约4 300 m,其中高部位A-1井P8a、P8b分别钻遇10 m、9.5 m优质气层,低部位A-1S井分别钻遇27 m气水层、2 m气层,钻后测试数据揭示P8a、P8b高低部位砂体各自相连通,如图7所示。
图7
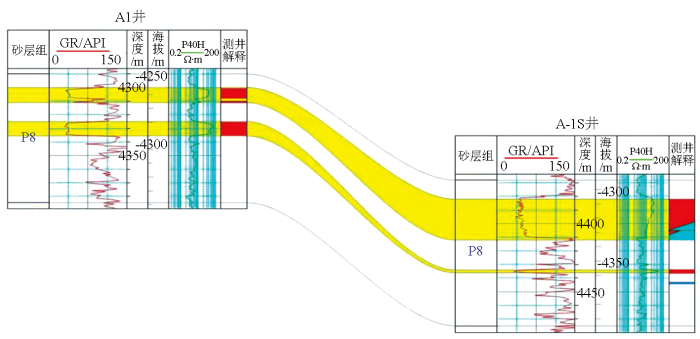
图8
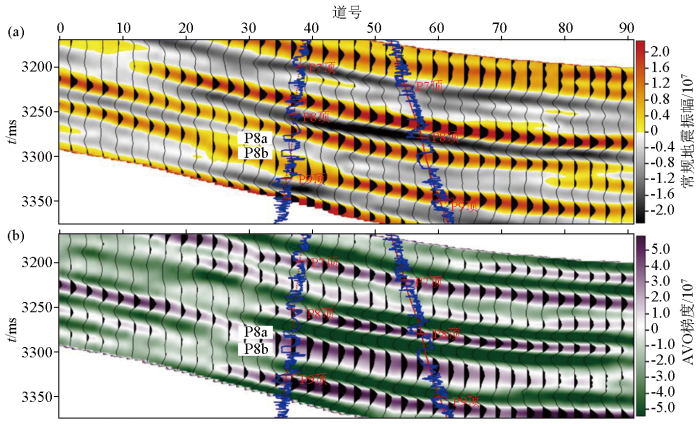
图8
过探井常规地震(a)及AVO梯度剖面(b)
Fig.8
Normal post-stack seismic(a) and AVO gradient(b) through exploration wells
图9
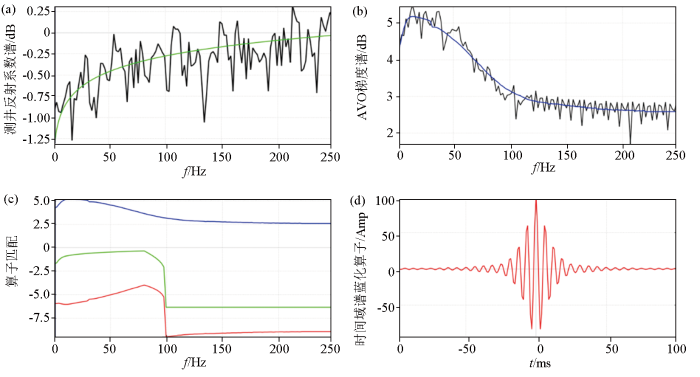
图9
谱蓝化算子求取流程
a—测井反射系数谱计算;b—AVO梯度频谱计算;c—谱蓝化算子匹配;d—时间域谱蓝化算子
Fig.9
Process of spectrum bluing operator calculation
a—calculation of well-log’s reflection spectrum;b—calculation of AVO gradient spectrum;c—calculation of bluing operator;d—bluing operator in the time domain
图10
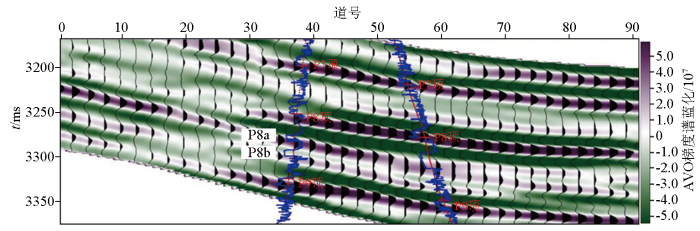
图10
过探井AVO梯度谱蓝化拓频剖面
Fig.10
AVO gradient section based on spectral bluing technique through exploration wells
为了更直观对比AVO梯度谱蓝化前后数据对薄储层的预测精度,将原始AVO梯度和拓频AVO梯度分别作90°相移,使得地震界面信息判别转为更直观的岩性厚度识别,图11a为原始AVO梯度90°相移岩性预测剖面,图11b为谱蓝化拓频AVO梯度90°相移岩性预测剖面,红色表征砂岩,浅蓝色偏泥岩,对比可知,谱蓝化拓频后AVO梯度岩性预测与A-1及A-1S井薄层匹配性更高,高部位A-1井P8a实钻10 m,反演厚度12 m,相较于拓频前反演的16 m,厚度精度更高,P8b实钻9.5 m,反演厚度8.5 m,优化后反演不仅有效地凸显P8b且厚度误差较小(约10.5%);低部位A-1S井P8a实钻厚度27 m,拓频前、后精度相近,但2 m 的P8b薄气层响应得到较好凸显,整体上,基于AVO梯度谱蓝化的岩性预测方法在保留较厚储层预测精度基础上,薄层刻画有较大改善。
图11
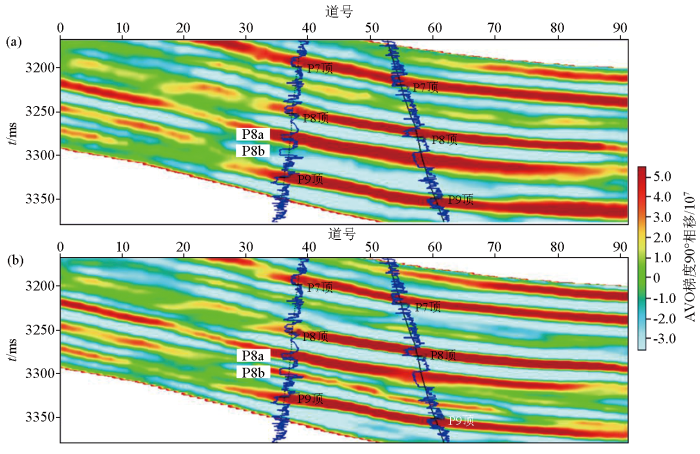
图11
AVO梯度谱蓝化前(a)后(b)岩性预测效果对比
Fig.11
Lithology prediction comparison before(a) and after(b) AVO gradient spectral bluing
4 结论及讨论
中深层砂、泥岩阻抗混叠严重,利用常规地震表征岩性存在多解性,本文提出利用AVO梯度辨别砂、泥岩界面信息,通过岩性组合、物性及流体参数变化论证了该地震属性辨别砂岩顶界面的可行性及可靠性,为中深层储层刻画提出了一种行之有效的新方法。
传统的谱蓝化拓频主要应用于叠后地震数据,在中深层应用局限性较大。结合对砂、泥岩界面辨别更加敏感的AVO梯度信息,本文提出一种基于AVO梯度的谱蓝化拓频技术,通过理论模型试算及实际工区数据应用,验证了该方法在中深层高分辨率处理的适用性。
AVO梯度计算与CRP道集质量关联性强,较差的CRP道集会影响AVO梯度计算的精度,即AVO梯度抗噪性一般,因此,在使用AVO梯度砂、泥岩界面识别中,需要评估或优化CRP道集质量,这也是今后进一步研究需要讨论的问题。
参考文献
提高地震分辨率处理效果定量评价方法研究
[J].
The quantitative evaluation method of seismic high resolution processing effect
[J].
小波谱白化方法提高地震资料的分辨率
[J].
Improving resolution of seismic data using wavelet spectrum whitening
[J].
非稳态地震稀疏反褶积
[J].
A nonstationary perspective on sparse deconvolution
[J].
一种基于连续补偿函数的时变增益限反Q滤波方法
[J].
A new time-varying gain limits inverse Q filtering with the continuous compensation function
[J].
High resolution gathers by inverse Q filtering in the wavelet domain
[J].
基于Gabor变换的地震资料高分辨率处理方法研究
[J].
High-resolution processing method of seismic data based on Gabor transform
[J].
Increasing seismic resolution using spectral blueing and colored inversion:Cannonball field,Trinidad
[C]//
Time-variant colored inversion and spectral blueing
[C]//
利用谱蓝化和有色反演分辨薄煤层
[J].
Thin coal bed resolution by using seismic spectral blueing and colored inversion
[J].
渤海西南部新近系超薄储层定量预测技术研究与应用
[J].
Research and application of quantitative prediction technique for ultrathin reservoir in the neogene of southwestern Bohai sea
[J].
复数域约束最小二乘拓频
[J].
Constrained complex-domain least-squares spectrum blueing
[J].
Enhancing seismic data resolution using the prestack blueing technique:An example from the Ketzin CO2 injection site,Germany
[J].
叠前谱蓝化提频技术在乍得Baob油田储层预测中的应用
[J].
Pre-stack spectrum blueing frequency increasing technique:A case study on reservoir prediction in Chad Baob Oilfield
[J].
A simplification of Zoeppritz equations
[J].
DOI:10.1190/1.1441936
URL
[本文引用: 1]

The compressional wave reflection coefficient R(θ) given by the Zoeppritz equations is simplified to the following: [Formula: see text] The first term gives the amplitude at normal incidence (θ = 0), the second term characterizes R(θ) at intermediate angles, and the third term describes the approach to critical angle. The coefficient of the second term is that combination of elastic properties which can be determined by analyzing the offset dependence of event amplitude in conventional multichannel reflection data. If the event amplitude is normalized to its value for normal incidence, then the quantity determined is [Formula: see text] [Formula: see text] specifies the normal, gradual decrease of amplitude with offset; its value is constrained well enough that the main information conveyed is [Formula: see text] where [Formula: see text] is the contrast in Poisson’s ratio at the reflecting interface and [Formula: see text] is the amplitude at normal incidence. This simplified formula for R(θ) accounts for all of the relations between R(θ) and elastic properties first described by Koefoed in 1955.
Amplitude-versus-offset variations in gas sands
[J].
DOI:10.1190/1.1442696
URL
[本文引用: 1]
Seismic reflections from gas sands exhibit a wide range of amplitude‐versus‐offset (AVO) characteristics. The two factors that most strongly determine the AVO behavior of a gas‐sand reflection are the normal incidence reflection coefficient [Formula: see text] and the contrast in Poisson’s ratio at the reflector. Of these two factors, [Formula: see text] is the least constrained. Based on their AVO characteristics, gas‐sand reflectors can be grouped into three classes defined in terms of [Formula: see text] at the top of the gas sand. Class 1 gas sands have higher impedance than the encasing shale with relatively large positive values for [Formula: see text]. Class 2 gas sands have nearly the same impedance as the encasing shale and are characterized by values of [Formula: see text] near zero. Class 3 sands have lower impedance than the encasing shale with negative, large magnitude values for [Formula: see text]. Each of these sand classes has a distinct AVO characteristic. An example of a gas sand from each of the three classes is presented in the paper. The Class 1 example involves a Hartshorn channel sand from the Arkoma Basin. The Class 2 example considers a Miocene gas sand from the Brazos offshore area of the Gulf of Mexico. The Class 3 example is a Pliocene gas sand from the High Island offshore area of the Gulf of Mexico.
Framework for AVO gradient and intercept interpretation
[J].
DOI:10.1190/1.1444406
URL
[本文引用: 1]
Amplitude variation with offset (AVO) interpretation may be facilitated by crossplotting the AVO intercept (A) and gradient (B). Under a variety of reasonable petrophysical assumptions, brine‐saturated sandstones and shales follow a well‐defined “background” trend in the A-B plane. Generally, A and B are negatively correlated for “background” rocks, but they may be positively correlated at very high [Formula: see text] ratios, such as may occur in very soft shallow sediments. Thus, even fully brine‐saturated shallow events with large reflection coefficients may exhibit large increases in AVO. Deviations from the background trend may be indicative of hydrocarbons or lithologies with anomalous elastic properties. However, in contrast to the common assumptions that gas‐sand amplitude increases with offset, or that the reflection coefficient becomes more negative with increasing offset, gas sands may exhibit a variety of AVO behaviors. A classification of gas sands based on location in the A-B plane, rather than on normal‐incidence reflection coefficient, is proposed. According to this classification, bright‐spot gas sands fall in quadrant III and have negative AVO intercept and gradient. These sands exhibit the amplitude increase versus offset which has commonly been used as a gas indicator. High‐impedance gas sands fall in quadrant IV and have positive AVO intercept and negative gradient. Consequently, these sands initially exhibit decreasing AVO and may reverse polarity. These behaviors have been previously reported and are addressed adequately by existing classification schemes. However, quadrant II gas sands have negative intercept and positive gradient. Certain “classical” bright spots fall in quadrant II and exhibit decreasing AVO. Examples show that this may occur when the gas‐sand shear‐wave velocity is lower than that of the overlying formation. Common AVO analysis methods such as partial stacks and product (A × B) indicators are complicated by this nonuniform gas‐sand behavior and require prior knowledge of the expected gas‐sand AVO response. However, Smith and Gidlow’s (1987) fluid factor, and related indicators, will theoretically work for gas sands in any quadrant of the A-B plane.
AVO定量解释模板在LX地区致密气“甜点”预测中的应用
[J].
DOI:10.3969/j.issn.1000-1441.2020.06.012
[本文引用: 1]
鄂尔多斯盆地东缘LX地区二叠系石盒子组发育河流相致密砂岩储层,具有低孔、低渗且非均质性强的特点,优选“甜点”是取得产能突破的关键。勘探结果表明,基于叠后振幅属性预测气层存在多解性。对比分析井旁地震道集发现,气层和干层的叠前AVO响应特征存在差异,且与储层参数具有一定相关性。为此,从研究区沉积模式入手,建立泥砂泥3层介质模型,通过开展变参数AVO正演模拟,分析孔隙度、厚度以及含气饱和度变化对截距属性(P)和梯度属性(G)的影响。模拟结果表明,孔隙度和厚度是决定AVO响应特征的主控因素。通过构建AVO定量解释模版,并拟合截距和梯度属性与孔隙度和厚度之间的数学函数关系,实现孔隙度和厚度的半定量定量预测。应用结果表明,“甜点”预测结果与已钻井吻合率较高,孔隙度和厚度定量预测误差控制在20%以内,依据预测结果部署的新钻井L6井获得了高产天然气,取得了良好的应用效果。
Application of an AVO template to identify sweet spots in a tight sandstone reservoir in the LX area
[J].
根据AVO相对变化识别流体的新方法
[J].
A new method for fluid identification based on relative changes in AVO
[J].
叠前AVO属性的地震岩性学探索与实践研究
[J].
DOI:10.3969/j.issn.1000-1441.2013.03.004
[本文引用: 1]
自地震沉积学诞生以来,国内众多学者主要的研究方向集中在地震地貌学上,而对于地震岩性学却鲜有研究。以往对于地震岩性的表征技术主要为90°相位化和叠后反演,但在复杂地区这两种方法都存在一定的缺陷。为此,在前期研究中提出了地震岩性体概念:将地震数据转化为有明确岩性意义的地震属性体,来表征地震地貌。重新推导了AVO属性表达式,选择其中新的G属性作为地震岩性体,并在四川盆地中部某研究区取得了较好的应用效果。
Exploration and practical study of pre-stack AVO property on seismic lithology
[J].
