

0 引言
黑土作为世界上最肥沃的土壤之一[1],素有“土中之王”的美誉。自然黑土是在适宜的气候、水文和植被覆盖条件下,以黄土状黏土、洪积物、冲积物、冰碛物及风积物等松散沉积物为成土母质,历经第四纪全新世以来漫长的发育,形成具有独特自然属性的土壤类型,其表土层有大量黑色或暗黑色腐殖质,有机质含量高,是一种性状好、肥力强、适宜农耕的珍贵稀缺土地资源[2-3]。曾经农民只能根据土壤的颜色、地力以及厚度是否超过一犁厚来辨别肥沃的黑土[4],经过国内外学者的持续关注和多年系统研究,专家认为黑土的特征主要包括深厚的暗沃表层、含量丰富的有机质、适宜的容重、良好的团粒结构、较高的盐基饱和度和适宜的pH值等[3]。目前,全球黑土区总面积约占地球陆地表面的7%,主要分布在世界四大黑土区:俄罗斯—乌克兰大平原、北美洲密西西比河流域、中国东北平原以及南美洲的潘帕斯草原[5]。我国政府历来高度关注黑土地的保护和利用,2020年习近平总书记在东北考察时指示“切实把黑土地这个‘耕地中的大熊猫’保护好、利用好,使之永远造福人民”[6]。
土地利用包括土地的使用情况及其社会经济属性[7]。随着全球经济的高速发展、人口爆炸式增长以及生态资源压力的日益严峻,受自然条件及人类活动的综合影响,世界范围内30%以上土地的利用格局发生着剧烈的变化[8]。土地利用/覆盖变化易引发土壤微生物、土壤碳储量的变化[9⇓-11],从而改变生态系统的结构和功能[12-13],影响生态环境健康和生态服务价值[14]。据研究表明,全球人类活动排放的二氧化碳中有1/3是由土地利用/覆盖变化造成的,仅次于化石燃料的燃烧[15]。土地利用/覆盖变化是人类活动作用于地球表层系统最为显著的表现形式和人与自然关系最为密切的环节之一[16-17],分析研究土地利用变化特征对实现土地资源的可持续利用具有重要意义,也是当代全球变化研究领域的重点课题[18]。
1 研究区概况
根据2021年中国科学院发布的《黑土地白皮书》,中国东北黑土区包括黑龙江省、吉林省、辽宁省东北部以及内蒙古“东四盟”地区,东邻俄罗斯、东南紧靠朝鲜,西与蒙古交界,南抵辽河,共含246个县(市、旗),面积达109万km2,占全球黑土总面积的12%[5]。东北黑土区位于中纬度亚洲大陆东部,属温带季风性气候,四季分明、雨热同季[19]。中国东北地区的黑土是以砂砾和黄土状黏土为主要成土母质,并在其特有的气候条件和植被的相互作用下形成的土壤类型[4,20]。夏季旺盛生长的植被进入秋冬后大量枯死,低温又抑制了土壤中的微生物活性,使植物残体分解缓慢,长此以往土壤表层积累了厚厚的腐殖层,最终发育成肥沃的黑土[3,19]。
东北黑土区是全球最适宜耕作的地区之一,也是我国最大的商品粮生产基地[2],玉米和大豆产量占全国38.2%和45.8%[21],粮食总产量占全国的四分之一,粮食调出量占全国的三分之一[22],人均粮食占有量比全国人均量高一倍以上[23],享有“中国粮仓”和粮食安全“稳压器”的美誉[24-25]。根据2010年国务院发布的《全国主体功能区规划》,东北黑土区涵盖了大、小兴安岭森林生态功能区、三江平原湿地生态功能区、长白山森林生态功能区、呼伦贝尔草原草甸生态功能区及部分科尔沁草原生态功能区[26];作为我国重要的老工业基地,东北黑土区是我国重要的能源、木材、冶金生产基地,几十年间先后经历了经济发展、衰落到再振兴的过程[13]。
2 数据来源
本研究所需的土地利用/覆盖数据来源于中国科学院资源环境科学数据中心(
表1 土地利用类型归类
Table 1
| 土地利用类型 | 土地利用属性 |
|---|---|
| 耕地 | 水田、旱地 |
| 林地 | 有林地、灌木林、疏林地和其他林地 |
| 草地 | 高覆盖度草地、中覆盖度草地和低覆盖度草地 |
| 湿地 | 河渠、湖泊、水库坑塘、滩涂、滩地和沼泽地 |
| 建设用地 | 城镇用地、农村居民点和其他建设用地 |
| 未利用地 | 沙地、戈壁、盐碱地、永久性冰川雪地、裸土地、裸岩石质地和其他未利用土地 |
3 研究方法
3.1 土地利用转移矩阵
表2 土地利用转移矩阵
Table 2
| 地类 | A1 | A2 | … | Aj | … | An | 期初面积 | 减少面积 |
|---|---|---|---|---|---|---|---|---|
| A1 | P11 | P12 | … | P1j | … | P1n | P1+ | P1+-P11 |
| A2 | P21 | P22 | … | P2j | … | P2n | P2+ | P2+-P22 |
| … | … | … | … | … | … | … | … | … |
| Ai | Pi1 | Pi2 | … | Pij | … | Pin | Pi+ | Pi+-Pii |
| … | … | … | … | … | … | … | … | … |
| An | Pn1 | Pn2 | … | Pnj | … | Pnn | Pn+ | Pn+-Pnn |
| 期末面积 | P+1 | P+2 | … | P+j | … | P+n | 1 | - |
| 增加面积 | P+1-P11 | P+2-P22 | … | P+j-Pjj | … | P+n-Pnn | - | - |
3.2 土地净变化量
3.3 土地交变化量
3.4 土地利用类型转移网络
基于土地利用类型转移矩阵, 引入“土地利用转移流”指标, 测算各土地利用类型的“转出流”及“转入流”,将得到土地利用类型转移网络[8],它可以直观地表明一段周期内土地利用类型间的相互转换情况,有助于揭示土地利用类型的转移方向和空间演化进程。土地利用转移流B3及土地转移流净值B4计算公式为:
式中:Pout为转出流, Pin为转入流。当B4值为正时,表示净流入,其值为负时,表示净流出。
3.5 单项地类面积变化率
单项地类面积变化率表示一段时间内某一地类变化面积占期初面积的比值,在分区的基础上计算各小区单项地类面积变化率,有助于揭示不同地类土地利用变化剧烈程度的空间分布特征[31]。单项地类面积变化率B5计算公式为:
3.6 单一土地利用类型动态度
式中:B6为第i种地类单一土地利用类型动态度;T为研究时段,此处以年为单位。
3.7 土地利用综合动态度
3.8 土地利用程度综合指数
式中:B8为研究区土地利用程度综合指数;Ai为第i级土地利用程度分级指数;Si为第i级土地利用面积;S为该区域内土地总面积;n为土地利用总分类数。
3.9 土地利用空间变化模型
式中:XB、YB分别表示在t年份某一地类分布重心的经度和纬度坐标;Cti表示在t年份研究区内第i种地类的面积;Xi、Yi分别表示研究区内第i个小区域的几何中心(或旗县所在地)的经纬度坐标。
4 结果与分析
4.1 土地利用空间变化、面积变化
4.1.1 面积变化
近半个世纪以来,东北黑土区各类土地利用面积均发生不同程度和趋势的变化(图1)。其中,湿地面积整体大幅降低,2020年黑土区湿地面积较1970年降低了41.2%,除1995~2010时段湿地面积显著增加外,1970~1995年、2010~2020年均持续降低;50年间黑土区耕地(含水田和旱田)面积整体增加24.88%,除2010~2020年受退耕还林、退耕还草、退耕还湿政策,生态保护红线划定及城市建设用地快速扩张的影响,耕地面积小幅降低以外,其他各期均呈增长趋势;50年间黑土区林地面积较期初下降6.94%,且近半个世纪以来各期变化均呈现持续降低趋势;50年间黑土区草地面积整体增加9.75%,除1995~2010时段呈降低趋势,其他各期面积均程增加态势;50年间黑土区建设用地面积整体增加25.69%,且各期均呈持续增长态势;50年间黑土区未利用土地面积整体下降7.69%,除1995~2010年面积增加外,其他各期面积均呈现降低趋势。
图1
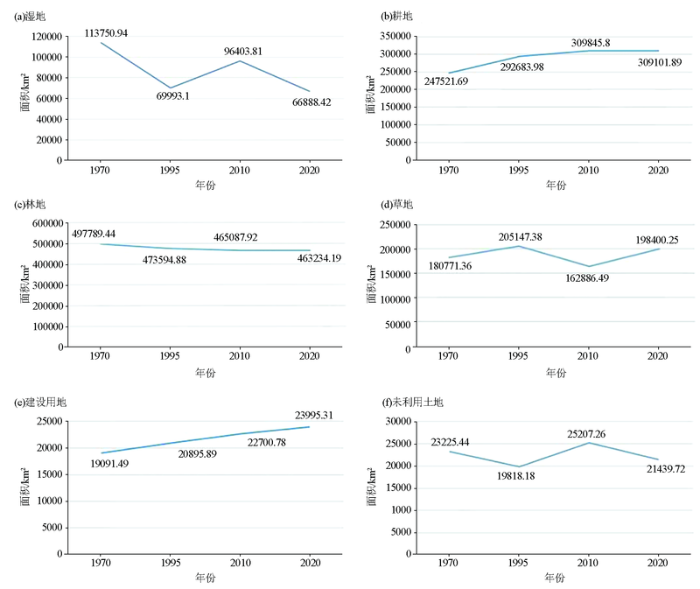
图1
1970~2020年各类土地利用面积变化
Fig.1
Line chart of land use area changes for various types from 1970 to 2020
4.1.2 空间变化
1970~2020年间,黑土区土地利用空间转移主要集中于三江平原北部、松嫩平原西北部及西辽河平原地区等(图2)。其中,草地主要向耕地和林地转化,草地转化为耕地主要分布于三江平原、嫩江中上游、呼伦贝尔市周边、松原市南部、通辽市西部等地;草地转化为林地主要分布于兴安盟西部、科尔沁草原南部、呼伦贝尔草原南部及大小兴安岭地区;耕地主要向林地和草地转化,其中,耕地转化为林地主要分布于齐齐哈尔市西北部、白城市北部、通辽市东部及延吉市周边等区域,耕地转化为草地主要分布于呼伦贝尔草原北部及西辽河平原等地区;林地主要向耕地和草地转化,其中,林地转化为耕地主要分布于大小兴安岭南部、三江平原部分区域及长白山部分地区,林地转化为草地主要分布于兴安盟西南部及呼伦贝尔草原南部;湿地主要向耕地和草地转化,其中,湿地转化为耕地主要分布于三江平原及嫩江周边地区,湿地转化为草地主要分布于大小兴安岭及呼伦贝尔大草原;建设用地主要向耕地转化,呈零散分布;未利用地主要向草地转化,主要分布于呼伦贝尔市西南部及松嫩平原西部。
图2
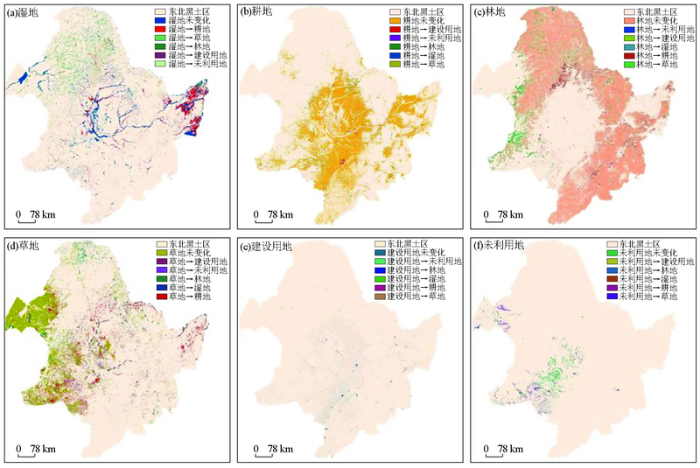
图2
1970~2020年各类土地利用空间转移情况
Fig.2
The spatial transfer of land use for various types from 1970 to 2020
4.2 土地利用转移矩阵及各项变化
4.2.1 土地利用转移矩阵
根据土地利用转移矩阵(表3、表4),近半个世纪以来,东北黑土区耕地未变化面积占20.3%,耕地向其他用地类型转化面积共占2.58%,其他用地类型向耕地转化面积共占8.26%;林地未变化面积占38.92%,林地向其他用地类型转化面积共占7.08%,其他用地类型向林地转化面积共占3.87%;草地未变化面积占10.53%,草地向其他用地类型转化面积共占6.17%,其他用地类型向草地转化面积共占7.74%;湿地未变化面积占4.33%,湿地向其他用地类型转化面积共占6.18%,其他用地类型向湿地转化面积共占1.85%;建设用地未变化面积占1.4%,建设用地向其他用地类型转化面积共占0.36%,其他用地类型向建设用地转化面积共占0.82%;未利用地未变化面积占1.23%,未利用地向其他用地类型转化面积共占0.91%,其他用地类型向未利用地转化面积共占0.75%。
表3 1970~2020年黑土区土地利用面积转移矩阵
Table 3
| 土地类型 | 耕地 | 林地 | 草地 | 湿地 | 建设用地 | 未利用地 | 期初 | 减少 |
|---|---|---|---|---|---|---|---|---|
| 耕地 | 2196.40 | 80.39 | 89.28 | 44.30 | 58.09 | 6.71 | 2475.17 | 278.77 |
| 林地 | 306.96 | 4212.16 | 389.52 | 56.19 | 7.73 | 5.38 | 4977.93 | 765.78 |
| 草地 | 301.58 | 207.69 | 1139.65 | 86.16 | 15.6 | 57.03 | 1807.71 | 668.06 |
| 湿地 | 243.91 | 122.88 | 286.02 | 468.81 | 4.67 | 10.97 | 1137.25 | 668.44 |
| 建设用地 | 30.22 | 1.95 | 4.48 | 1.83 | 151.54 | 0.9 | 190.91 | 39.37 |
| 未利用地 | 10.73 | 6.18 | 68.49 | 11.28 | 2.31 | 133.27 | 232.25 | 98.98 |
| 期末 | 3089.8 | 4631.26 | 1977.43 | 668.56 | 239.93 | 214.25 | 10821.23 | 2519.40 |
| 新增 | 893.4 | 419.1 | 837.78 | 199.75 | 88.39 | 80.99 | 2519.4 |
表4 1970~2020年黑土区土地利用转移率矩阵
Table 4
| 土地类型 | 耕地 | 林地 | 草地 | 湿地 | 建设用地 | 未利用地 | 期初 | 减少 |
|---|---|---|---|---|---|---|---|---|
| 耕地 | 20.30 | 0.74 | 0.83 | 0.41 | 0.54 | 0.06 | 22.87 | 2.58 |
| 林地 | 2.84 | 38.92 | 3.6 | 0.52 | 0.07 | 0.05 | 46.00 | 7.08 |
| 草地 | 2.79 | 1.92 | 10.53 | 0.80 | 0.14 | 0.53 | 16.71 | 6.17 |
| 湿地 | 2.25 | 1.14 | 2.64 | 4.33 | 0.04 | 0.10 | 10.51 | 6.18 |
| 建设用地 | 0.28 | 0.02 | 0.04 | 0.02 | 1.4 | 0.01 | 1.76 | 0.36 |
| 未利用地 | 0.10 | 0.06 | 0.63 | 0.10 | 0.02 | 1.23 | 2.15 | 0.91 |
| 期末 | 28.55 | 42.80 | 18.27 | 6.18 | 2.22 | 1.98 | 100.00 | 23.28 |
| 新增 | 8.26 | 3.87 | 7.74 | 1.85 | 0.82 | 0.75 | 23.28 |
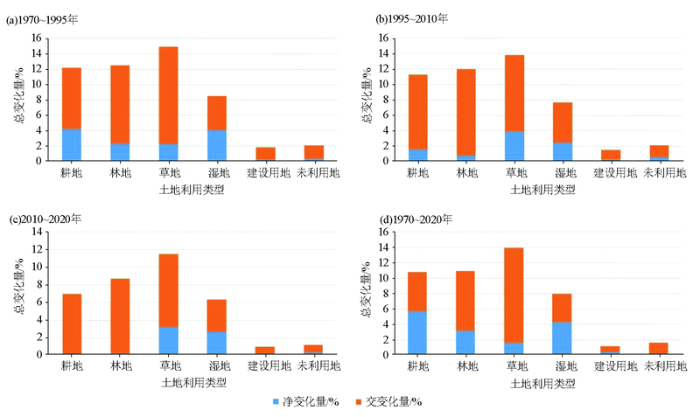
4.2.2 土地变化量
根据式(1)、式(2)计算1970~2020年黑土区各时段、各用地类型变化量,从各地类变化量图(图3)可知,50年间各地类均是交变化量占主导地位,各地类的变化中存在着大量空间位置上的转移,说明各地类所处的空间位置较为不稳定。在3个时段中,1970~1995年各用地类型总变化量最大,1995~2010年次之,2010~2020年最小,说明东北黑土区土地利用变化在1970~1995年最为剧烈,随时间推移逐渐降低。
图3
4.2.3 单项地类面积变化率
单项地类面积变化率显示各地类在某一时段内面积变化的剧烈程度。1970~2020年黑土区单项地类面积变化最为剧烈的依次是:湿地>建设用地>耕地>草地>未利用地>林地(图4),其中,湿地减少41.21%,建设用地增加25.68%,耕地增加24.83%,草地增加9.34%,未利用地减少7.75%,林地减少6.96%。1970~2020年黑土区耕地、林地、草地、湿地、建设用地及未利用地的年均变化速率,即单一土地利用类型动态度分别为0.5%、-0.14%、0.19%、-0.82%、0.51%及-0.15%。其中,耕地、草地、建设用地开发度为0.5%、0.19%、0.51%,林地、湿地未利用地耗减度为0.14%、0.82%、0.15%。
图4
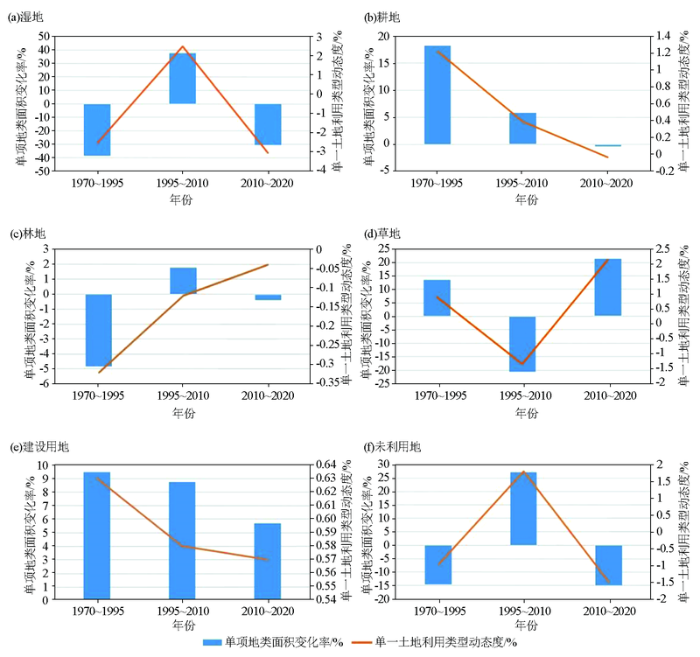
图4
1970~2020年黑土区单项地类面积变化率
Fig.4
The area change rate of each land type in the black soil area from 1970 to 2020
4.2.4 土地利用综合动态度
图5
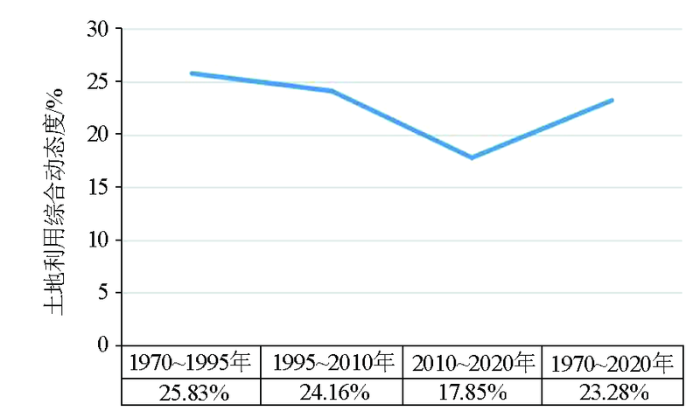
图5
土地利用综合动态度曲线
Fig.5
Curve diagram of comprehensive dynamic degree of land use
4.2.5 土地利用程度综合指数
表5 土地利用程度分级赋值
Table 5
| 土地利用类型 | 未利用土地 | 林地、草地、湿地 | 耕地 | 建设用地 |
|---|---|---|---|---|
| 分级指数 | 1 | 2 | 3 | 4 |
图6
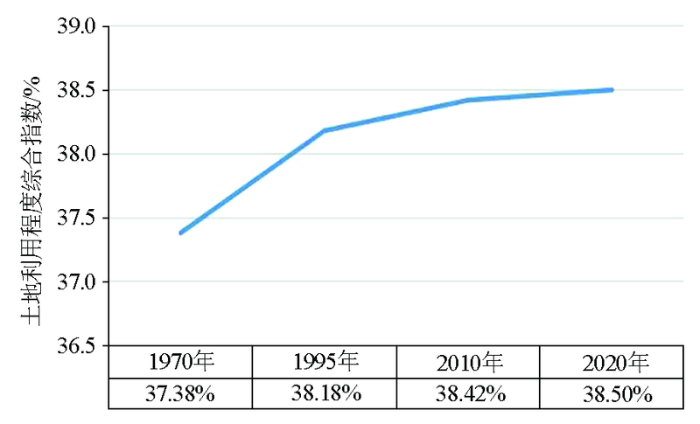
图6
不同年份土地利用程度综合指数
Fig.6
Comprehensive index of land use degree in different years
4.2.6 土地利用转移网络
对东北黑土区近50年间不同时段的土地利用变化数据进行处理,得到土地利用转移网络图(图7)。结果显示,1970~1995年间,东北黑土区转出最多的土地利用类型是林地,被砍伐的林地主要转化为草地和耕地,转出面积次之的相继为草地和湿地;东北黑土区转入面积最多的土地利用类型是草地,主要由林地和湿地转化而来;转入面积次之的为耕地,主要由林地、草地和湿地转化而来。1995~2010年间,东北黑土区转出最多的土地利用类型为草地,主要转化为林地、湿地和耕地;转出面积次之的为林地,主要转化为耕地和草地;东北黑土区转入面积最多的土地利用类型是耕地,主要由林地和草地转化而来。2010~2020年间,东北黑土区转出最多的土地利用类型为湿地;转入最多的土地利用类型为草地。
图7
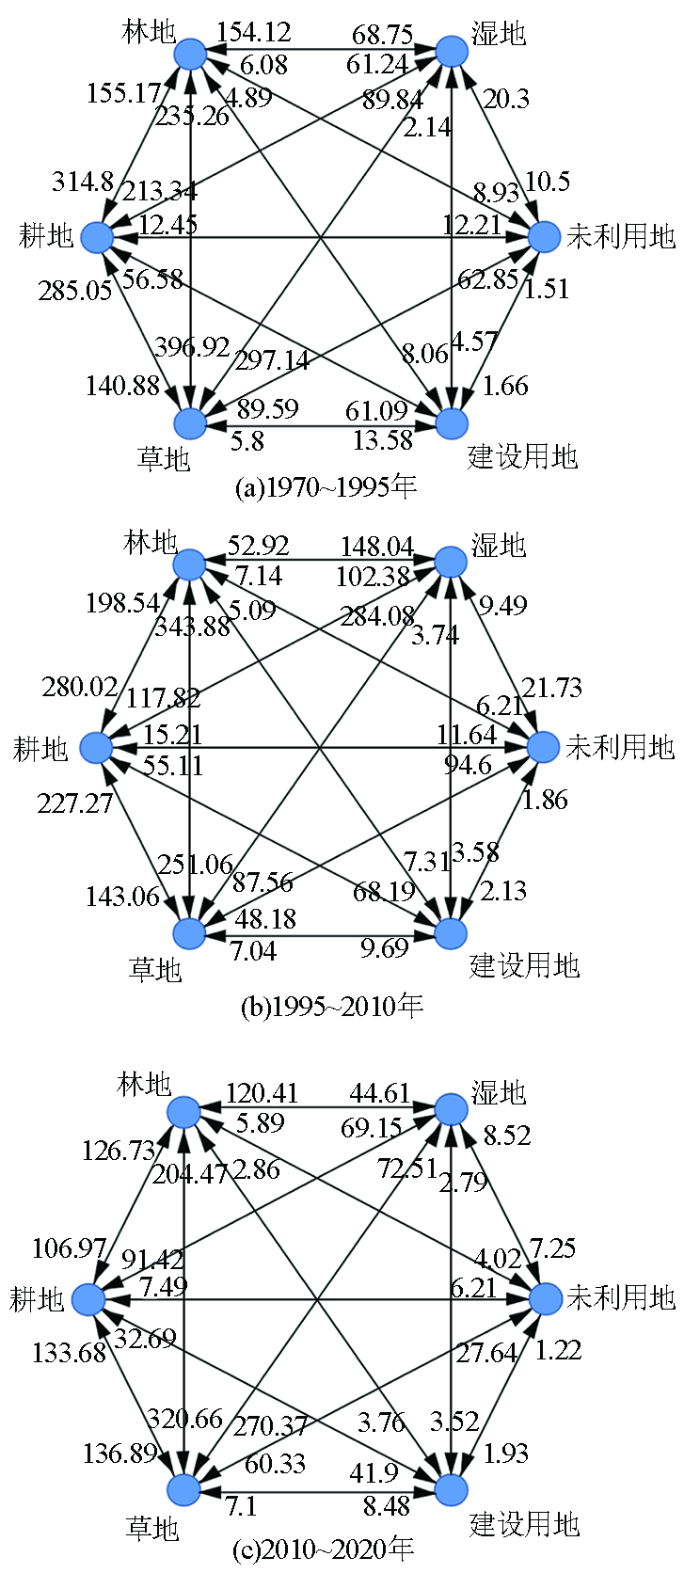
图7
东北黑土区近半世纪不同时段土地利用转移网络(1×10⁴hm2)
Fig.7
Land use transfer network for different time periods in the black soil area of Northeast China in the past half century
4.2.7 重心变化
根据土地利用的空间变化模型得出50年间东北黑土区各地类重心变化情况(图8),其中:
图8
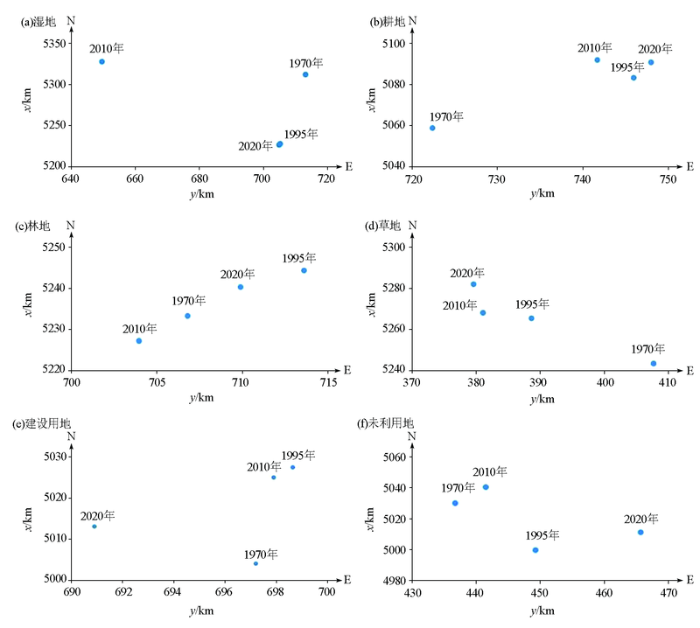
图8
不同地类50年间重心变化
Fig.8
The change of the gravity center for each land type in 50 years
1)未利用地重心。东北黑土区近50年来未利用地重心除1995年在吉林省通榆境内外,1970、2010及2020年均在吉林省洮南市境内。其中1995年与1970年相比,未利用地重心向东南方向偏移32.61 km,2010年与1995年相比,重心向西北移动41.54 km,2020年与2010年相比,重心向东南推移37.66 km。东北黑土区未利用地重心相对稳定,近半个世纪以来,整体向东南方向偏移了34.37 km。
2)湿地重心:东北黑土区近50年湿地重心均在黑龙江省境内,其中1970年湿地重心在克山县,2010年在讷河市域内,1995年与2020年重心坐标在明水县内重合。1995年与1970年相比,湿地重心向西南方向偏移85.96 km,2010年与1995年相比,重心向西北方向移动115.34 km,2020年移回原1995年重心。东北黑土区湿地较其他用地类型而言,重心移动更为剧烈,近半个世纪以来,整体向西南方向偏移了85.96 km。
3)林地重心:东北黑土区近50年来林地重心均在黑龙江省明水县境内,1995年与1970年相比,林地重心向东北方向偏移13.32 km,2010年与1995年相比,重心向西南方向移动19.80 km,2020年与2010年相比,重心向东北方向推移14.51 km。东北黑土区林地重心较为稳定,近半个世纪以来,整体向东北方向偏移了7.67 km。
4)建设用地重心:东北黑土区近50年来建设用地重心均在吉林省扶余县境内,1995年与1970年相比,建设用地重心向正北方向偏移23.71 km,2010年与1995年相比,重心向正南方向移动2.3 km,2020年与2010年相比,重心向西南方向推移13.72 km。东北黑土区建设用地重心较为稳定,近半个世纪以来,整体向西北方向偏移了11.25 km。
5)耕地重心变化:东北黑土区近50年来耕地重心均在黑龙江省肇东市境内,1995年与1970年相比,草地重心向东北方向偏移33.82 km,2010年与1995年相比,重心继续向西北方向偏移9.75 km,2020年与2010年相比,重心向东南方向推移6.59 km。东北黑土区耕地重心较为稳定,近半个世纪以来,整体向东北方向偏移了41.32 km。
6)草地重心变化:东北黑土区近50年来草地重心均在内蒙古扎兰屯市境内,1995年与1970年相比,草地重心向西北方向偏移28.76 km,2010年与1995年相比,重心继续向西北方向偏移7.61 km,2020年与2010年相比,重心向正北方向推移15.41 km。因此,东北黑土区草地重心较为稳定,近半个世纪以来,整体向西北方向偏移了48.25 km。
5 结论与讨论
土地作为一个自然—人文综合体,其利用方式主要受自然环境及人类活动的制约[35],具有很强的综合性和地域性。区域所处的自然地理地带性,如水文条件、温湿度、降雨量、地形地貌、光照条件、植被类型及土壤类型等,与社会经济发展水平、人口数量、经济产业结构布局与政策制度等人文因素,共同影响着区域土地利用结构及程度变化[36-37]。东北黑土区自然资源禀赋极佳,域内林地、草地、湿地等生态用地面积占比较大,是我国重要的生态功能区,19世纪前,该区域较为原始,人类活动干扰少,生态服务功能较强,进入20世纪后,受人口增长、气候变暖及现代农业迅猛发展的影响,东北黑土地逐渐被开荒利用,过去几百年间,东北黑土区历经土地开发、利用与保护的波动扩张过程[20]。中国加入WTO后东北地区在粮食生产方面的优势得到提升,在不断发展的商品化农业的刺激下,东北地区农民对扩大耕地规模增加收入的需求更加迫切,曾出现大规模的毁林开荒与未利用地开发活动,特别是在三江平原等水土资源丰富、生产潜力大的地区,黑土地开发进入快速扩张期,盲目的高强度机械开垦导致区域生态环境不断恶化[37]。近年来,我国政府高度注重生态保护与环境质量,东北黑土区土地利用进入开发与保护并重阶段[5]。本文主要研究东北黑土区土地利用波动最为显著的近半个世纪以来的土地利用结构及程度变化,主要结论如下:
1)东北黑土区建设用地、耕地及草地面积总体增加,增幅分别为25.96%、24.88%及9.75%,湿地、林地及未利用地面积总体降低,降幅分别为41.2%、6.94%及7.69%,其中三江平原北部、松嫩平原西北部及西辽河平原地区地类变化较为明显。
2)东北黑土区各地类变化中均是交变化量占主导优势,土地利用变化中存在着大量空间位置上的转移,土地利用变化在1970~1995年期间最为剧烈,后随时间推移趋于稳定,单项地类面积变化剧烈程度依次为湿地>建设用地>耕地>草地>未利用地及林地。
3)东北黑土区土地利用程度呈逐年小幅增长的趋势,但仍低于全国平均水平,土地开发利用的潜力很大。
4)东北黑土区各地类重心变化除湿地外,均较为稳定。
东北黑土区是我国重要的商品粮基地、生态功能区与老工业基地,随着社会经济的发展,城镇化水平持续提高,哈大齐工业走廊及长吉图开发开放先导区的建设,域内农用地、生态用地及建设用地在扩张时易发生冲突,粮食生产、生态保护、经济发展三者间冲突关系的消长使不同时段农用地、生态用地、建设用地相对重要性产生变化[35]。不同地类在空间上由冲突到协调的持续性重构过程为东北黑土地近半个世纪以来的土地利用程度及格局带来改变[38]。50年间东北黑土区土地利用变化控制因子以农业生产为主,区域功能定位、经济社会发展及城镇化发展等多种驱动力量并存,导致域内农业用地及建设用地呈持续增加态势,增加用地主要源于未利用地及生态用地[39]。然而,土地利用结构呈单一化发展趋势,不利于黑土资源的可持续利用,甚至会影响到农业可持续发展和粮食产能的稳定与提升[40],针对部分盲目追求农用地面积扩大和城镇化发展而占用生态用地的现象,应加大土地调控力度,寻求黑土地利用与保护的平衡。未来,应深入研究东北黑土区土地利用变化时空特征、机制及其对生境、生态服务功能、碳收支平衡的影响,实现“把黑土地用好养好”,保护黑土区生态安全和国土资源,优化土地开发结构,加强国土空间格局管控和生态保护,强化多种政策间的综合协调,以科学的政策设计引导区域土地资源开发向可持续方向转型,寻求东北黑土区资源、环境、经济社会的可持续发展,实现东北全面振兴[37]。
参考文献
我国东北黑土地保护与肥力提升的成效与建议
[J].
Effects and suggestions of black soil protection and soil fertility increase in Northeast China
[J].
东北黑土地区耕地质量现状与面临的机遇和挑战
[J].
Current situations of black soil quality and facing opportunities and challenges in Northeast China
[J].
黑土形成与演化研究现状
[J].
Formation and evolution of black soil
[J].
东北黑土地白皮书(2020)
[EB/OL].
White paper on black land in Northeast China (2020)
[EB/OL].
保护好利用好黑土地这个“耕地中的大熊猫”——习近平总书记在吉林考察时的重要讲话引发强烈反响
[EB/OL].
Protect and make good use of black land, the “giant panda in arable land” —General Secretary Xi Jinping's important speech during his inspection tour in Jilin aroused strong repercussions
[EB/OL].
土地利用动态变化研究方法探讨
[J].
study on the methods of land use dynamic change research
[J].
DOI:10.11820/dlkxjz.1999.01.012
[本文引用: 3]

From the respect of the meaning and the researching contents of land use and cover change, the methods for land use change were analyzed. Further, the methods of establishing land use dynamic change model were mainly introduced. These models include land resources quantity change model, land resources environmental quality change model, land use degree change model, land use change regional diversity model, land use spatial change model and land requirement forecasting model.
基于InVEST模型的东北地区土地利用变化对生境的影响研究
[J].
Effects of land use change on habitat based on InVEST model in Northeast China
[J].
50年来东北黑土区土地利用变化对沟蚀的影响——以克东地区为例
[J].
Effect of land use change on gully erosion in black soil region of Northeast China in the past 50 years: A case study in Kedong county
[J].
东北黑土区不同土地利用方式下农田土壤微生物多样性
[J].
Soil microbial diversity of black soil under different land use patterns in northeast China
[J].
土地利用方式对黑土剖面有机碳分布及碳储量的影响
[J].以典型黑土区29年长期定位试验处理下的土壤为对象,研究了农田、裸地、自然草地和落叶松林地4种土地利用方式下土壤剖面(0~200 cm)有机碳及碳储量的分布特征.结果表明: 不同土地利用方式下表层(0~10 cm)土壤有机碳含量差异最大,表现为草地>农田>林地>裸地.农田10~120 cm各土层有机碳含量均低于草地、林地和裸地.与农田相比,自然草地对土壤有机碳提升作用明显,其0~60 cm各层土壤有机碳含量均显著高于农田;裸地表层(0~10 cm)土壤有机碳含量显著低于农田;落叶松林地0~20 cm有机碳含量与农田相比无明显变化,但其20~140 cm土层有机碳含量均高于农田.土壤剖面有机碳含量与pH值、容重、粉粒和粘粒含量呈显著负相关,与全氮和砂粒含量呈显著正相关.农田0~200 cm剖面有机碳储量显著低于其他3种利用方式,分别比草地、裸地和林地低13.6%、11.4%和10.9%.农田黑土在增加碳储量及改善环境方面具有很大潜力.
Effects of land use patterns on the distribution of organic carbon and carbon storage in black soil profile
[J].
江苏省生态系统服务价值对土地利用/土地覆盖变化的动态响应
[J].
Dynamics of ecosystem services value in response to land use/Land cover changes in Jiangsu Province
[J].
基于模型的中国东北地区土地利用时空格局变化研究
[J].
Model-based analysis of spatio-temporal changes in land use in Northeast China
[J].
DOI:10.1007/s11442-016-1261-8
[本文引用: 2]
Spatially explicit modeling techniques recently emerged as an alternative to monitor land use changes. This study adopted the well-known CLUE-S (Conversion of Land Use and its Effects at Small regional extent) model to analyze the spatio-temporal land use changes in a hot-spot in Northeast China (NEC). In total, 13 driving factors were selected to statistically analyze the spatial relationships between biophysical and socioeconomic factors and individual land use types. These relationships were then used to simulate land use dynamic changes during 1980-2010 at a 1 km spatial resolution, and to capture the overall land use change patterns. The obtained results indicate that increases in cropland area in NEC were mainly distributed in the Sanjiang Plain and the Songnen Plain during 1980-2000, with a small reduction between 2000 and 2010. An opposite pattern was identified for changes in forest areas. Forest decreases were mainly distributed in the Khingan Mountains and the Changbai Mountains between 1980 and 2000, with a slight increase during 2000-2010. The urban areas have expanded to occupy surrounding croplands and grasslands, particularly after the year 2000. More attention is needed on the newly gained croplands, which have largely replaced wetlands in the Sanjiang Plain over the last decade. Land use change patterns identified here should be considered in future policy making so as to strengthen local eco-environmental security.
河北坝上土地利用变化对生态服务价值的影响
[J].
Impacts of land use change on ecosystem service value in Bashang area of Hebei Province,northern China
[J].
基于土地利用变化的东北地区碳排放效应研究
[J].
Assessment of carbon emissions based on land use chang in Northeast China
[J].
东北典型黑土区土地利用变化的生态服务价值研究——以巴彦县为例
[J].
Ecosystem service values based on land use change in black soil region of Northeast China:A case study of Bayan County
[J].
2010-2015年中国土地利用变化的时空格局与新特征
[J].
DOI:10.11821/dlxb201805001
[本文引用: 1]
土地利用/覆被变化是人类活动对地球表层及全球变化影响研究的重要内容。本文基于Landsat 8 OLI、GF-2等遥感图像和人机交互解译方法,获取的土地利用数据实现了中国2010-2015年土地利用变化遥感动态监测。应用土地利用动态度、年变化率等指标,从全国和分区角度揭示了2010-2015年中国土地利用变化的时空特征。结果表明:2010-2015年中国建设用地面积共增加24.6×10<sup>3</sup> km<sup>2</sup>,耕地面积共减少4.9×10<sup>3</sup> km<sup>2</sup>,林草用地面积共减少16.4×10<sup>3</sup> km<sup>2</sup>。2010-2015年与2000-2010年相比,中国土地利用变化的区域空间格局基本一致,但分区变化呈现新的特征。东部建设用地持续扩张和耕地面积减少,变化速率有所下降;中部建设用地扩张和耕地面积减少速度增加;西部建设用地扩张明显加速,耕地面积增速进一步加快,林草面积减少速率增加;东北地区建设用地扩展持续缓慢,耕地面积稳中有升,水旱田转换突出,林草面积略有下降。从“十二五”期间国家实施的主体功能区布局来看,东部地区的土地利用变化特征与优化和重点开发区的国土空间格局管控要求基本吻合;中部和西部地区则面临对重点生态功能区和农产品主产区相关土地利用类型实现有效保护的严峻挑战,必须进一步加大对国土空间开发格局的有效管控。
Spatio-temporal patterns and characteristics of land-use change in China during 2010-2015
[J].
DOI:10.11821/dlxb201805001
[本文引用: 1]
Land use/cover change is an important theme on the impacts of human activities on the earth systems and global environment change. National land-use changes of China during 2010-2015 were acquired by the digital interpretation method using high-resolution remotely sensed images, i.e. the Landsat8 OLI, and GF-2 remote sensing images. The spatio-temporal characteristics of land-use changes across China during 2010-2015 were revealed by the indexes of dynamic degree model, annual land-use changes ratio, etc. The results indicated that built-up land increased by 24.6×10³ km2, while cropland decreased by 4.9×10³ km2, and the total area of woodland and grassland decreased by 16.4×10³ km2. The spatial pattern of land-use changes in China during 2010-2015 was concordant with that of the period 2000-2010. Specially, new characteristics of land-use changes emerged in different regions of China in 2010-2015. The built-up land in eastern China expanded continually, and the total area of cropland decreased, both at decreasing rates. The rates of built-up land expansion and cropland shrinkage were accelerated in central China. The rates of built-up land expansion and cropland growth increased in western China, while the decreasing rate of woodland and grassland accelerated. In northeastern China, built-up land expansion slowed down continually, and cropland area increased slightly accompanied by the conversions between paddy land and dry land. Besides, woodland and grassland area decreased in northeastern China. The characteristics of land-use changes in eastern China were essentially consistent with the spatial governance and control requirements of the optimal development zones and key development zones according to the Major Function-oriented Zones Planning implemented during the 12th Five-Year Plan (2011-2015). It was a serious challenge for the central government of China to effectively protect the reasonable layout of land use types dominated with the key ecological function zones and agricultural production zones in central and western China. Furthermore, the local governments should take effective measures to strengthen the management of territorial development in future.
土地利用/覆盖变化对黑土生态环境的影响
[J].
Effects of land use and cover change on ecological environment in black soil region
[J].
DOI:10.13249/j.cnki.sgs.2005.02.203
[本文引用: 1]
Black soils, located mainly in Heilongjiang and Jilin provinces of China, cover a broad area from 43皌o 48癗 and from 124皌o 127癊, with a total area of 5.93?10<sup>6</sup> ha.The black soils were cultivated about 200 years in south, 50 years in north and 100 years in central parts of the black soil area.These soils are one of the most fertile soils in China.These soils were cultivated for a relatively short time as compared to the soils in southern China.The vegetation changed from natural vegetation to crop-weed, to rotation of corn-soybean-wheat, or to rotation of corn-soybean.Steppified herbosa were flourished in black soil area under the proper weather condition for plant growth where the precipitation of about 500mm to 600mm mainly from April to September is synchronized with heat.The water status has changed dramatically with the use of land.If we take the water storage in the depth of 1m in spring in natural soil under the Steppified herbosa vegetation as control, the water storage under crops decreased to 20.4%, 20.6%, 22.6%, 27.2%, 29.3%, 27.3% after 2, 8, 15, 30, 50, and 100 years cultivation, respectively.The decrease of water storage was around 17.6% to 30.8% in summer investigation and about 19.7% to 29.9% in autumn measurement.According to the data from the three times measurement, we make a simulated calculation.The result showed that, the storage of water in this area was as high as a 24.9?10<sup>9</sup>t reservoir in spring.The storage of water has decreased to 19.2?10<sup>9</sup> t after a hundred year cultivation.The impact of land use/cover on the soil water status is great.The capacity of land for storing water is decreased by 20% when cultivated for crops in contrast to natural soil.After the second year when the land was initially cultivated, the capacity decreased 6.9% every year with the cultivated time.So we concluded that the effect of soil use/cover is bigger than the time effect.The effect on black soil C pool of land use method and land cover is decisive, the C pool has a increase trend under original soil condition and steppified herbosa, it will decrease when black soil were reclaimed from its original state to farmland covered with crops.Compared with the capacity on soil C pool in 1 m soil layer under original soil condition and steppified herbosa, however, the organic C pool were decreased slowly by 23.71% on farmland after cultivation of 100 years.Plants need nitrogen as a macro-element.Method of land use and land cover affected the N pool in black soil in the same trend as for the C pool.Nevertheless the change in C pool in the layer from 50cm to 100cm is not significant in the period of 100 years;it is expected that much longer time is needed to have a significant change.It is land use/cover that makes tremendous influence on water and soil losses, but there is a litde relationship of water and soil losses with the cultivation time.Compared with the original soil and natural vegetation, the annual water loss of reclaimed farmland increased 27t/( ha·a);and there are as much as 50.93?10<sup>6</sup> t of water loss for the whole black soil area.Also the annual soil loss of reclaimed farmland increased about 38 t/ha;and there are 78.87?10<sup>6</sup> t soil loss for the whole black soil area.The over-cultivation not only resulted in the soil and water loss but also deteriorated the human living environment.
中国东北黑土地研究进展与展望
[J].
DOI:10.13249/j.cnki.sgs.2018.07.004
[本文引用: 2]
东北黑土区是世界四大片黑土区之一,它以高有机质和高肥力而著称,不仅是东北农业发展的基础,也是中国的粮仓,在保障国家粮食安全中具有举足轻重的地位。针对东北黑土自身的特色和面临的问题,首先描述了东北黑土地形成的条件及自然黑土的属性特征;其次阐述了黑土被开垦后农田化过程中土壤属性和肥力的演化情况,土壤有机质大幅度下降,土壤肥力降低,已严重影响到东北黑土地农业的可持续发展;在此基础上分析了黑土区耕作土壤不同保护途经及其对土壤肥力的影响机制;最后展望了未来黑土地理论研究的侧重点:应加大新技术、新方法和跨学科交叉理论的研究,培育更适合东北黑土地气候条件的高产优质作物品种,并结合目前黑土地保护的技术调控模式,优化作物种植模式,提升作物品质和产量,提高黑土区农业的综合生产力和竞争力、保证黑土区农业的永续利用。
Research progress of black soil in Northeast China
[J].
DOI:10.13249/j.cnki.sgs.2018.07.004
[本文引用: 2]
The black soil region in Northeast China is one of the world’s four black soil regions. It is well known for its high organic matter content and high fertility. It is not only the basis for the development of agriculture in Northeast China, but also the granary of China, which plays a decisive role in safeguarding the national food security. According to the characteristics and problems of black soil in Northeast China, this review first elucidates the forming conditions of the black soil and the natural characteristics. Secondly, we describe the evolution of soil properties and fertility in the process of the reclamation of black soil. The soil organic matter content and soil fertility decreased significantly, which have severely affected the sustainable development of agriculture in black soil region in Northeastern China. Besed on this analysis, different protection pathways and their controlling mechanisms on soil fertility are analyzed. Future research on black soil should be emphasized on the development of new technologies, new methods, and cross-disciplinary theories to ascertain the evolutional characteristics of soil fertility and their influencing factors. It is necessary to cultivate high-yield, high-quality crop varieties that are more suitable for the climatic conditions in Northeast China, to optimize the cropping system in combination with the current technological regulation pattern in this region, to improve the quality and yield of crops, to increase the overall productivity and competitiveness of agriculture soil, and finally to ensure the sustainable use of agriculture in the black soil region.
全球黑土区土壤有机质变化态势及其管理技术
[J].
Changes and management techniques of soil organic matter in global black soil regions
[J].
Delineating the black soil region and typical black soil region of northeastern China
[J].
东北黑土地保护规划纲要(2017-2030年)
[EB/OL].
Outline of the northeast black land protection plan (2017-2030)
[EB/OL].
东北黑土区水土流失与粮食安全
[J].
Soil erosion and food security in black soil region of Northeast China
[J].
东北黑土区土壤侵蚀现状与演变趋势
[J].
Status and evolution trend of soil erosion in black soil region of Northeast China
[J].
东北黑土区耕地系统变化机理
[J].
Mechanism of cultivated land system change in black soil areas of Northeast China
[J].
国务院关于印发全国主体功能区规划的通知(国发[2010]46号)
[EB/OL].
Circular of the State Council on Printing and Distributing the National Main Function Zone Planning([2010]46)
[EB/OL].
《拉姆萨尔公约》——《湿地公约》介绍
[J].
Introduction to the Ramsar Convention─Convention on Wetlands
[J].
基于RS与GIS的典型黑土区土地利用变化分析——以海伦市为例
[J].
Analysis of landuse dynamic in typical black soil region based on GIS and RS:A case study of Hailun County
[J].
关于区域土地利用变化指数模型方法的讨论
[J].
Discussion on the index method of regional land use change
[J].
1980-2015年长江流域土地利用变化分析
[J].
Land use changes in Yangtze River Basin from 1980 to 2015
[J].
土地利用变化信息挖掘方法及其应用
[J].
Method for information mining of land-use change and its applicaion
[J].
土地利用动态变化的研究方法及其在海南岛的应用
[J].
Research methods of land use changes and their applications in Hainan Island
[J].
近32年来南京城市扩展与土地利用演变研究
[J].
DOI:10.3724/SP.J.1047.2016.00200
[本文引用: 1]
基于1980-2012年6个时相的遥感影像分类成果,运用扩展强度的等扇分析和土地利用转移矩阵对南京市城市扩展区由城市扩展引起的土地利用布局、结构演化进行了长周期、多时段的研究。结果表明:32年间5个阶段城市扩展的方向极不均匀,城市经历了东北-东南-西南的扩展演化过程,2000年之后的扩展强度显著扩大;在总变化量的构成中,耕地净变化量和交换变化量所占的比重较为接近,在面积净减少的同时,空间位置的转移也较为突出;城市建设用地、城市绿地、采矿用地与裸地以净变化为主,水面、村镇建设用地以交换变化为主;2000年后,各时段耕地和城市建设用地年均总变化量远高于2000年之前,以2004-2008年的值最高,2008-2012年有所回落;32年间各单项类型动态度均较高,城市绿地、村镇建设用地和城市建设用地均达90%以上;综合动态度的结果揭示32年来南京城市的扩展历经了加速演变-变化趋缓-剧烈演变-整合重构4个主要阶段。
Research on urban expansion and land use change in Nanjing over the past 32 years
[J].
我国东北地区土地资源变化态势分析
[J].
Analysis of changing situation of land resources in Northeast China
[J].
中国土地利用程度的区域分异模型研究
[J].
study on the model of regional differentiation of land use degree in Chian
[J].
东北地区土地利用转型特征测度与机制探索
[J].
Land use transition in Northeast China:Features measurement and mechanism exploration
[J].DOI:10.2307/142199 URL [本文引用: 3]
政策主导下的区域土地利用转型过程与机制——以中国东北地区为例
[J].
DOI:10.11821/dlyj020190257
[本文引用: 1]
从构建政策主导下区域土地利用转型解释框架入手,以东北地区为例,探究政策主导下区域土地利用转型机制。结果表明:① 1995—2015年,东北地区经济社会发展可划分为“经济低速增长,城镇化与人口发展停滞期”与“经济波动,城镇化稳定发展,人口转型期”两大阶段。② 伴随经济社会转型,东北地区发生土地利用转型。转型特征主要表现为:在数量上,区域耕地规模持续扩张,但增速放缓,耕地内部水田占比上升;林地与草地规模持续缩减,但下降速度放缓;区域建设用地加速增长,增长主体由农村建设用地转变为城镇建设用地。在空间上,耕地分布重心持续向东北方向移动,林地与未利用地分布重心向西南方向移动,建设用地与草地分布重心呈现显著的转折特征。③ 东北地区土地利用转型是区域内不同土地利用类型在空间上由冲突到协调的持续性重构过程。区域功能定位以及经济现代化与城镇化是导致土地利用转型的核心因素。政策主导下的区域土地利用转型是政策引导下的社会-生态反馈路径与政策影响下的社会-经济变化诱发路径综合作用的结果,两者间存在耦合与拮抗过程。前者决定区域土地利用转型的方向,后者决定区域土地利用转型的速度与强度。
The process and mechanism of regional land use transition guided by policy:A case study of Northeast China
[J].
东北黑土地保护利用研究足迹与科技研发展望
[J].
Research perspectives and footprint of utilization and protection of black soil in Northeast China
[J].
