

0 引言
土壤是具有地理空间和属性空间连续性[1]的不均匀自然体。土壤形成、发育与演化过程中各成土因素在不同尺度上的交互作用,以及受到的各种随机因素(耕作、灌溉、施肥)的影响,使土壤特性空间分布呈现出不同程度的异质性[2⇓-4]和相关性[5],具有一定的渐变性和模糊性,蕴含着多层次的变化[6]。国内外多位学者已针对土壤特性的空间变异开展了相关研究,研究内容多为土壤养分[1,7-8]、重金属污染[6,9-10]、有机质[11-12]等特性的空间变异影响因素分析,研究尺度涉及田块、乡镇、县域等中、小尺度[9,13-14],研究方法主要有空间变异理论[5]、分形维数[2,15]、地统计学[16]等,剖析了土壤特性的空间变异结构组成,定量化表示了结构变异和随机变异占比。总之,土壤特性空间变异(随机变异和结构变异)具有多尺度变异特征[7-8],尤其是成窄斜带状分布于内蒙古、陕西、甘肃一带的我国半干旱气候区,其气候、植被等成土影响因素在纬向、经向的梯度差异明显,土壤特性具有明显的地带性[17],但针对该区域土壤特性空间变异的研究较为缺乏,结构性和随机性变异多为单尺度的描述或为少数尺度的对比研究,其在尺度间的变化规律以及主导影响因素转换关系尚不清楚。
1 研究方法
1.1 空间自相关
莫兰指数是检验某一要素属性值在空间上是否相关联的最常用统计量,主要用于描述区域性变量的整体分布状况,以揭示空间区域性变量的结构形态,其计算公式为[20]:
式中:
莫兰指数的值域为[-1,1],莫兰指数值大于0,表明空间正相关,其值越大,空间相关性越明显;莫兰指数值小于0,表明空间负相关,其值越小,空间差异性越大;莫兰指数值为0,表明空间随机性。
1.2 空间变异
1.2.1 半方差函数
半方差函数也称空间变异函数,定义为取样间隔为
式中:
半方差函数值随取样间隔
1.2.2 分形维数
式中:
由式(4)、(5)可知,
2 实例研究
2.1 研究区域
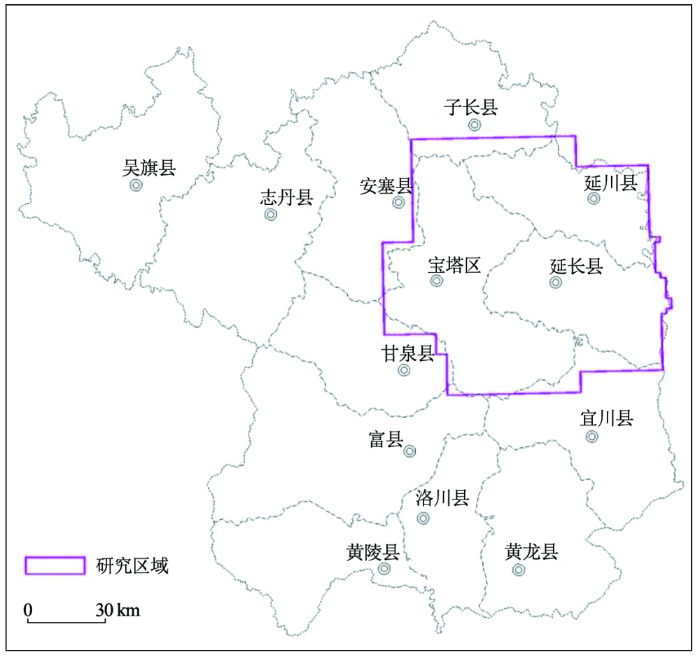
研究区域位于陕西省延安市宝塔区、延川县、延长县及周边区域(图1),处于东经109°15'21.60″~110°30'25.20″,北纬36°11'49.20″~37°05'52.80″之间,属半湿润半干旱大陆性季风气候,年均降水量为469.58~531.83 mm,年均湿度为58.74%~64.29%,年均日照时间为2 300~2 700 h,年均气温为9.23~10.80 ℃。该区为黄土高原丘陵沟壑区,地势西北高,东南低,海拔499~2 000 m。土壤类型主要为黄绵土、新积土、红黏土、粗骨土等,土壤质地以轻壤土和砂壤土为主。
图1
2.2 数据来源与处理
2.2.1 数据来源
利用延安市宝塔区、延川县、延长县等地2018年土地质量地球化学调查成果,获得了8 462个采样点的有机质和全氮分析数据、GPS横纵坐标和海拔数据。采样密度为1个点/km2,单样按梅花法取3~5个点,并遵从代表性、均匀性、合理性和多点混合的原则,取0~20 cm土层的土样,每个样品质量1 000 g左右。同时,采样时注重避开粪堆、新近堆积土等点状污染物,并去掉植物根系和岩石碎块,自然风干后,过20目尼龙筛,由自然资源部安徽地质测试实验室进行测试,其中,有机质采用硫酸亚铁铵容量法(VOL)分析,全氮采用凯氏丹蒸馏酸碱滴定(VOL)分析,分析质量均符合《地质矿产实验室测试质量管理规范》(DZ0130.1~130.13-94)要求。
降雨量、气温、湿度等气象数据来源于中国气象数据服务中心2018年连续数年和连续数天的数据集,插值得到研究区分辨率为30 m×30 m的气象要素网格数据层。植被指数数据来源于lpdaac(land process distributed active archive center)提供的16天mod13q1数据产品,分辨率为250 m×250 m。土壤类型数据来源于《1∶100万中国土壤数据库》。
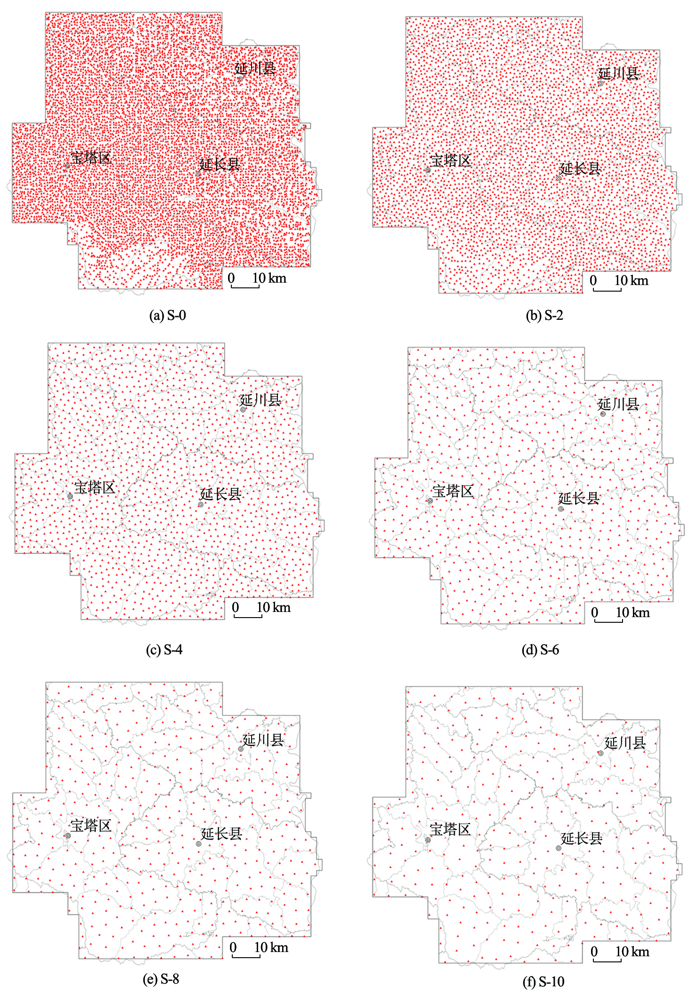
2.2.2 重抽样及数据处理
表1 重采样后不同间距尺度对应关系
Table 1
| 尺度 | S-0 | S-1 | S-2 | S-3 | S-4 | S-5 | S-6 | S-7 | S-8 | S-9 | S-10 |
|---|---|---|---|---|---|---|---|---|---|---|---|
| 指定距离/m | 500 | 1000 | 1500 | 2000 | 2500 | 3000 | 3500 | 4000 | 4500 | 5000 | |
| 样点数 | 8462 | 8037 | 4062 | 2301 | 1463 | 936 | 666 | 486 | 380 | 302 | 249 |
图2
同时,依据采样点的重采样距离,分别对降雨量、气温、湿度以及植被指数等栅格数据进行重采样,以确保数据尺度统一。
3 结果与讨论
3.1 空间分析结果
3.1.1 统计分析结果
图3
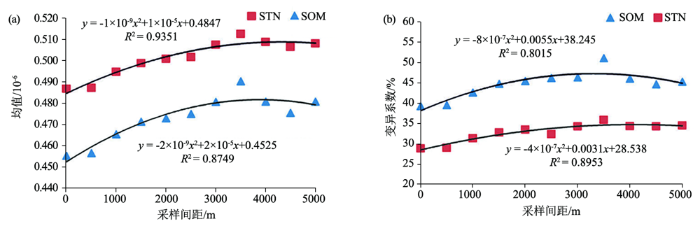
图3
不同采样尺度均值(a)、变异系数(b)与尺度的散点分布
Fig.3
Scatter diagram of variation mean value(a) and codfficients(b) at different scales
无论均值还是变异系数,尺度S-0、S-1处为低值,尺度S-6、S-7、S-8处为高值,经独立样本Kruskal-Wallis非参数检验(所有成对比较)发现,两项参数均具有显著差异(P<0.05),但其他尺度间差异不显著。
3.1.2 空间自相关结果
将各尺度有机质、全氮的含量进行全局莫兰指数计算,经标准化,
图4
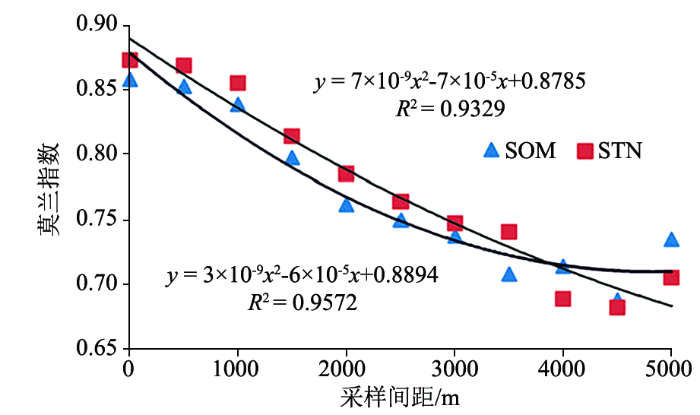
图4
不同采样尺度Moran’s I指数与尺度的散点分布
Fig.4
Scatter diagramof Moran’s I at different scales
3.1.3 空间变异结果
各尺度的有机质和全氮含量半方差函数在各方向上均具有内蕴平稳性,如:以采样距离为0和5 000 m为例,计算有机质和全氮的含量在0°、45°、90°和135°四个方向上的半方差函数值(表2),C0、C0+C和C0/(C0+C)在各方向上的差距均较小,半方差结构在各方向上基本相同,各向同性,并类推至其他尺度,得出相同结果。
表2 有机质和全氮半方差结构异质性分析
Table 2
| 指标 | 采样距离/m | 方向/(°) | 拟合模型 | C0 | C0+C | [C0/(C0+C)]/% |
|---|---|---|---|---|---|---|
| 有机质 | 0 | 0 | G | 0.0368 | 0.1286 | 0.2862 |
| 45 | G | 0.0366 | 0.1287 | 0.2845 | ||
| 90 | G | 0.0368 | 0.1287 | 0.2859 | ||
| 135 | G | 0.0365 | 0.1286 | 0.2839 | ||
| 5000 | 0 | G | 0.0254 | 0.1178 | 0.2156 | |
| 45 | G | 0.0253 | 0.1177 | 0.2149 | ||
| 90 | G | 0.0255 | 0.1178 | 0.2164 | ||
| 135 | G | 0.0256 | 0.1183 | 0.2164 | ||
| 全氮 | 0 | 0 | G | 0.0197 | 0.0698 | 0.2822 |
| 45 | G | 0.0196 | 0.0696 | 0.2816 | ||
| 90 | G | 0.0198 | 0.0698 | 0.2837 | ||
| 135 | G | 0.0199 | 0.0699 | 0.2847 | ||
| 5000 | 0 | G | 0.0125 | 0.0768 | 0.1628 | |
| 45 | G | 0.0126 | 0.0769 | 0.1640 | ||
| 90 | G | 0.0126 | 0.0769 | 0.1642 | ||
| 135 | G | 0.0126 | 0.0769 | 0.1633 |
各尺度的最佳理论模型均为高斯模型,决定系数最大,残差最小(表3),拟合精度高(P<0.05),有确定的块金值、基台值和变程,客观地反映了有机质和全氮的空间变异结构特征。
表3 不同尺度有机质和全氮的半方差函数及分形维数
Table 3
| 项目 | 采样 距离/m | 拟合 模型 | C0 | C0+C | [C0/(C0+ C)]/% | 变程/m | 决定 系数R2 | 残差 RSS | 分形 维数FD |
|---|---|---|---|---|---|---|---|---|---|
| 有机质 | 0 | G | 0.0337 | 0.1114 | 30.25 | 45400 | 0.975 | 1.52×10⁻⁴ | 1.759 |
| 500 | G | 0.0338 | 0.1116 | 30.29 | 45000 | 0.977 | 1.18×10⁻³ | 1.758 | |
| 1000 | G | 0.0321 | 0.1242 | 25.85 | 46900 | 0.981 | 1.49×10⁻⁴ | 1.730 | |
| 1500 | G | 0.0301 | 0.1362 | 22.10 | 49400 | 0.985 | 1.49×10⁻⁴ | 1.705 | |
| 2000 | G | 0.0277 | 0.1314 | 21.08 | 47500 | 0.986 | 1.42×10⁻⁴ | 1.690 | |
| 2500 | G | 0.0271 | 0.1342 | 20.19 | 47700 | 0.987 | 1.32×10⁻⁴ | 1.676 | |
| 3000 | G | 0.025 | 0.1250 | 20.00 | 47200 | 0.985 | 1.38×10⁻⁴ | 1.673 | |
| 3500 | G | 0.026 | 0.1410 | 18.44 | 50300 | 0.991 | 9.64×10⁻⁵ | 1.669 | |
| 4000 | G | 0.0218 | 0.1106 | 19.71 | 44400 | 0.988 | 9.80×10⁻⁵ | 1.649 | |
| 4500 | G | 0.0236 | 0.1112 | 21.22 | 46000 | 0.992 | 6.39×10⁻⁵ | 1.677 | |
| 5000 | G | 0.0254 | 0.1178 | 21.56 | 49900 | 0.989 | 8.25×10⁻⁵ | 1.660 | |
| 全氮 | 0 | G | 0.0197 | 0.0698 | 28.22 | 46100 | 0.98 | 4.64×10⁻⁵ | 1.747 |
| 500 | G | 0.0196 | 0.0701 | 27.96 | 45800 | 0.982 | 4.44×10⁻⁵ | 1.744 | |
| 1000 | G | 0.019 | 0.0767 | 24.77 | 46200 | 0.985 | 4.66×10⁻⁵ | 1.721 | |
| 1500 | G | 0.0175 | 0.0825 | 21.21 | 48400 | 0.994 | 9.30×10⁻⁵ | 1.694 | |
| 2000 | G | 0.0164 | 0.0800 | 20.50 | 45900 | 0.986 | 8.36×10⁻⁵ | 1.683 | |
| 2500 | G | 0.0157 | 0.0832 | 18.87 | 47000 | 0.990 | 4.34×10⁻⁵ | 1.660 | |
| 3000 | G | 0.0141 | 0.0775 | 18.19 | 47100 | 0.989 | 4.10×10⁻⁵ | 1.653 | |
| 3500 | G | 0.0146 | 0.0877 | 16.65 | 48900 | 0.991 | 1.46×10⁻⁵ | 1.637 | |
| 4000 | G | 0.0121 | 0.0726 | 16.67 | 44700 | 0.992 | 2.79×10⁻⁵ | 1.620 | |
| 4500 | G | 0.0137 | 0.0738 | 18.56 | 47100 | 0.992 | 2.56×10⁻⁵ | 1.650 | |
| 5000 | G | 0.0125 | 0.0768 | 16.28 | 50900 | 0.990 | 3.38×10⁻⁵ | 1.623 |
注:在进行半方差函数拟合及分形维数计算时,不同尺度有机质最大步长距离50 300 m,间隔距离6 000 m;不同尺度全氮的最大步长距离50 900 m,间隔距离6 000 m;拟合模型G为高斯模型。
图5
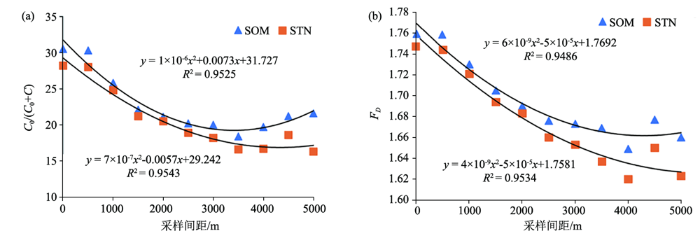
图5
不同采样尺度下有机质和全氮的块基比(a)、分形维数(b)散点分布
Fig.5
Scatter diagram of Nugget-Sill ratio(a) and fractal dimension(b) of SOM and STN at different scales
3.2 讨论
3.2.1 有机质和全氮含量的空间分布规律
图6
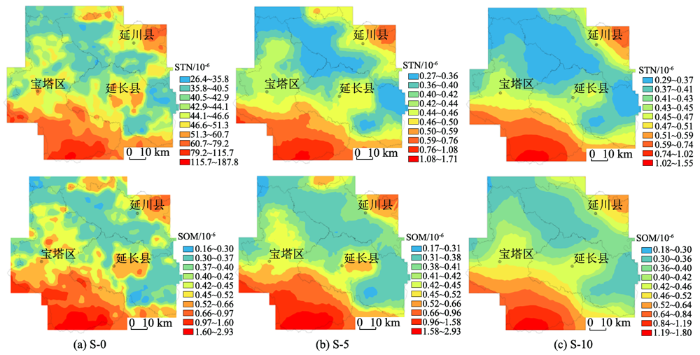
图6
有机质和全氮的含量在S-0、S-5、S-10尺度的空间分布
Fig.6
Spatial distribution of SOM and STN contentsat S-0、S-5、S-10 scales
3.2.2 影响因素的区分度
气候、植被、高程、土壤类型是影响有机质和全氮含量的因素[24]。采用基于熵理论的区分度模型[25-26]来计算各影响因素对有机质和全氮含量的区分度(图7),发现不同的影响因素具有不同的区分度,其中高程的区分度最小,土壤类型、植被指数、年均气温、湿度等影响因素次之,降水量的区分度最大。在半干旱区,有机质和全氮含量的生长过程(植物生长)和破坏过程(微生物分解)速率对降水量的响应是积极的[12],对其空间变异具有重要的作用[12],而其他因素的作用则与自身差异程度具有正相关。经分析,研究区的温度(10 ℃)和湿度(60.91%)普遍偏低,降水量空间分布(469.58~531.83 mm)不均匀,在降水量充沛区域,植物生长高于分解,有机质和全氮含量积累;反之,含量消耗。而其他因素,由于其自身差异程度小(如采样点多分布于耕地较为集中的坝地和塬面,高程差异较小;植被多为农作物、经济作物,植被指数差异小;土壤类型多为黄土或次生黄土,成土母质均为风成砂),对有机质和全氮的尺度间分异贡献微乎其微。
图7
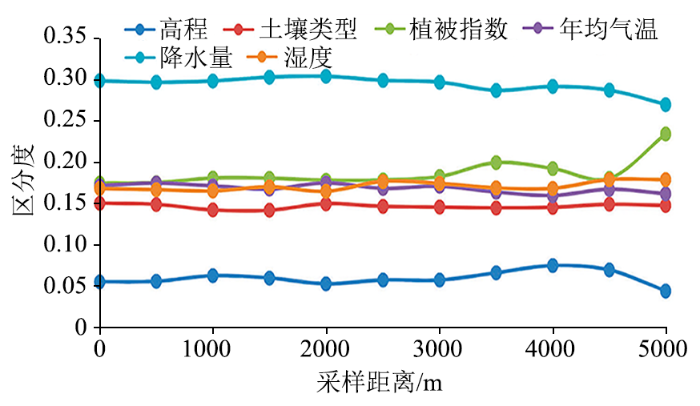
图7
各影响因素对有机质和全氮含量的区分度
Fig.7
Differentiation of SOM and STN content by influencing factors
3.2.3 有机质和全氮含量空间变异的尺度效应
各种影响因素引起有机质和全氮含量出现全部显著差异的尺度不同,如降水量、湿度在尺度S-4能引起全部显著差异(表4),海拔则在尺度S-2,而土壤类型、植被指数、年均气温则需更小尺度才可以引起差异。在同一尺度下,各影响因素引起的空间变异也是不同的,如在尺度S-7,降水量、湿度引起的有机质和全氮含量差异显著比(差异显著对数/所有成对数)最大,年均气温、植被指数次之,海拔最小,而土壤类型则差异不显著。且随着尺度增大,有机质和全氮含量的差异显著比均由显著逐渐衰减,但不同的影响因素衰减速率不同,如降水量因素从尺度S-0到S-10,有机质含量差异显著比逐渐降低,由6/6降到4/6,衰减速率较慢,而海拔的差异显著比则由6/6降到1/6,衰减速率较快。
表4 不同尺度间的SOM、STN在不同影响因素下的显著性差异统计
Table 4
| 影响因素 | 指标 | S-0 | S-1 | S-2 | S-3 | S-4 | S-5 | S-6 | S-7 | S-8 | S-9 | S-10 |
|---|---|---|---|---|---|---|---|---|---|---|---|---|
| 土壤类型 | 有机质 | 13/21 | 12/21 | 10/21 | 9/21 | 5/21 | 3/21 | 1/21 | 0/21 | 0/21 | 0/21 | 0/21 |
| 全氮 | 8/21 | 8/21 | 7/21 | 6/21 | 5/21 | 2/21* | 2/21 | 0/21* | 0/21 | 0/21 | 0/21 | |
| 植被指数 | 有机质 | 6/6** | 6/6** | 6/6*** | 5/6*** | 5/6*** | 4/6*** | 4/6*** | 4/6*** | 3/6*** | 3/6*** | 3/6*** |
| 全氮 | 5/6** | 5/6** | 5/6** | 5/6** | 5/6*** | 5/6*** | 5/6*** | 5/6*** | 3/6*** | 4/6*** | 3/6*** | |
| 年均气温 | 有机质 | 5/6 | 5/6 | 5/6 | 4/6 | 4/6 | 3/6 | 2/6 | 3/6 | 1/6 | 1/6 | 1/6 |
| 全氮 | 3/6 | 3/6 | 3/6 | 2/6 | 3/6 | 2/6 | 0/6 | 0/6 | 0/6 | 0/6 | 0/6 | |
| 降水量 | 有机质 | 6/6** | 6/6** | 6/6** | 6/6** | 5/6** | 5/6** | 5/6*** | 5/6** | 4/6*** | 4/6*** | 4/6*** |
| 全氮 | 6/6** | 6/6** | 6/6** | 6/6** | 6/6** | 5/6** | 5/6** | 4/6*** | 4/6** | 4/6** | 3/6*** | |
| 湿度 | 有机质 | 6/6** | 6/6** | 6/6** | 6/6** | 6/6** | 6/6** | 5/6** | 5/6** | 5/6** | 4/6** | 4/6** |
| 全氮 | 6/6** | 6/6** | 6/6** | 6/6** | 6/6** | 5/6** | 5/6** | 4/6** | 5/6** | 4/6** | 4/6** | |
| 海拔 | 有机质 | 6/6 | 6/6 | 6/6 | 4/6 | 4/6 | 3/6 | 3/6 | 2/6 | 2/6 | 2/6 | 1/6 |
| 全氮 | 5/6 | 5/6 | 3/6 | 3/6 | 2/6 | 2/6 | 1/6 | 1/6 | 0/6 | 1/6 | 0/6 |
注:用上四分位、中位、下四分位3个节点将影响因素划分为4个水平;用独立样本Kruskal-Wallis非参数检验对各因素、不同水平下SOM、STN的数据集进行检验,其显著差异的对数为分子,所有成对数为分母;“***”表示强相关性,“**”表示中等相关性,其余表示无相关性。
4 结论
变异系数、莫兰指数,半方差函数值和分形维数
小尺度因素引起随机性变异,大尺度因素引起结构性变异,但不同结构影响因素对有机质和全氮含量的空间变异具有不同的区分度,高程的区分度最小,土壤类型、植被指数、年均气温、湿度等影响因素的区分度次之,降水量的区分度最大。各影响因素对有机质和全氮空间变异的影响具有尺度特征,随着尺度增大,小尺度因素引起的随机变异逐渐减少,而大尺度因素引起的结构性变异先增大后减弱,直至转换为相对的小尺度因素。
不同尺度上,影响因素对有机质和全氮的含量具有不同的相互协同机制,引起尺度间的随机变异和结构变异消长,造成各尺度空间总变异具有不同的结构组成,呈现出先减少后趋于稳定的变化趋势。
参考文献
县域农田土壤养分空间变异及合理样点数确定
[J].
County-scale spatial variability of soil nutrient distribution and determination of reasonable sampling density
[J].
分形理论及其在土壤空间变异研究中的应用
[J].
Fractal theory and its application in the analysis of soil spatial variability:A review
[J].
Modelling soil variation:Past, present and future
[J].DOI:10.1016/S0016-7061(01)00025-8 URL [本文引用: 2]
空间变异理论在土壤特性分析中的应用研究进展
[J].
Research progress of the spatial variability theory in application to soil characteristic analysis
[J].
北京耕作土壤重金属多尺度空间结构
[J].
Multi-S spatial structure of heavy metals in Beijing cultivated soils
[J].
采样尺度对土壤养分空间变异分析的影响
[J].
Effects of sampling S on soil nutrition spatial variability analysis
[J].
不同尺度下土壤养分空间变异特征的研究
[J].
Characters of soil nutrient spatial variability in different S
[J].
农田土壤重金属空间变异多尺度分析——以北京顺义土壤Cd为例
[J].
Multi-S analysis of spatial variability of heavy metals in farmland soils: Case study of soil Cd in Shunyi District of Beijing,China
[J].
北京市土壤中Cr、Ni含量的空间结构与分布特征
[J].
Spatialdistribution patterns of Cr and Ni in soils of beijing
[J].
耕地土壤有机质与全氮空间变异性对粒度的响应研究
[J].
Spatial variablility response of farmland soil organic matter and total nitrogen to sampling grain size
[J].
基于局部惩罚型变权的建设用地生态适宜性空间模糊评价——以陕西延安宝塔区为例
[J].
Spatial fuzzy assessment of ecological suitability for urban land based on local penalty variable weights:A case study of Baota district
[J].
土壤速效养分空间变异的尺度效应
[J].
S-dependency of spatial variability of soil available nutrients
[J].
Spatial variability patterns of phosphorus and potassium in no-tilled soils for two sampling scales
[J].DOI:10.2136/sssaj1996.03615995006000050027x URL [本文引用: 1]
农田土壤特性的空间变异性及分形特征
[J].
Spatial variablelity and fractal dimension of soil property in field
[J].
土壤空间变异研究中地统计学的应用及其展望
[J].
Application and prospect of geostatistics in soil spatial variability research
[J].
不同取样间距农田土壤全量养分空间变异特征研究
[J].
Spatial variability of total nutrients in arable soil as affected by different sampling distances
[J].
黄土高原土壤元素含量地域分异规律
[J].
A Study on laws of regional variance of soil element in loess plateau through trend surface analysis method
[J].
治沟造地新增耕地的土壤质量评价——延安宝塔区为例
[J].
The evaluation of soil nutrient status in newly reclaimed land from trench construction:Taking Baota district of Yan'an city as example
[J].
小麦多年产量空间变异与空间关联分析
[J].
Spatial autocorrelation analysis of wheat yield over five years
[J].
Multiscale sources of spatial variation in soil. I. The application of fractal concepts to nested levelsof soil variation
[J].
The interpolation accuracy for seven soil properties at various sampling Ss on the Loess Plateau, China
[J].DOI:10.1007/s11368-011-0438-0 URL [本文引用: 1]
The Nature and Properties of Soils, 15th Edition
[J].DOI:10.2136/sssaj2016.0005br URL [本文引用: 1]
基于熵权的土壤养分地球化学多级模糊综合评判——以陕西省关中地区为例
[J].
Multi-stage fuzzy comprehensive evaluation of soil nutrient geochemistry based on entropy weight:Take Guanzhong region for example
[J].
