

0 引言
目前,国内外学者已针对可控源音频大地电磁法开展过一系列研究,并开发出了一维、二维和三维的正反演程序,其中既有各向同性的,也有各向异性的,但是基本都是以高级语言直接编程实现的,具有可视化界面的不多。考虑到修改模型时,在程序中来回改变参数的方式不仅繁琐还容易出错,本文针对MATLAB编写的模拟程序,通过将其打包成Jar包,封装在Java语言编写的应用程序中,实现了在图形界面中直接进行输入输出、数值计算以及基本绘图等功能[3]。这里以CSAMT一维正演程序为例,阐述了程序功能的实现思路及使用Java语言进行界面封装以实现程序可视化的方案,最后详细讨论了激发极化效应对一维模型的影响。
1 方法原理
1.1 水平层状介质电偶极子源
图1
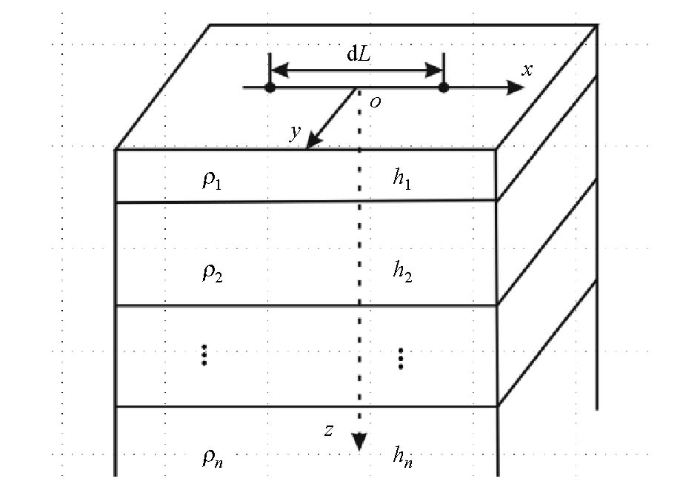
图1
水平层状介质上的电偶极子地电模型示意
Fig.1
Schematic diagram of electric dipole horizontal layered medium model
使用卡尼亚视电阻率计算公式可求得不同频率范围的视电阻率值[4]:
式中:R和R*是联系各层电性参数的函数;IdL为偶极矩;φ为偶极矩方向与偶极中心到测点连线之间的夹角;r为收发距;ω为角频率;μ为空气中的磁导率,μ=4π×10-7 H/m;m的物理意义是空间频率,具有距离倒数的量纲,mi=
1.2 Cole-Cole模型的引入
式中:ρ0为零频电阻率,m为极限极化率,τ为时间常数,c表征复电阻率随频率变化程度的相关系数。
2 GUI设计
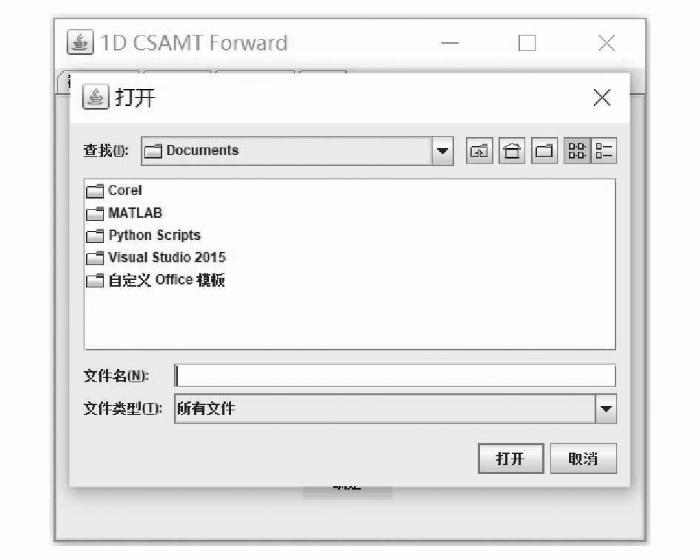
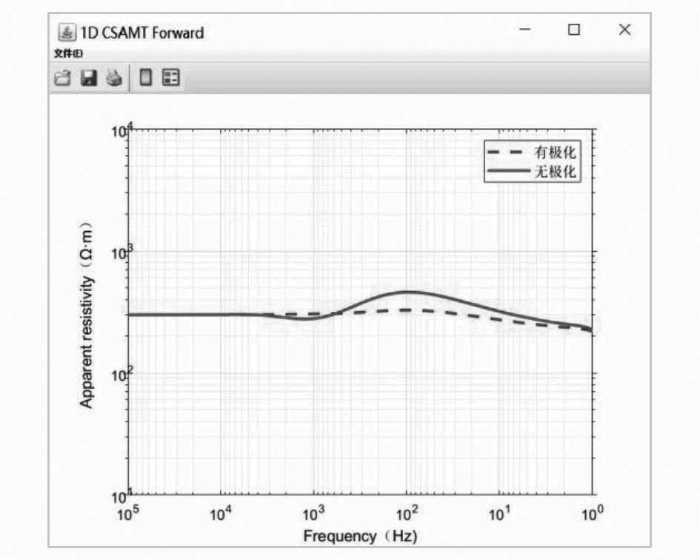
将CSAMT一维层状模型进行正演所需的数据,通过图形用户界面(graphics user interface,GUI)进行文件导入或手动输入(图2),这样在修改模型时就不需要在MATLAB代码中来回多次改变参数,既方便了数据的输入,又降低了出错的概率。
图2
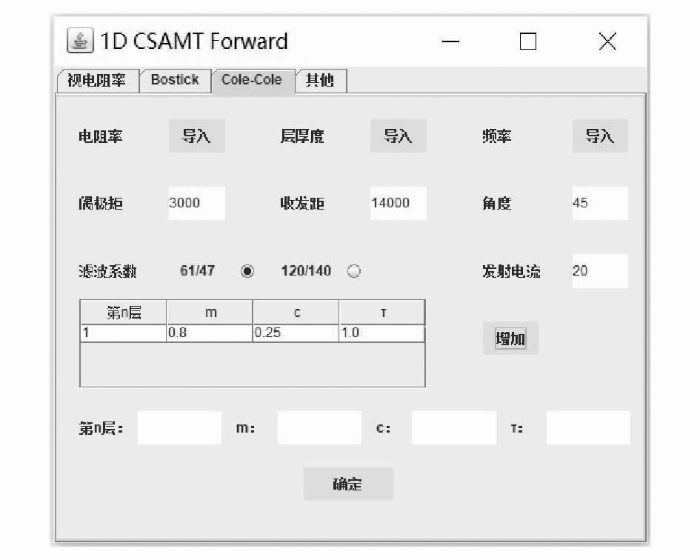
图3
当鼠标点击“确定”按钮时,程序先检查输入的参数是否完整,如果不完整,就会提示出错,要求修改输入的参数文件,如图4所示。
图4
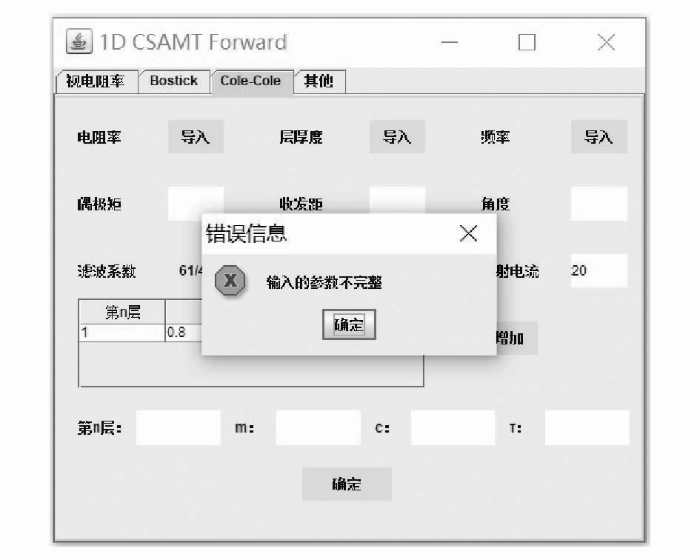
图5
3 正演试算
3.1 模型一:K型断面
含激电效应的三层地层K型断面,收发距为14 km,频率范围f=100~105 Hz,各地层电阻率与层厚度取值如表1所示。
表1 K型地电模型参数设置
Table 1
| K型结构 | 电阻率/(Ω·m) | 层厚度/m |
|---|---|---|
| 第一层 | 300 | 300 |
| 第二层 | 1000 | 600 |
| 第三层 | 200 | ∞ |
3.1.1 极化层位于浅层
由图6可以看出,当极化层位于浅层时,视电阻率曲线在有无极化层时具有显著的不同。存在浅层极化层时,视电阻率值在全频段均小于无极化时的情形,无极化时视电阻率的极大值出现在频率f=100 Hz附近,而存在极化时视电阻率极值则向低频偏移,出现在f=10 Hz附近。
图6
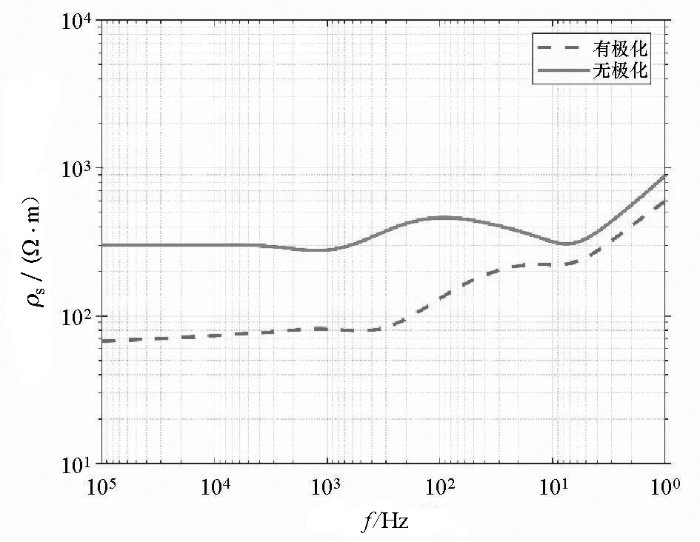
图6
K型地电模型极化层位于浅层时的视电阻率
Fig.6
Apparent resistivity of the K-type geoelectric model when the polarization layer is located in the shallow layer
3.1.2 极化层位于中间层
由图7可以看出,当极化层位于中间层时,视电阻率曲线对于有无极化层时的差异比极化层位于浅层时明显减小,极化层的影响主要体现在f=100~103 Hz的范围,并且在1 000 Hz附近出现了存在极化的视电阻率值略高于无极化时的情形,而在其他频率范围内,与无极化时的视电阻率正演结果接近。
图7
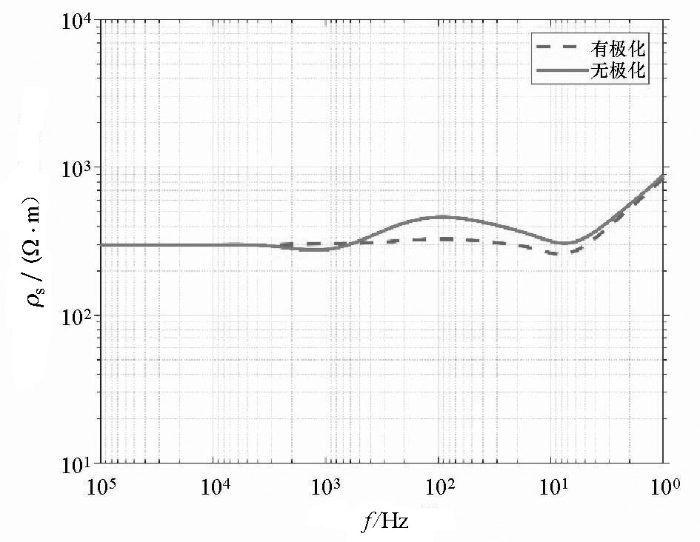
图7
K型地电模型极化层位于中间层时的视电阻率
Fig.7
Apparent resistivity of the K-type geoelectric model when the polarization layer is located in the middle layer
3.1.3 极化层位于深层
图8是极化层位于深层时的视电阻结果,由图可见,当极化层位于深层时,极化效应主要影响低频的数值,而当f>100 Hz时,激发极化效应对模型正演结果的影响可以忽略。
图8
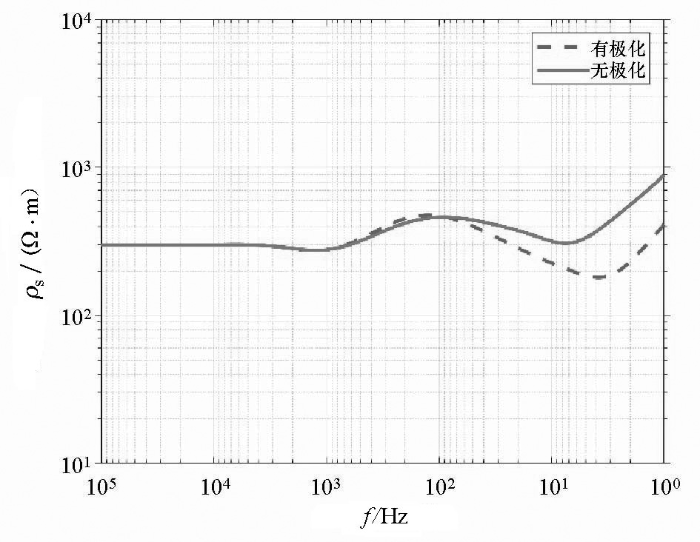
图8
K型地电模型极化层位于深层时的视电阻率
Fig.8
Apparent resistivity of the K-type geoelectric model when the polarization layer is located in the deep layer
3.2 模型二:HK型断面
含激电效应的四层地层HK型断面,收发距与频率范围均与模型一相同, 各地层电阻率与层厚度取值如表2所示。
表2 HK型地电模型参数设置
Table 2
| K型结构 | 电阻率/(Ω·m) | 层厚度/m |
|---|---|---|
| 第一层 | 500 | 200 |
| 第二层 | 300 | 100 |
| 第三层 | 1000 | 500 |
| 第四层 | 200 | ∞ |
3.2.1 极化层位于浅层
由图9可以看出,HK型断面的视电阻率曲线对于浅层有无极化层存在的变化情况与K型大致相同,视电阻率值也是在全频段均小于无极化时的情形,并且存在极化的视电阻率极值向低频偏移。
图9
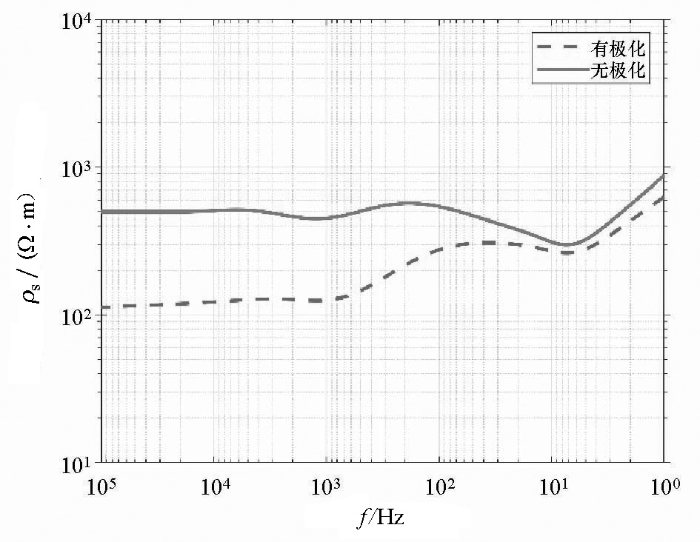
图9
HK型地电模型极化层位于第一层时的视电阻率
Fig.9
Apparent resistivity of HK-type geoelectric model when the polarization layer is located in the first layer
3.2.2 极化层位于中间层
图10
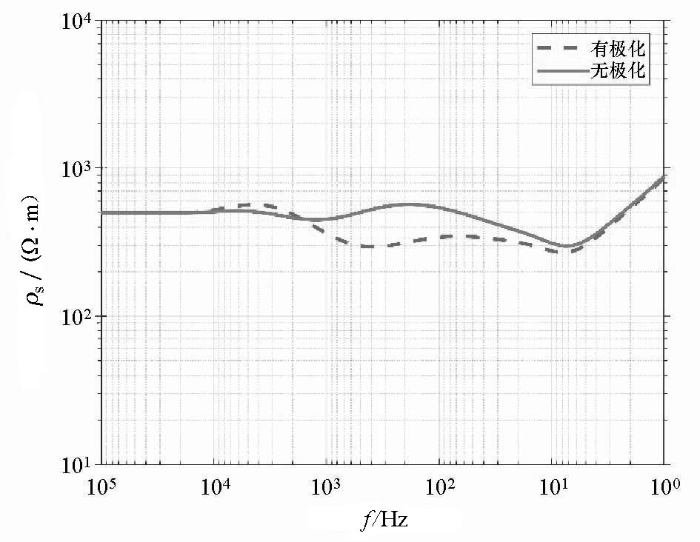
图10
HK型地电模型极化层位于第二层时的视电阻率
Fig.10
Apparent resistivity of HK-type geoelectric model when the polarization layer is located in the second layer
图11
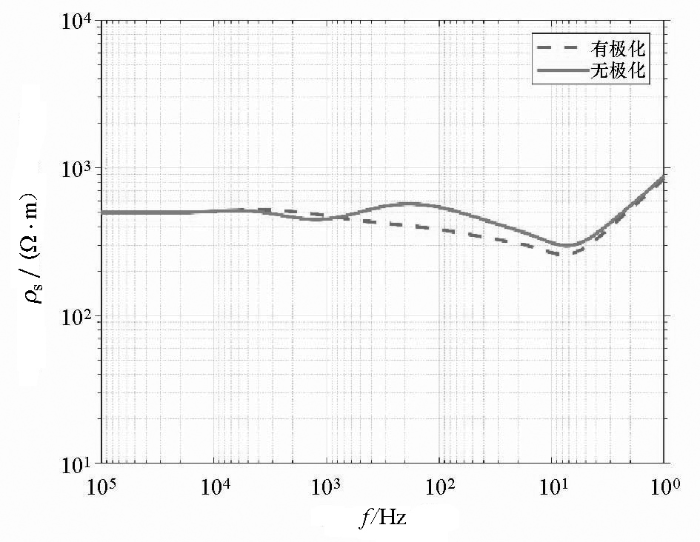
图11
HK型地电模型极化层位于第三层时的视电阻率
Fig.11
Apparent resistivity of HK-type geoelectric model when the polarization layer is located in the third layer
3.2.3 极化层位于深层
图12
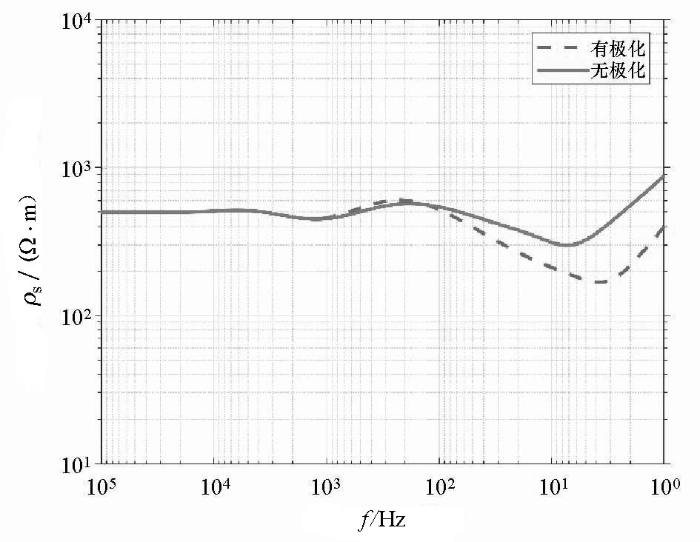
图12
HK型地电模型极化层位于第四层时的视电阻率
Fig.12
Apparent resistivity of HK-type geoelectric model when the polarization layer is located in the fourth layer
3.3 模型三:QQ型断面
含激电效应的四层地层QQ型断面,收发距与频率范围均与模型一相同, 各地层电阻率与层厚度取值如表3所示。
表3 QQ型地电模型参数设置
Table 3
| QQ型结构 | 电阻率/(Ω·m) | 层厚度/m |
|---|---|---|
| 第一层 | 1000 | 500 |
| 第二层 | 300 | 500 |
| 第三层 | 100 | 500 |
| 第四层 | 50 | ∞ |
3.3.1 极化层位于浅层
由图13可以看出,QQ型断面的视电阻率曲线对于浅层有无极化层存在的变化情况与前面讨论结果一致,视电阻率值也是在全频段均小于无极化时的情形,且无极化时视电阻率的极大值出现在频率f=1 000 Hz附近,而存在无极化时视电阻率的极大值向低频偏移,出现在f=80 Hz 附近。
图13
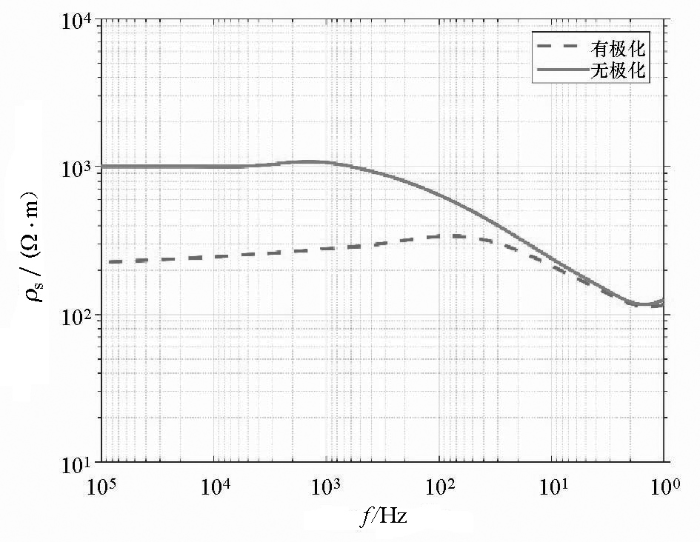
图13
QQ型地电模型极化层位于第一层时的视电阻率
Fig.13
Apparent resistivity of QQ-type geoelectric model when the polarization layer is located in the first layer
3.3.2 极化层位于中间层
图14
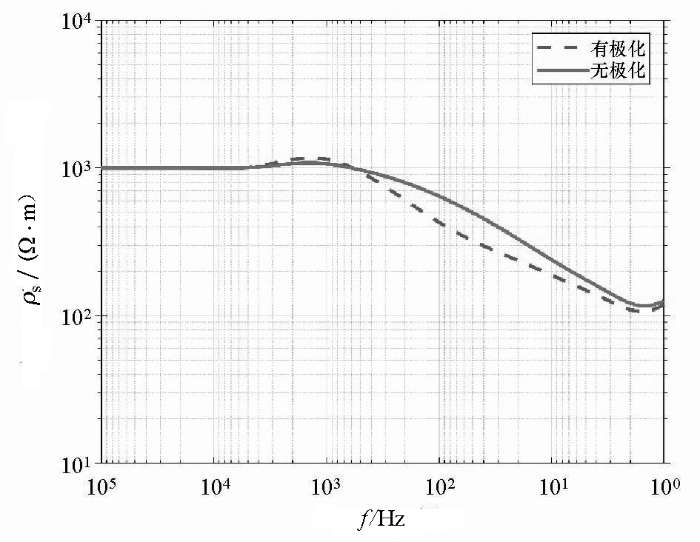
图14
QQ型地电模型极化层位于第二层时的视电阻率
Fig.14
Apparent resistivity of QQ-type geoelectric model when the polarization layer is located in the second layer
图15

图15
QQ型地电模型极化层位于第三层时的视电阻率
Fig.15
Apparent resistivity of QQ-type geoelectric model when the polarization layer is located in the third layer
3.3.3 极化层位于深层
图16
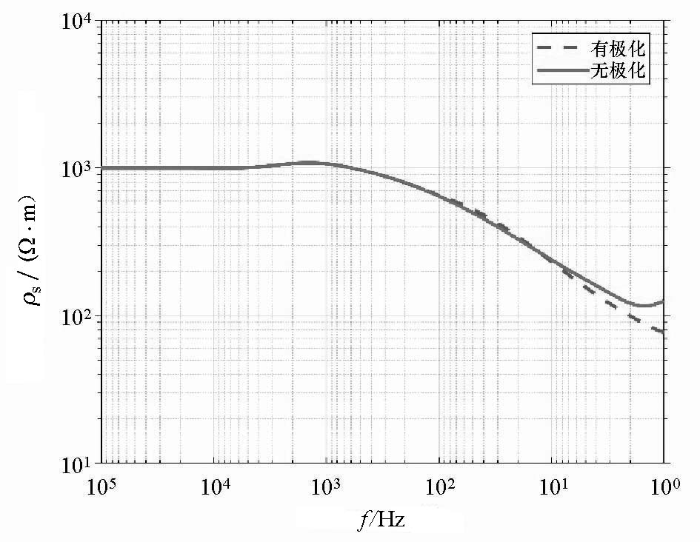
图16
QQ型地电模型极化层位于第四层时的视电阻率
Fig.16
Apparent resistivity of QQ-type geoelectric model when the polarization layer is located in the fourth layer
3.4 模型四:HAK型断面
含激电效应的五层地层HAK型断面,收发距与频率范围均与模型一相同, 各地层电阻率与层厚度取值如表4所示。
表4 HAK型地电模型参数设置
Table 4
| HAK型结构 | 电阻率/(Ω·m) | 层厚度/m |
|---|---|---|
| 第一层 | 500 | 500 |
| 第二层 | 50 | 100 |
| 第三层 | 200 | 800 |
| 第四层 | 1000 | 1000 |
| 第五层 | 100 | ∞ |
3.4.1 极化层位于浅层
由图17可以看出,当极化层位于浅层时,HAK型断面的存在极化时的视电阻率曲线也是在全频段均小于无极化时的情形,且存在极化时视电阻率极值向低频偏移。
图17
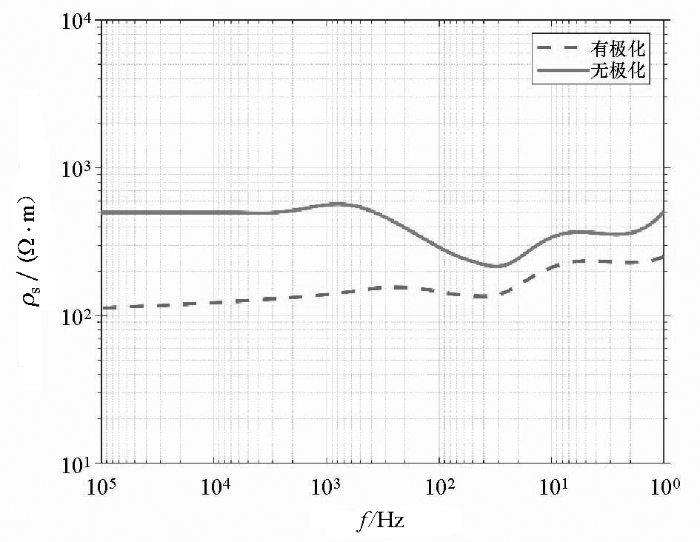
图17
HAK型地电模型极化层位于第一层时的视电阻率
Fig.17
Apparent resistivity of HAK-type geoelectric model when the polarization layer is located in the first layer
3.4.2 极化层位于中间层
图18
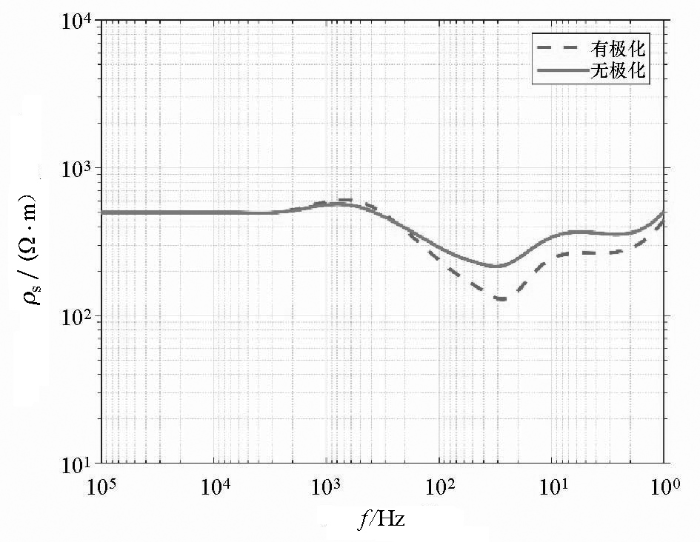
图18
HAK型地电模型极化层位于第二层时的视电阻率
Fig.18
Apparent resistivity of HAK-type geoelectric model when the polarization layer is located in the second layer
图19
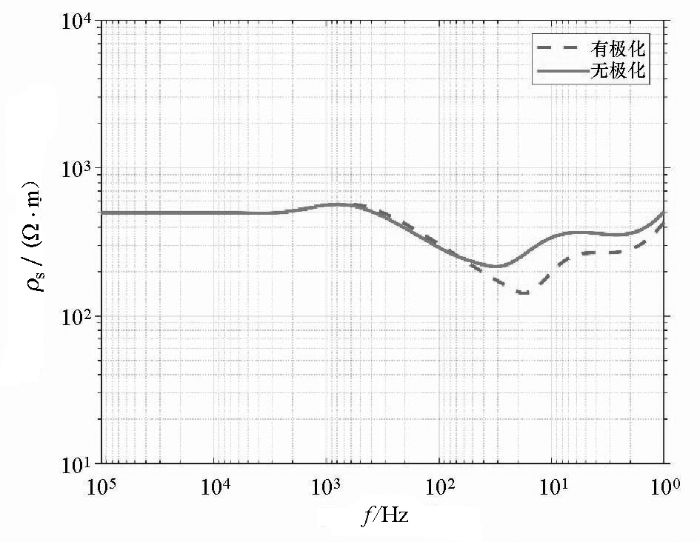
图19
HAK型地电模型极化层位于第三层时的视电阻率
Fig.19
Apparent resistivity of HAK-type geoelectric model when the polarization layer is located in the third layer
随着极化层深度的增加,视电阻率曲线对于有无极化层时的差异逐渐减小,且影响的异常频带也相对变窄。除此之外,第三层存在极化的视电阻率值高于无极化时的频带范围也小于极化层位于第二层时的情形,且同样呈现出向低频偏移的趋势,与前面的研究结果具有相似性。
3.4.3 极化层位于深层
图20
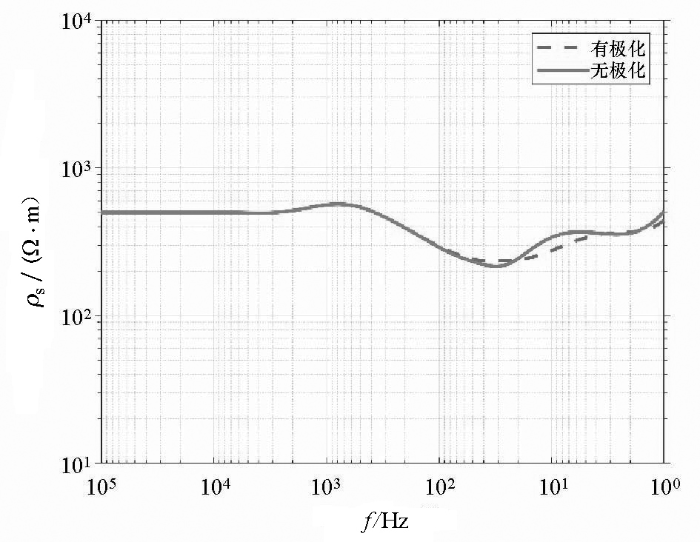
图20
HAK型地电模型极化层位于第四层时的视电阻率
Fig.20
Apparent resistivity of HAK-type geoelectric model when the polarization layer is located in the fourth layer
4 结论
本文基于Java语言的GUI图形用户界面,开发了一套CSAMT一维数据正演可视化软件,界面友好,自动化程度高,绘图功能与通用性强。通过理论模型的正演计算,验证了软件的正确性与便利性。通过使用Cole-Cole模型,研究了一维层状介质极化层分别位于不同深度时的视电阻率曲线的变化特征,研究发现极化层埋藏深度越浅,极化效应对CSAMT的影响频段越宽,有无极化的差异也越明显。当极化层存在并且位于中间层和深层时,视电阻率值会出现先高于然后再低于无极化的现象,特别是当极化层位于第二层时这种现象尤为明显。随着极化层埋藏深度的增加,出现视电阻率差异的位置越向低频偏移,并且这种差异越来越小。这些结论对于认识含极化效应的CSAMT方法的电磁响应特征,提高野外工作效率和资料处理与解释精度都有较大的意义。
参考文献
基于快速汉克尔变换算法的CSAMT一维正演
[J].
Linear dimension forward solution of CSAMT by Hankel transformation method
[J].
基于Cole-Cole复电阻率模型的线源可控源有限元数值模拟
[J].
Finite element numerical simulation on line controlled source based on Cole-Cole model
[J].
CSAMT正演模拟中激电效应的初步研究
[C]//
The preliminary research on IP effect in CSAMT
[C]//
油气藏MT激电效应一维正演研究
[J].
1D forward simulation of MT IP effect of reservoir
[J].
快速汉克尔变换及其在正演计算中的应用
[J].
Fast Hankel transformation and its application in forward computing
[J].
索末菲尔德积分新方法——快速汉克尔变换
[J].
A new method to calculate Sommerfeld integral:Fast hankel transform
[J].
