

0 引言
目前,国内外应用较多的土壤重金属评价方法主要有内梅罗指数法、地累积指数法和污染负荷指数法等[5,6,7,8],每种方法各具特点。内梅罗指数法是一种兼顾极值或突出最大值的计权型多因子环境质量指数法,该方法是以单指标污染指数为基础的综合污染程度评价方法,其中单项污染指数是指某种重金属含量实测值与其评价标准的比值,能够反映该重金属元素的污染程度。以单项污染指数为基础,通过计算内梅罗综合污染指数可以较全面地反映多种污染物的共同作用,突出显示污染最严重的重金属元素的危害性[9]。地累积指数由Müller于1969年提出,也称为Müller指数,是一种定量评价重金属污染的方法,该方法既考虑了自然地质过程决定的元素背景含量,也考虑了人类活动过程对重金属的叠加影响,能够直观地反映外源重金属在沉积物中的富集程度[10]。1980年Tomlinson提出了污染负荷指数法,该方法根据土壤某种重金属实测浓度和该元素背景值求出单元素污染负荷指数,然后采用先累乘、再求根的算法计算污染负荷指数,不仅能综合反映多种重金属对环境污染的贡献,而且能够反映区域综合污染情况[11]。笔者以天津核桃产区为依托,选用内梅罗指数法、地累积指数法和污染负荷指数法等3种方法评价了研究区土壤重金属污染情况,初步查明了土壤环境质量、核桃食用安全性,为开展核桃种植布局、保障特色农产品食用安全、保障人体健康提供依据。
1 材料与方法
1.1 研究区概况
蓟州属于暖温带半湿润季风型大陆性气候,年平均气温11.4~12.9 ℃,平均降水量520~660 mm。蓟州北部山区是天津核桃的主要产区,核桃多分布在海拔50~800 m的丘陵山地,土壤类型主要为棕壤和褐土,土地利用类型主要为林地和园地等。蓟州区核桃种植面积达10 km2,年产量55万kg,主要品种有圆绵核桃、绵核桃、长绵核桃、扁绵核桃、小绵核桃、绵瓢核桃等,其中以圆绵核桃栽培面积最大、产量最高、品质最佳,其果个大皮薄,单果重17 g左右。
1.2 样品采集与处理
主要根据土地利用现状图,结合当地核桃种植分布,兼顾代表性和均匀性原则,布设采样点位(图1)。共采集表层土壤样品60件,采样深度为0~40 cm,如土层厚度不足40 cm,按实际厚度采集。每个样点由4~5个子样点组成, 子样点要求土壤类型一致, 分布于中心采样点50 m范围内。 各子样等份混合均匀后用四分法取1~2 kg装入干净样品袋中。采样时避开沟渠、路边、旧房基、粪堆及微地形高低不平无代表性地段。
图1
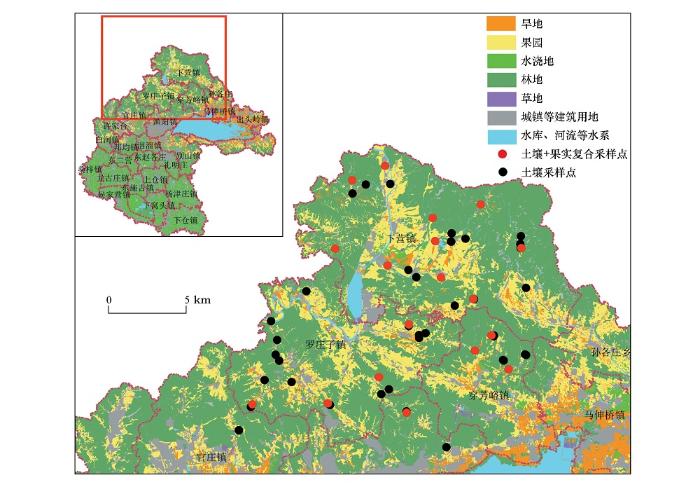
在采集土壤样的范围内,选择长势较好的核桃树,采集核桃鲜果样品。共采集核桃样品18件,每件样品由3~5颗核桃树的核桃果实构成,每件样品总质量大于3 kg。
野外采回的土壤样品置于干净整洁样品架上自然风干。风干过程中,适时翻动,并将大土块用木棒敲碎以防止黏结成块,同时剔除土壤以外的杂物。风干后的样品平铺在制样板上,用木棍碾压,并将植物残体、石块等侵入体和新生体剔除干净。压碎的土样全部通过孔径2 mm的尼龙筛,未过筛的土粒重新碾压过筛,直至全部样品通过2 mm孔径筛为止。过筛后土壤样品经混匀后,取200 g装入牛皮纸袋作为分析样品,另取至少300 g装入干净塑料瓶作为副样保存。
采回的核桃样品先去除外壳,再用自来水和蒸馏水依次清洗,清洗干净、擦干后立即称其鲜样质量。然后将鲜样置于冷冻干燥机中进行冷冻干燥,待样品完全干燥后,称重,计算干湿比。干样用高速破碎机制成粉样后,放入牛皮纸袋中,置于干燥器内保存,备用。
1.3 样品测试分析
土壤样品在实验室用无污染球磨机研磨至200目,以供元素测试分析使用。称取10 g土壤样品,经无CO2水浸取,采用离子选择性电极测定pH;称取0.1 g土壤样品,经HNO3-HF-HClO4消解,采用等离子体质谱仪(ICP-MS7700x美国安捷伦科技公司)测定Cd、Zn、Cu、Pb和Cr;称取0.25 g土壤样品,经王水消解,采用原子荧光光度计(AFS-3100 北京海光仪器公司)测定Hg和As。核桃样品经HNO3消解后与土壤样品同步测定。
样品分析测试过程中采用国家一级标准物质GBW07425、GBW07446、GBW0753、GBW0756对土壤样品进行质量控制,采用GBW10015、GBW10048对核桃样品进行质量控制,测试指标的精密度和准确度均符合《土地质量地球化学评价规范》(DZ/T 0295—2016)和《生态地球化学评价样品分析技术要求(试行)》(DD2005-03)的要求。
1.4 数据处理
采用Microsoft Excel 2010 和 IBM SPSS Statistics 19.0进行数据处理分析,采用ESRI Arcgis 10.2和Corel DRAW 2018绘制图件。
1.5 评价方法及评价标准
1.5.1 内梅罗指数法
单项污染指数计算公式:
式中:Pi为某污染物i的污染指数;Ci为污染物i的实测值;Si为污染物i的评价标准。本文以《土壤环境质量 农用地土壤污染风险管控标准(试行)》(GB15618—2018)中风险筛选值为评价标准。
综合污染指数计算公式如下:
式中:I为某调查点位内梅罗综合污染指数;Piave为该调查点位土壤中各重金属元素污染指数的算数平均值;Pimax为该调查点位土壤中重金属元素的最大单项污染指数。单项污染指标与内梅罗综合污染指数的分级标准见表1。
表1 单项污染指标与内梅罗综合指数分级标准
Table 1
| 污染等级 | 单项污染指数分级标准 | 综合污染指数分级标准 | ||
|---|---|---|---|---|
| 污染指数 | 污染水平 | 污染指数 | 污染水平 | |
| Ⅰ | Pi<1 | 清洁 | I<0.7 | 清洁 |
| Ⅱ | 1≤Pi<2 | 轻污染 | 0.7≤I<1 | 尚清洁 |
| Ⅲ | 2≤Pi<3 | 中污染 | 1≤I<2 | 轻污染 |
| Ⅳ | Pi≥3 | 重污染 | 2≤I<3 | 中污染 |
| Ⅴ | I≥3 | 重污染 | ||
1.5.2 地累积指数法
地累积指数计算公式如下:
表2 地累积指数(Igeo)分级标准
Table 2
| 地累积指数Igeo | 分级 | 污染程度 |
|---|---|---|
| Igeo≤0 | 0级 | 无污染 |
| 0<Igeo≤1 | 1级 | 无污染—中度污染 |
| 1<Igeo≤2 | 2级 | 中度污染 |
| 2<Igeo≤3 | 3级 | 中度污染—强污染 |
| 3<Igeo≤4 | 4级 | 强污染 |
| 4<Igeo≤5 | 5级 | 强污染—极强污染 |
| Igeo>5 | 6级 | 极强污染 |
1.5.3 污染负荷指数法
某一点位的污染负荷指数计算公式如下:
式中:Fi为元素i的污染指数;Ci为含量实测值;Cni为地球化学背景值[12];IPL为某一点位的污染负荷指数;n为元素种类。
某一区域的污染负荷指数计算公式如下:
式中:IPLzone为区域的污染负荷指数;n为采样点个数。
污染负荷指数分为4个等级,如表3所示。
表3 污染负荷指数等级划分
Table 3
| IPLzone | <1 | 1~2 | 2~3 | ≥3 |
|---|---|---|---|---|
| 污染等级 | 0 | I | Ⅱ | Ⅲ |
| 污染程度 | 无污染 | 中等污染 | 强污染 | 极强污染 |
2 结果与讨论
2.1 土壤重金属含量
运用 IBM SPSS Statistics 19对土壤元素含量进行分布检验,K-S检验结果显示,Hg、As和Cr呈正态或近似正态分布,用算数平均值表示其平均含量;Cd、Pb、Cu和Zn呈对数正态或近似对数正态分布,用几何平均值表示其平均含量。统计发现(表4),研究区Cd、Hg、Pb、As、Cr、Zn和Cu平均含量分别为0.19×10⁻⁶、0.06×10⁻⁶、24.1×10⁻⁶、11.9×10⁻⁶、75.5×10⁻⁶、78.9×10⁻⁶和30.6×10⁻⁶。Pb、Cr和Zn平均含量低于天津市背景值,Cu平均含量与背景值基本持平,而Cd、Hg和As平均值均超过了天津市土壤背景值[12],分别为背景值的1.11倍、1.50倍和 1.19倍,Hg富集较明显。Cd、Hg、Pb、As、Cr、Zn和Cu含量最大值分别为背景值的4.29、4.25、4.31、2.38、1.78、2.49和4.40倍,说明这些元素存在明显的局部富集现象,这与张红桔等[1]对浙江临安山核桃产区的研究结果相似,表明研究区有可能受到人为活动影响而导致土壤重金属局部累积。而且,与《土壤环境质量 农用地土壤污染风险管控标准(试行)》(GB 15618—2018)中风险筛选值相比,部分样点Cd和Cu超过筛选值,超标率分别为11.7%和1.7%。
表4 土壤重金属元素含量统计
Table 4
| 元素 | 最小值/10-6 | 最大值/10-6 | 平均值/10-6 | 中位数/10-6 | 标准差/10-6 | 变异系数/% | 天津市背景值[12]/10-6 |
|---|---|---|---|---|---|---|---|
| Cd | 0.08 | 0.73 | 0.19 | 0.18 | 0.12 | 0.63 | 0.17 |
| Hg | 0.02 | 0.17 | 0.06 | 0.06 | 0.03 | 0.44 | 0.04 |
| Pb | 11.8 | 112.8 | 24.1 | 23.5 | 13.95 | 0.57 | 26.2 |
| As | 2.44 | 23.8 | 11.9 | 11.9 | 4.42 | 0.37 | 10 |
| Cr | 33.6 | 138.7 | 75.5 | 72.9 | 15.9 | 0.21 | 77.8 |
| Zn | 34.3 | 214.3 | 78.9 | 76.8 | 29.6 | 0.37 | 86.2 |
| Cu | 13.4 | 134.5 | 30.6 | 29.7 | 29.6 | 0.51 | 30.6 |
| pH | 4.46 | 7.88 | 7.03 | 7.31 | 0.81 | 0.11 | 8.07 |
2.2 土壤重金属污染评价
2.2.1 内梅罗指数法评价结果
土壤重金属单项污染指数及其污染等级划分结果见表5。单项污染指数平均值Cd>As>Cu>Cr>Zn>Pb>Hg。Cd和Cu存在污染样点,其中Cd有10.0%的样点为轻度污染,1.7%的样点为中度污染;Cu有1.7%的样点为轻度污染。
表5 土壤重金属元素单项污染指数统计结果
Table 5
| 元素 | 单项污染指数Pi | 样点占比/% | ||||||
|---|---|---|---|---|---|---|---|---|
| 最小值 | 最大值 | 平均值 | 中位数 | 清洁 | 轻污染 | 中污染 | 重污染 | |
| Cd | 0.14 | 2.44 | 0.57 | 0.44 | 88.3 | 10.0 | 1.7 | 0 |
| Hg | 0.01 | 0.10 | 0.02 | 0.02 | 100 | 0 | 0 | 0 |
| Pb | 0.09 | 0.94 | 0.21 | 0.18 | 100 | 0 | 0 | 0 |
| As | 0.08 | 0.79 | 0.42 | 0.42 | 100 | 0 | 0 | 0 |
| Cr | 0.13 | 0.69 | 0.38 | 0.36 | 100 | 0 | 0 | 0 |
| Zn | 0.11 | 0.86 | 0.33 | 0.30 | 100 | 0 | 0 | 0 |
| Cu | 0.13 | 1.35 | 0.39 | 0.34 | 98.3 | 1.7 | 0 | 0 |
计算得到土壤重金属元素综合污染指数见表6。结果显示,研究区清洁和尚清洁的点位比例分别为85.0%和8.3%,表明研究区土壤环境质量总体较好,但由于部分点位Cd和Cu的单项污染指数达到污染水平,导致其中6.7%的样点存在轻度污染。
表6 内梅罗综合污染指数法评价结果
Table 6
| 评价结果 | 综合污染指数 | 样本数 | 占比/% | ||
|---|---|---|---|---|---|
| 最小值 | 最大值 | 平均值 | |||
| 清洁 | 0.16 | 0.65 | 0.45 | 51 | 85.0 |
| 尚清洁 | 0.70 | 0.92 | 0.80 | 5 | 8.3 |
| 轻度污染 | 1.08 | 1.82 | 1.34 | 4 | 6.7 |
| 中度污染 | — | — | — | — | — |
| 重度污染 | — | — | — | — | — |
注:“—”表示无相应数据
2.2.2 地累积指数法评价结果
表7 地累积指数及其污染等级划分结果统计
Table 7
| 元素 | 地累积指数Igeo | 污染等级样点占比/% | |||||||||
|---|---|---|---|---|---|---|---|---|---|---|---|
| 最小值 | 最大值 | 平均值 | 无污染 | 无—中污染 | 中污染 | 中污染—强污染 | 强污染—极强污染 | 极强污染 | |||
| Cd | -0.43 | 2.69 | 0.77 | 5.0 | 68.3 | 21.7 | 5.0 | 0.0 | 0.0 | ||
| Hg | -0.15 | 2.69 | 1.03 | 1.7 | 41.7 | 50.0 | 6.7 | 0.0 | 0.0 | ||
| Pb | -0.57 | 2.69 | 0.47 | 15.0 | 78.3 | 5.0 | 1.7 | 0.0 | 0.0 | ||
| As | -1.45 | 1.84 | 0.73 | 8.3 | 56.7 | 35.0 | 0.0 | 0.0 | 0.0 | ||
| Cr | -0.63 | 1.42 | 0.51 | 5.0 | 90.0 | 5.0 | 0.0 | 0.0 | 0.0 | ||
| Zn | -0.74 | 1.90 | 0.46 | 11.7 | 80.0 | 8.3 | 0.0 | 0.0 | 0.0 | ||
| Cu | -0.60 | 2.72 | 0.59 | 8.3 | 78.3 | 11.7 | 1.7 | 0.0 | 0.0 | ||
2.2.3 污染负荷指数法
土壤污染负荷指数涵盖了7种重金属污染因子,更加直观、综合地表征了研究区土壤重金属污染水平。研究区内土壤污染负荷指数变化范围在0.58~1.88,平均值为1.08。根据污染负荷指数分级标准,中等污染样品点位占61.7%,剩余38.3%的样品无污染。如图2所示,中度污染点位均匀分布于研究区,没有明显的地域聚集现象。计算得出研究区的区域污染负荷指数为1.05,属中等污染程度,表明研究区土壤已受到污染,重金属污染来源还需要进一步调查研究。
图2
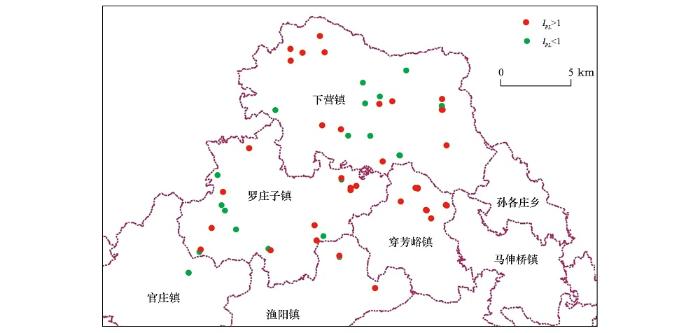
图2
土壤重金属元素污染负荷指数分布
Fig.2
Risk assessment map of calculated indices IPL in study area
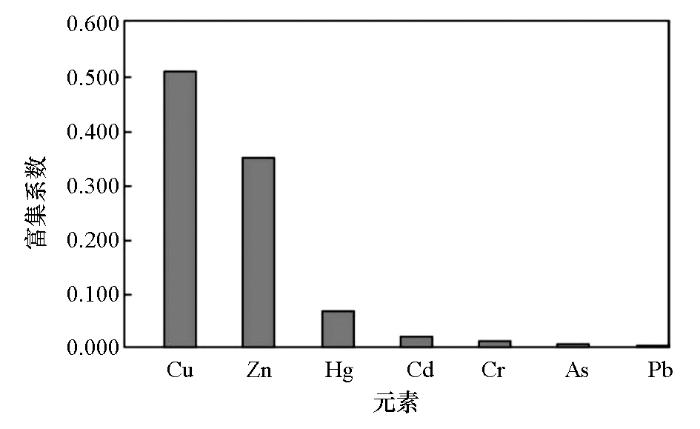
2.3 核桃中元素含量及生物富集系数
核桃样品中Cd、Hg、Pb、As和Cr平均含量分别为0.003×10⁻⁶、0.004×10⁻⁶、0.044×10⁻⁶、0.043×10⁻⁶和0.760×10⁻⁶,《参照食品安全国家标准 食品中污染物限量》(GB 2762—2017),所有样品中的重金属含量均未超过标准限值(表8)。
表8 核桃中重金属元素含量统计
Table 8
| 元素 | 最小值/10-6 | 最大值/10-6 | 平均值/10-6 | 中位数/10-6 | 标准差 | 变异系数/% | 限量标准/10-6 |
|---|---|---|---|---|---|---|---|
| Cd | 0.001 | 0.020 | 0.003 | 0.002 | 0.004 | 129.2 | 0.5 |
| Hg | 0.001 | 0.007 | 0.004 | 0.003 | 0.002 | 52.9 | 0.02 |
| Pb | 0.021 | 0.114 | 0.044 | 0.040 | 0.022 | 49.7 | 0.2 |
| As | 0.027 | 0.142 | 0.043 | 0.037 | 0.026 | 60.4 | 0.5 |
| Cr | 0.613 | 0.981 | 0.760 | 0.744 | 0.105 | 13.8 | 1.0 |
| Zn | 16.43 | 33.94 | 25.48 | 27.58 | 6.27 | 24.6 | — |
| Cu | 8.90 | 18.88 | 14.68 | 14.69 | 2.87 | 19.6 | — |
注:核桃样本数为18件;“—”表示在GB 2762—2017中未给限值标准。
图3
3 结论
1) 研究区土壤中Cd、Hg、Pb、As、Cr、Zn和Cu平均含量分别为0.19×10⁻⁶、0.06×10⁻⁶、24.1×10⁻⁶、11.9×10⁻⁶、75.5×10⁻⁶、78.9×10⁻⁶和30.6 ×10⁻⁶。Cd、Hg、As和Cu平均含量均超过了天津市土壤元素背景值,分别有11.7%和1.7%土壤样点的Cd和Cu超过农用地土壤污染风险筛选值。
2) 内梅罗综合指数显示,研究区93.3%样点土壤环境质量为清洁等级,部分样点Cd和Cu为轻度污染。
3) 综合地累积指数法和污染负荷指数法的评价结果,可以得出研究区存在人为原因引起的重金属积累。
4) 核桃样品中Cd、Hg、Pb、As和Cr平均含量分别为0.003×10⁻⁶、0.004×10⁻⁶、0.044×10⁻⁶、0.043×10⁻⁶和0.760×10⁻⁶,所有样品的重金属含量均满足食品安全要求。相比于Cd、Hg、Pb、As和Cr等元素,核桃对Zn和Cu有更高的富集能力。
参考文献
典型山核桃产区土壤重金属空间异质性及其风险评价
[J].
Spatial variation of heavy metals in soils and its ecological risk evaluation in a typical carya cathayensisproduction area
[J].
云贵川主产区核桃中重金属污染水平及其风险评估
[J].
The contents and risk assessments of heavy metals in walnuts from the main producing area of Yunnan, Guizhou, Sichuan provinces
[J].
Heavy metal contamination assessment of surface sediments of the Subei Shaol, China: Spatial distribution, source apportionment and ecological risk
[J].
DOI:10.1016/j.chemosphere.2019.02.058
URL
PMID:30784728
[本文引用: 1]

This study investigated heavy metals (Ni, Zn, Cr, Cu, As, Pb, Cd and Hg) concentrations in surface sediment of Subei Shoal, China, to illustrate their spatial distribution characteristics, sources and potential ecological risk of pollution. Contents of total organic carbon (TOC), clay, silt and sand were 1.7+/-0.8%, 3.3+/-3.2%, 13.6+/-14.2% and 83.1+/-17.4%, respectively. The spatial distribution of TOC, clay and silt were similar; however, distribution of Hg was inverse. Concentrations of Ni, Zn, Cr, Cu, As, Pb, Cd and Hg were 47.88+/-8.93, 38.18+/-8.86, 19.22+/-5.14, 11.32+/-5.07, 6.97+/-2.45, 0.13+/-0.72, 0.56+/-0.77 and 0.06+/-0.02mgkg(-1) sediment, respectively. Principal component analysis suggested that Cu, Zn, Cd, Cr and Ni were mainly derived from natural sources, whereas Pb, Cd, As and Hg from industrial and agricultural sources. Results of geo-accumulation index, potential ecological risk index (RI), pollution load index (PLI), toxic risk index (TRI) and contamination severity index (CSI) demonstrated that pollution levels of Cd and Hg were moderate, which should attract more attention as main pollution factors. The pollution was mainly distributed in the central and northern parts, and the southern part had a good ecological environment. Moreover, the contaminated stations accounted respective for 33.4%, 25.9%, 33.3% and 70.4% of RI, PLI, TRI and CSI, of which 70.4% of the contamination severity index stations contained 66.7% of much lower severity stations. These findings could contribute to more effective exploitation of tidal flat resources, and the prevention and treatment of tidal marsh environment.
Source identification of eight heavy metals in grassland soils by multivariate analysis from the Baicheng-Songyuan area, Jilin Province, Northeast China
[J].
DOI:10.1016/j.chemosphere.2015.04.008
URL
PMID:25911049
[本文引用: 1]
The characterization of the concentration, chemical speciation and source of heavy metals in soils is an imperative for pollution monitoring and the potential risk assessment of the metals to animal and human health. A total of 154 surface horizons and 53 underlying horizons of grassland soil were collected from the Baicheng-Songyuan area in Jilin Province, Northeast China, in which the concentrations and chemical fractionations of As, Cd, Cr, Cu, Hg, Ni, Pb, and Zn were investigated. The mean concentrations of heavy metals in grassland topsoil were 7.2, 0.072, 35, 16.7, 0.014, 15.2, 18.3 and 35 mg kg(-)(1) for As, Cd, Cr, Cu, Hg, Ni, Pb and Zn, respectively, and those averaged contents were lower than their China Environmental Quality Standard values for the Soils, implying that heavy metal concentrations in the studied soils were of the safety levels. The mobility sequence of the heavy metals based on the sum of the soluble, exchangeable, carbonate-bound and humic acid-bound fractions among the seven fractions decreased in the order of Cd 50.4%)>Hg (39.8%)>Cu (26.5%)>As (19.9%)>Zn (19.1%)>Ni (15.9%)>Pb (14.1%)>Cr (4.3%), suggesting Cd and Hg may pose more potential risk of soil contamination than other metals. Multivariate statistical analysis suggested that As, Cr, Cu, Ni, Pb, Zn, Cd and Hg had the similar lithogenic sources, however, Cd and Hg were more relevant to organic matter than other heavy metals, which was confirmed by the chemical speciation analysis of the metals. The study provides a base for local authority in the studied area to monitor the long term accession of heavy metals into grassland soil.
平原农区空心村典型土壤的重金属污染评价——以山东省禹城市为例
[J].
Consolidation and using oriented evaluation of heavy metal pollution in typical soils of hollowed villages of plain agricultural zones: A case study of Yucheng city, Shandong province, China
[J].
Schwermetalle in den sedimenten des rheins-veranderungen seit 1971
[J].
An ecological risk index for aquatic pollution control: A sedimentological approach
[J].DOI:10.1016/0043-1354(80)90143-8 URL [本文引用: 1]
Problems in theassessment of heavy-metal levels in estuaries and the formation of a pollutionindex
[J].
天津市郊农田土壤重金属积累特征及评价
[J].
Accumulation characteristics and evaluation of heavy metals in suburban farmland soils of Tianjin
[J].
天津近郊农田土壤重金属风险评价及空间主成分分析
[J].
Ecological risk assessment and principal component analysis of heavy metals in suburban farmland soils of Tianjin
[J].
江苏省某镇土壤重金属污染评价
[J].
Evaluation of soil heavy metals pollution in a town, Jiangsu province
[J].
天津板栗品质分析及其立地地质背景研究
[J].
Chemical composition analysis and site geological background of castanea mollissima blume quality in Tianjin
[J].
Spatial variability of nutrient properties in black soil of Northeast China
[J].
DOI:10.1016/S1002-0160(07)60003-4
URL
[本文引用: 1]
AbstractA total of 1400 soil samples from the plow layer (0–20 cm) at an approximate interval of 5 km were collected in the autumn of 2002 over the entire black soil arable crops region to determine the spatial variability of seven variables, such as total organic matter content (OMC), total N, total P, total K, alkali-dissolvable N (AN), available P (AP) and available K (AK), with classical statistics and geostatistical analysis across the entire black soil area in Northeast China. In nonsampled areas ordinary kriging was utilized for interpolation of estimated nutrient determinations. Classical statistics revealed highly significant (P ≤ 0.01) correlations with all seven of the soil properties, except for OMC with AP and total K with AK. In addition, using coefficients of variation, all soil properties, except for total K, were moderately variable. A geostatistical analysis indicated that structural factors, such as parent material, terrain, and water table, were the main causes of the spatial correlations. Strong spatial correlations were noted with OMC, total N, total P, AN, and AP, while they were moderate for total K and AK. The effective spatial autocorrelation of OMC, total N, total P, and AN ranged from 1037 to 1353 km, whereas the ranges of total K, AP, and AK were only from 6 to 138 km. The fit of the experimental semi-variograms to the theoretical models indicated that except for AN, kriging could successfully interpolate other six variables. Thus, the geostatistical method used on a large scale could accurately evaluate the spatial variability of most black soil nutrient properties in Northeast China]]>
黑龙江生态省土壤重金属分布特征及其生态风险评价
[J].
Distribution characteristics of heavy metals in soils of Heilongjiang ecological province and its ecological risk assessment
[J].
天津市郊区土壤重金属的污染评价与来源解析
[J].
Pollution evaluation and source apportionment of heavy metals in soils from Tianjin suburbs, China
[J].
基于多种方法的苏南镇域土壤重金属污染评价
[J].
Evaluation of soil heavy metal pollution in southern towns of Jiangsu province by multiple methods
[J].
新疆6个核桃品种种仁主要营养成分比较分析
[J].
Comparative analysis on main nutrient components in the kernel of six walnut varieties in Xinjiang
[J].
临安山核桃主产区林地土壤重金属生态风险评价
[J].
Ecological risk evaluation of heavy metals in soils of carya cathayensis plantations, Lin’an
[J].
