

0 引言
多重分形理论通过对地球化学数据分形形式的拟合可以识别出不同含量无标度区的界限值,从而确定异常下限。近年来有许多较为成功的应用[10,11,12,13,14,15,16,17,18],已被学者们广泛认可。然而在多重分形模型中,元素的分布形式也同样受到台阶效应的影响:左仁广等在研究冈底斯带水系沉积物数据时发现,在地质背景复杂的地区,分形特征也显得更为复杂[19];刘舒飞在对右江盆地的研究中发现,C-A模型对于低背景值中叠加高异常的情况,以及岩体或背景引起的高背景中出现弱异常情况,识别效果欠佳[20]。在本质上,一组具有台阶效应的地球化学数据集合是由多组有差别分形分布数据集合叠加而成的。虽然多重分形理论能够以分段直线相交的形式识别出不同含量无标度区间的分界[21],但叠加后的分布形式仍会丢失部分地质成矿信息。目前相关问题的研究仍较为欠缺。笔者就分形分布数据集合的叠加规律进行研究,并对地球化学台阶效应问题进行初步探索,提出根据地球化学背景进行分区分别处理,从而识别低背景区中弱异常的思路。
1 地球化学分形数据的叠加规律
分形这一概念于1983年由Mandelbrot首先提出[22],在分形几何中,图形的某种度量δ和与度量尺度M(δ)间服从幂律关系,可用以下M(δ)和δ函数关系式表示:
式中:∝代表成比例,E代表拓扑维数,D代表分形维数。式(1)可经对数转换为如下形式:
在具体问题中,式(2)E、D、b为常数,即lgM(δ)和lgδ[4]呈线性相关。
式中:D为常数,代表剩余分形维数。由式(3)可转换得到如下形式:
即lgA(C)和lgC呈线性相关。在C-A双对数图中,-D为线性回归直线的斜率,b为该直线的截距。
若变量A(C)与C之间存在如下的关系:
A(C≤C1)∝
以含量—面积分形模型为例,具台阶效应的地球化学数据可以理解为多组具不同元素背景及分布形式数据的叠加,为了对C-A双对数图上两数据集合的叠加规律及特征进行探讨,不妨假设现有完全符合含量—面积分形分布的两组理想的地球化学数据,它们在含量—面积的双对数图上表现为直线a和b(图1a),其分布形式满足
直线
直线
图1
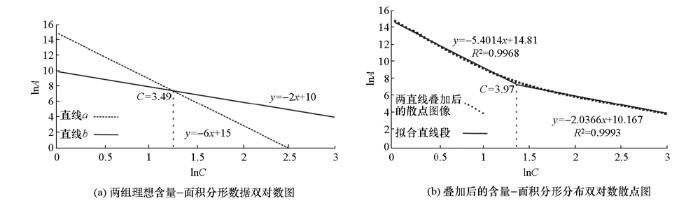
图1
两组符合分形规律的地球化学数据叠加前(a)、后(b)的双对数图
Fig.1
Double logarithmic plots before(a) and after(b) superposition of two sets of ideal geochemical data in accordance with fractal laws
式中:x代表元素含量值以e为底的对数;y1和y2代表大于x对应小于该含量值的区域面积之和以e为底的对数,其图像如图1a所示。当符合a直线和b直线两种简单分形分布的两组数据放在一起组成一组新的数据时,其叠加的分布形式可推为:
我们也可以通过上述分形规律解读并且推测其中蕴含的地球化学规律:在地质情况复杂的实际应用中,一个图幅的数据是几组不同背景的数据叠加。叠加的数据包含各组分形数据的地球化学信息,含量高和面积大的地球化学信息能够得到充分的体现,而有相当部分的信息被弱化并覆盖,尤其是低背景区数据的异常。双对数图中, 这种情况下的拟合直线拐点仅包含两组数据的数据台阶信息,其往往由地球化学背景的差异所决定, 与成矿并没有直接关系,在其附近区间,由于斜率变化较大,有用信息也将难以辨别。
综上所述,含量—面积分形方法强化了含量高、范围广的异常,但对低背景区异常有一定的弱化甚至覆盖。基于这一认识,可以通过对研究区图幅按地球化学背景分类圈定子区,分别探讨子区的分形分布形式以应对上述问题。
2 区域地质背景
图2
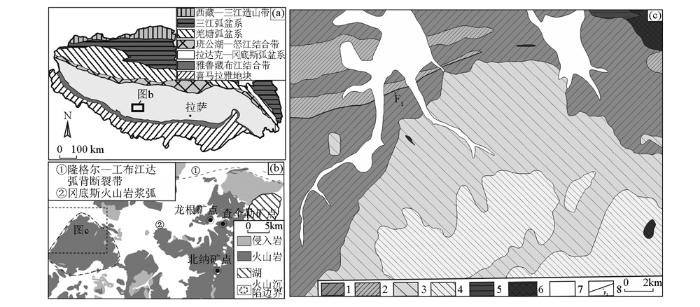
图2
冈底斯区域构造位置图(a)[27]及普杰地区区域矿产地质简图(b)、地质图(c)
1—上石炭-下二叠统拉嘎组地层(C2P1l);2—下二叠统昂杰组地层(P1a);3—古新统典中组火山地层(E1d);4—始新统年波组火山地层(E2n);5—上白垩统江巴组火山地层(K2jb);6—侵入体;7—第四系冲洪积物(Q);8—堆驾拉逆断层
Fig.2
Tectonics and position regional map of Gangdise(a)[27], sketch map of regional mineral resources(b) and geological map(c) in Pujie area
1—upper Carboniferous-lower Permian Laga formation(C2P1l); 2—lower Permian Angjie formation(P1a); 3—Paleocene Dianzhong formation(E1d); 4—Eocene Nianbo formation(E2n); 5—upper Cretaceous Jiangba formation(K2jb); 6—intrusions; 7—Quaternary sediments(Q); 8—Duijiala reverse fault
区内主要出露石炭—二叠系以昂杰组和拉嘎组为主的沉积地层,以及以典中组和年波组为主的林子宗群中酸性火山地层,火山地层占全区面积的一半以上,形成普杰火山喷发带覆盖于沉积地层之上,区内侵入岩主要为晚白垩世和始新世时期的中酸性小侵入体(图2c)。
3 数据统计特征
本次样品采集于普杰地区的1:50 000水系沉积物测量,测量面积433 km2,采集样品1 718件,采样密度4个/km2。于自然资源部沈阳矿产资源监督检测中心(辽宁省地质矿产研究院)分析测试,测试项目为Au、Ag、Cu、Pb、Zn、Cd、W、Sn、Mo、Bi、As、Sb、Hg、P、Mn、B共16项元素。
表1统计了研究区16种元素的平均值、标准差等地球化学参数统计特征。由表1可知:研究区内各元素变异系数介于0.42~10,As、Ag、Au、Pb、Sn变异系数超过2.5,表明区内元素分布较不均匀,有可能发生成矿元素的局部富集。与地壳丰度相比,As、Sb、W、Bi富集系数q>3,是研究区强富集元素;Pb、Sn、Zn、Ag、Cd、B、Mo、Mn富集系数在1~3之间,是研究区富集元素。区内主要地质体的元素于全区的衬值(元素在地质体中的平均值比上研究区元素平均值)可以反映各地质体的元素背景:年波组(E2n)各元素衬值介于0.60~4.04,其中大于1.5的元素有Ag、Pb、Cd、Sn、Bi、As、Sb,其他元素衬值均小于1.5;典中组(E1d)各元素衬值介于0.63~2.17,Zn、Sn、Sb、Mo、Cd、Pb、Ag大于1,其他元素衬值小于1;昂杰组(P1a)各元素衬值介于1.00~1.72,P、Au、B、Cu的衬值大于1.5,其他元素的衬值均小于1.5;拉嘎组(C2P1l)各元素衬值介于0.99~2.02,其中Au、Cu、P的衬值大于1.5,其他元素的衬值均小于1.5;晚白垩—始新世岩体各元素衬值介于0.74~1.47 ,其中W、Zn、As、Mn、Mo、Ag、P衬值大于1,其余元素衬值均小于1;第四系(Q)各元素衬值介于0.98~1.55。
表1 普杰地区化探数据统计特征
Table 1
| 参数 | Au | Ag | Cu | Pb | Zn | Cd | W | Sn | Mo | Bi | As | Sb | Hg | P | Mn | B |
|---|---|---|---|---|---|---|---|---|---|---|---|---|---|---|---|---|
| 平均值 | 0.85 | 0.10 | 13.57 | 55.21 | 77.90 | 0.19 | 3.45 | 5.79 | 0.89 | 0.60 | 36.77 | 1.91 | 0.03 | 400.26 | 628.07 | 54.30 |
| 标准差 | 2.63 | 0.77 | 14.17 | 148.16 | 84.91 | 0.38 | 5.44 | 16.75 | 1.17 | 1.49 | 367.71 | 3.59 | 0.01 | 229.32 | 478.59 | 30.56 |
| 富集系数 | 0.99 | 1.73 | 0.8 | 2.91 | 1.15 | 2.34 | 3.56 | 2.76 | 1.44 | 3.33 | 8.36 | 5.63 | 0.55 | 0.73 | 1.08 | 2.59 |
| 变异系数 | 3.11 | 7.45 | 1.04 | 2.68 | 1.09 | 2.02 | 1.58 | 2.89 | 1.31 | 2.49 | 10 | 1.88 | 0.42 | 0.57 | 0.76 | 0.56 |
| 地层 | 衬值 | |||||||||||||||
| Au | Ag | Cu | Pb | Zn | Cd | W | Sn | Mo | Bi | As | Sb | Hg | P | Mn | B | |
| 第四系 | 1.32 | 1.33 | 1.27 | 1.15 | 1.16 | 1.17 | 1.02 | 1.55 | 0.98 | 1.12 | 1.52 | 1.18 | 1.03 | 1.19 | 1.11 | 1.07 |
| 昂杰组 | 1.6 | 1.17 | 1.72 | 1.04 | 1.29 | 1.17 | 1.03 | 1 | 1.06 | 1.24 | 1.24 | 1.24 | 1.2 | 1.52 | 1.23 | 1.61 |
| 晚白垩—始新世岩体 | 0.92 | 1.17 | 0.91 | 0.86 | 1.03 | 1 | 1.01 | 0.83 | 1.06 | 0.74 | 1.05 | 0.75 | 0.94 | 1.47 | 1.05 | 0.94 |
| 年波组 | 1.48 | 1.83 | 0.62 | 2.07 | 1.15 | 2.17 | 1.35 | 2.35 | 0.98 | 1.68 | 4.04 | 1.66 | 0.72 | 0.6 | 1.11 | 0.72 |
| 拉嘎组 | 2.02 | 1.25 | 1.83 | 1.07 | 1.36 | 1.28 | 1.09 | 1 | 0.99 | 1.16 | 1.27 | 1.11 | 1.29 | 1.52 | 1.14 | 1.38 |
| 典中组 | 0.9 | 2.17 | 0.63 | 1.66 | 1.07 | 1.5 | 1 | 1.1 | 1.28 | 0.96 | 0.92 | 1.13 | 0.91 | 0.75 | 1.02 | 0.77 |
注:Au含量单位为10-9,其他元素为10-6。
4 地球化学分区与分形结果对比
在ArcMap软件环境下通过IDW(inverse distance weighted)空间插值方法做出各元素地球化学等值线图像,结合普杰地区地质图(图2c)对各地质单元的元素背景作出对比,发现部分元素地球化学等值线图中(图3a、b、c),林子宗群火山地层和石炭—二叠系沉积地层之间的界线两侧元素含量分布具有较大的差别,符合台阶效应数据的特征。再结合各地质体的元素衬值特征(表1),足以说明图幅中的沉积地层与火山地层两类地质体可根据其地球化学性质大致划分为两组集合。据此将研究区图幅分为两个子区,以期精准识别数据台阶问题影响的弱小异常和假异常。石炭—二叠系沉积地层分区(1区)主要包括拉嘎组和昂杰组,分区内总体地球化学性质相似,该分区各元素均值与区域均值相差较小,富集元素种类相似;林子宗群火山地层分区(2区)包括年波组和典中组(图3d),两者地球化学性质较相似,该分区富集Ag、Pb、Sn等区域成矿元素。
图3
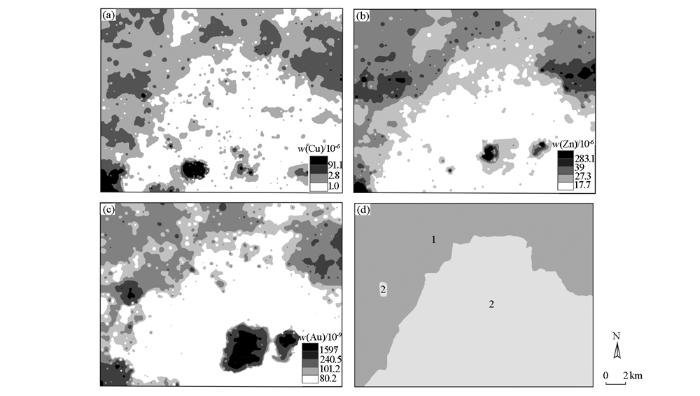
图3
普杰地区部分元素地球化学等值线图和背景分区
a—Cu地球化学等值线;b—Zn地球化学等值线;c—Au地球化学等值线;d—普杰地区地球化学背景分区;1—石炭-二叠系沉积地层分区;2—古近系火山地层分区
Fig.3
Geochemistry contour map and background division from Pujie area
a—geochemical contour map of Cu; b—geochemical contour map of Zn; c—geochemical contour map of Au; d—geochemical background division from Pujie area; 1—subzone of Carboniferous-Permian sedimentary strata;2—subzone of Paleogene volcanic strata
图4
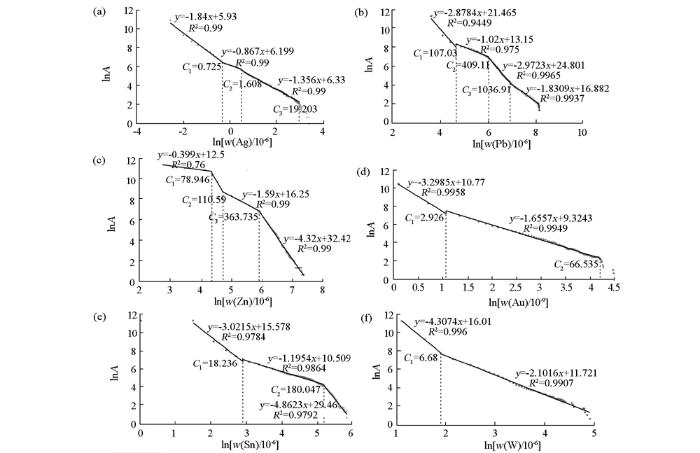
图4
普杰地区含量—面积法全区Ag(a)、Pb(b)、Zn(c)、Au(d)、Sn(e)、W(f)元素的双对数散点和分段直线拟合
Fig.4
Concentration-area double logarithmic plot and section lines fitting patterns of Ag(a),Pb(b),Zn(c),Au(d),Sn(e),W(f) in whole-area from Pujie area
图5
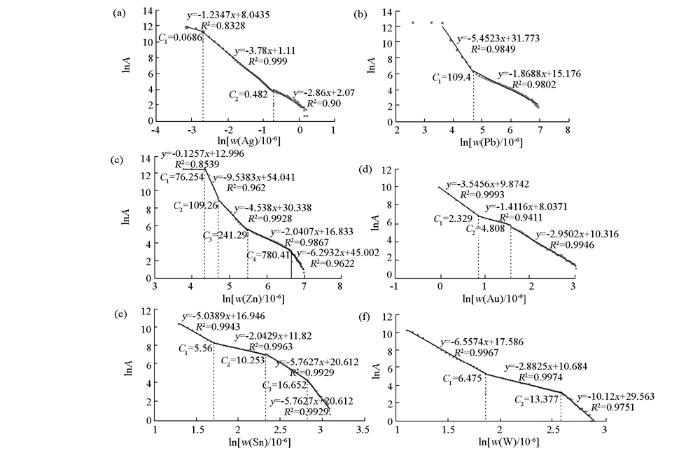
图5
普杰地区含量—面积法1区Ag(a)、Pb(b)、Zn(c)、Au(d)、Sn(e)、W(f)元素的双对数散点和分段直线拟合
Fig.5
Concentration-area double logarithmic plot and section lines fitting patterns of Ag(a),Pb(b),Zn(c),Au(d),Sn(e),W(f) in subzone-1 from Pujie area
图6
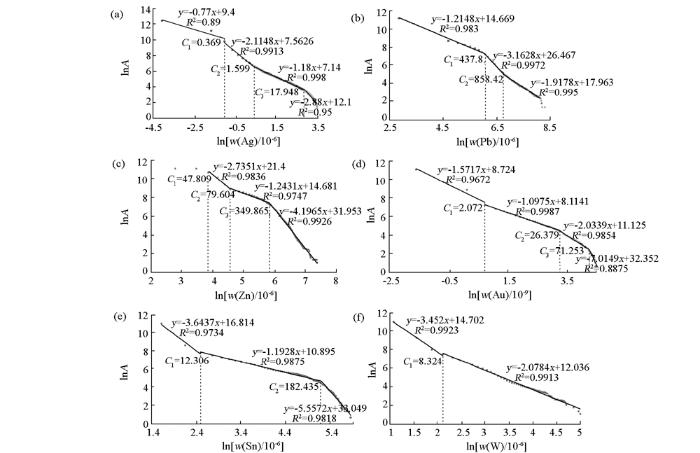
图6
西藏普杰地区含量—面积法2区Ag(a)、Pb(b)、Zn(c)、Au(d)、Sn(e)、W(f)元素的双对数散点和分段直线拟合
Fig.6
Concentration-area double logarithmic plot and section lines fitting patterns of Ag(a),Pb(b),Zn(c),Au(d),Sn(e),W(f) in subzone-2 from Pujie area
从图4a、5a、6a可以看出,Ag在全区中各分段直线斜率差距较小,全区C1和C2未找到分区后的对应值,其原因可能是在分区与全区间通过插值所作等值线图的面积不同。其中全区的C2与2区的C2位置大概对应,但拐点右侧直线拐向不同,说明这两个拐点性质不同,并不存在对应关系。1区拟合出3段直线并且其斜率相差不大,表明Ag在地层分区中分布较为均匀,不利于成矿,成矿潜力较小;2区元素含量跨度相对较大,拟合出4段直线,并且相邻直线段斜率有一定的差距,说明火山地层区中Ag的分布相对复杂,可能有一定的富集,有良好的找矿潜力。
从图4b、5b、6b可以看出,Pb在全区中拐点较多,相邻直线段斜率差距较大,分布形式复杂,但3个拐点在分区中均有对应,全区第一段直线与1区第一段直线比较位置相近、拐点相同,但拟合式有明显差异,说明两分区分布曲线在此发生相交。其中1区为低背景区域,1区中拟合为两段分段直线,斜率差距大,但斜率变化主要集中在曲线中低含量值部分,高含量值区间形式几乎无变化,表明其成矿潜力有限;相对1区而言,2区为较高背景区域。2区拟合为3段分段直线段和一条陡降的短尾,拟合直线斜率有一定差距,表明可能具有一定的富集。
从图4c、5c、6c可以看出,在全区中,Zn的整体分布形式与Pb相似,共拟合出4段直线,相邻直线斜率差距很大,分布形式复杂,全区3个C值在分区中均有对应的C值,低含量值部分主要受1区影响,而高含量值区间与2区分布形式对应,说明两分区分布曲线在此发生相交。其中1区中可拟合出5段直线,相邻斜率差值较大,在高含量值区间波动依然较强烈,说明可能具有矿化富集的特征;2区可拟合3段直线,其中第二段和第三段直线有较大的斜率差,第三条直线在区间内含量值高、面积跨度大,代表与其他元素相比,Zn具有较大的异常面积,具有一定的找矿潜力。
从图4d、5d、6d可以看出,Au在全区中可以拟合为两段直线和一个猛降的短尾,元素含量跨度不大,直线的斜率间有一定的差距,其C1在两分区均有对应的拐点,C2对应2区的C3。1区可拟合出3段直线,2区可拟合出4段直线,两者都较为平缓,意味着Au在两分区的分布形式差距不大。Au整体不具有典型的富集特征。
从图4e、5e、6e可以看出,Sn在全区中可以拟合出3段直线,相邻直线具有较大的斜率差,几乎与2区的分布形式完全相同,具良好的找矿潜力;1区可拟合出4条直线,相邻直线的斜率差距较大,具有较不均匀的元素分布特征。
从图4f、5f、6f可以看出,W在全区中可拟合出两段直线,与2区分布特征基本相同,分形分布简单,指示其元素分布均匀,1区拟合出3段直线,斜率具有一定差距,但区间内含量值过小。
表2 普杰地区全区及两子区含量—面积双对数图中拟合直线拐点统计
Table 2
| 元素 | 全区 | 分区 | 元素 | 全区 | 分区 | ||||||||
|---|---|---|---|---|---|---|---|---|---|---|---|---|---|
| 1区 | 2区 | 1区 | 2区 | ||||||||||
| C编号 | 数值 | C编号 | 数值 | C编号 | 数值 | C编号 | 数值 | C编号 | 数值 | C编号 | 数值 | ||
| C1 | 0.069 | C1 | 47.809 | ||||||||||
| C1 | 0.369 | C1 | 78.946 | C1 | 76.254 | ||||||||
| C2 | 0.482 | 〗 | C2 | 79.604 | |||||||||
| Ag | C2 | 1.599 | Zn | C2 | 110.59 | C2 | 109.262 | ||||||
| C1 | 0.725 | C3 | 241.29 | ||||||||||
| C2 | 1.608 | C3 | 363.735 | C3 | 349.865 | ||||||||
| C3 | 19.204 | C3 | 17.948 | C4 | 780.408 | ||||||||
| C1 | 107.037 | C1 | 109.4 | C1 | 6.6796 | C1 | 8.324 | ||||||
| Pb | C2 | 409.117 | C1 | 437.8 | W | C1 | 6.475 | ||||||
| C3 | 1036.91 | C2 | 858.428 | C2 | 13.377 | ||||||||
| C1 | 5.56 | C1 | 2.926 | C1 | 2.329 | C1 | 2.072 | ||||||
| C2 | 10.253 | C2 | 4.808 | ||||||||||
| Sn | C1 | 18.236 | C1 | 12.306 | Au | C2 | 26.379 | ||||||
| C3 | 16.652 | C2 | 66.535 | C3 | 71.253 | ||||||||
| C2 | 180.047 | C2 | 182.435 | ||||||||||
注:粗体项代表在全区不存在对应的拐点;C值单位除Au为10-9外,其他元素均为10-6。
通过各元素分形分布特征对比,结合其代表的成矿意义,总的来说:由于普杰地区两子区的元素的分布形式之间差异较大,在全区中,大部分元素的分形分布仅能够表现高元素背景值分区的分布特征,但无法提取低背景值分区的数据信息。全区的分形方法圈定的异常往往是放大高异常区所做出的评价。通过分区分别对分段拟合直线段计算异常下限,更加符合勘查地球化学理论,并能够体现出更丰富的成矿信息。
5 结论
1) 在含量—面积多重分形理论的基础上通过研究多组分形数据的叠加,发现了用含量—面积分形方法难以提取低弱异常,并从数学角度解释其原因。
2) 含量—面积多重分形方法对高异常的识别具有较好的准确性,而对于具有台阶效应的数据,应用结论1中的数学原理提出了一种放大低背景区异常信息的改进方法,该方法通过进行地球化学的子区分离,通常可以体现更多成矿信息,从而更精准地识别低背景区弱异常。
3) 上述结论对于常用分形模型具有一定的普适性,可向其他分形模型中推广。
参考文献
区域地球化学数据的归一化处理及应用
[J].
The normalization of regional geochemical data and its application
[J].
不同方法在栾川北部化探数据处理中的应用
[J].
Application of different data processing method in geochemical exploration in the north Luanchuan
[J].
趋势面方法圈定龙关地区化探异常及应用效果评价
[J].
The application of trend surface analysis to delineating geochemical anomalies in Longguan area and its effect
[J].
基于地质内涵的化探异常识别与评价方法
[P].
A geochemical anomaly identification and evaluation method based on geological connotation
[P].
分区背景校正法及其对化探异常圈定的意义
[J].
Unit-wise adjustment of geochemical background data and its significancein geochemical anomaly delineation
[J].
子区中位数衬值滤波法及弱小异常识别
[J].
Subregion median contrast filtering method and recognition of weak anomalies
[J].
滤波技术在武当—桐柏—大别成矿带地球化学异常提取中的应用
[J].
The application of the filtering method to the sieving and inspection of geochemical anomalies in the Wudang-Tongbai-Dabie metallogenic belt
[J].
地球化学异常提取的自适应衬值滤波法
[J].
A self-adaptive method of contrast filtering for extracting geochemical anomaly
[J].
The separation of geochemical anomalies from background by fractal methods
[J].
The fractal properties of geochemical landscapes as an indicator of weathering and transport processes within the Eastern Alps
[J].
岩石中元素背景值变化对地球化学成矿预测的影响
[J].
Influence of variation in element background values in rocks on metallogenic prognosis in geochemical maps
[J].
Identification of weak anomalies: A multifractal perspective
[J].
Delineating the complexity of Cu-Mo mineralization in a porphyry intrusion by computational and fractal modeling: A case study of the Chehugou deposit in the Chifeng district, Inner Mongolia, China
[J].
Constraining the distribution of elements and their controlling factors in the Zhaojikou Pb-Zn ore deposit, SE China, via fractal and compositional data analysis
[J].
DOI:10.1016/j.apgeochem.2019.104388
URL
PMID:32280158
[本文引用: 1]

Cadmium (Cd) is a non-essential trace element that is widely distributed in the environment. Both geogenic and anthropogenic sources can elevate Cd concentrations in soils and groundwater, which are important for maintaining healthy supplies of food and safe drinking water. Elevated Cd doses are carcinogenic to humans. The WHO Guidelines for Drinking-Water Quality recommend a guideline value for Cd of 3 mug/L. Important anthropogenic Cd sources include mining, atmospheric deposition of combustion emissions, and the use of Cd-containing fertilizers. We document several cases of Cd pollution in soil and groundwater based on worldwide accounts. Besides anthropogenic Cd sources, Cd is also incorporated into sulfides, carbonates, and phosphorites resulting in elevated Cd concentrations in associated rock types. The crustal median Cd content is 0.2 mg/kg. In soils, Cd occurs at concentrations of 0.01 to 1 mg/kg with a worldwide mean of 0.36 mg/kg. Weathering can lead to Cd concentrations up to 5 mug/L in soil water and up to 1 mug/L in groundwater. In aqueous solutions, Cd generally occurs as the divalent Cd(2+) and it is mobilized mainly in oxic, acidic conditions. Cadmium sorption is enhanced by the presence of high amounts of hydrous oxides, clay minerals, and organic matter, and its mobility is further influenced by pH, the redox state, and ionic strength of the solution. However, Cd can remain in solution as water-soluble complexes with anions, such as CdCl(+) and Cd(SO4)2 (2-), and dissolved organic matter while sorption and precipitation decrease the aqueous concentration of most other heavy metals. As a consequence, Cd is one of the most mobile heavy metals in the environment. The elevated mobilization potential, e.g., through competition and ligand induced desorption, is the reason for faster Cd release from soil into groundwater than other heavy metals. The goal of this study was to present a broad overview of the origin and concentration of Cd in groundwater, and its reaction pathways in aquatic environments. To gain an overview of the hydrochemical behavior of Cd, cases of Cd pollution in soil and groundwater, studies investigating Cd release, and information about the legal framework were compiled.
分形(多重分形)在区域化探数据处理中的应用——以柴北缘荒漠戈壁景观区为例
[J].
Fractal / multifractal modeling of geochemical exploration data in desert landscape area of Qaidam Basin
[J].
西藏班戈地区化探数据的多重分形特征及其成矿意义
[J].
Multifractal distribution patterns of geochemical data and its metallogenic significance:A case study in Bange region,Tibet
[J].
多重分形在个旧花岗岩凹陷带地球化学数据分析中的应用
[J].
The application of multifractal method to the analysis of trace element geochemical data in the Gejiu granite depression zone,Yunnan Province
[J].
新疆博罗科努成矿带东段地球化学分形特征及找矿预测
[J].
Geochemical fractal characteristics and prospecting prediction of the eastern section of the Boluokenu metallogenic belt,Xinjiang
[J].
Application of singularity mapping technique to identify local anomalies using stream sediment geochemical data:A case study from Gangdese, Tibet, western China
[J].
广西地球化学区带规律与异常分布分形解析
[D].
Fractal analysis on geochemical distribution and anomaly separation in the Guangxi autonomous region
[D].
一种确定地球化学异常下限的简便方法
[J].
A simple method to determine the lower limit of element geochemical anomalies
[J].
非线性成矿预测理论:多重分形奇异性—广义自相似性—分形谱系模型与方法
[J].
Singularity-genralized self-similarity-fractal spectrum(3S) models
[J].
西藏冈底斯西段铜铁多金属成矿作用与找矿方向
[D].
Copper-iron polymetal metallogenic regularity and election of targeet areas in the western of Gandise metallogenic belt, Tibet
[D].
冈底斯成矿带斑岩—矽卡岩矿化之耦合关系——以邦铺矿床为例
[J].
Coupling relationship between porphyry and skarn mineralization in Gangdise metallogenic belt: A case study of Bangpu deposit
[J].
