
0 引言
多道航空γ能谱测量在地质上是找矿和岩性成图的重要手段,也可以在环境领域用于放射性污染监测及居住区放射本底评估等。随着理论的发展,近年来航空γ能谱测量也可用于地下水流向监测和盐浓度分析,这对仪器性能和数据处理技术提出了更高的要求。
目前大多数航空γ能谱测量中使用的都是256道NaI(Tl)闪烁体探测器,这类探测器体积大,探测效率高,但同时能量分辨率相对较低,测量过程中的低计数峰受统计涨落影响较为严重。另外,虽然仪器记录了256道数据,对于传统三窗法来说,除了用总窗来衡量总体放射性水平外,仅使用三个窗的计数率来计算地表的钾、铀、钍含量。三个窗的中心峰位分别是40K的1 460 keV峰、铀衰变过程中214Bi的1 760 keV峰和208Tl的2 615 keV峰。
对于任何相同高度上的航空γ能谱测量,谱线的形态只是自然界钾、铀、钍在该高度上特征谱线的线性组合,也就是说,只需要3个特征向量即可构成整个测区某一高度上的所有谱线。但是在测量高度变化的情况下,单独的钾、铀、钍谱线也会发生变化。Dickson等证明[1],任意的单元素特征谱线无论随高度怎样变化,都可以由2个特征向量线性组合而成。因此在测量高度变化时,理论上所有航空测量得到γ能谱谱线都可以由6个特征向量线性组合而成。
1 聚类NASVD处理方法
1.1 聚类原则
奇异谱降噪(SVD)方法要求谱线各道方差基本一致。NASVD方法就是要先通过将每道谱线按所有测点的平均谱线进行比例调整,再对变化后得到的噪声调整矩阵使用SVD方法。而对于地质信息较为丰富的测区,平均谱线与各测点的谱线间差异较大,不利于谱线各阶噪声与信号的分离。所以在比例调整前,应对所有测点进行聚类处理。
聚类后任意一个类中谱线形态应比较相似,一个类中所有测点的谱线相似度越高,就越有利于奇异谱分解时信号特征向量与噪声特征向量的分离。在理想的聚类中,仅需要2个特征向量即可组成一个类中所有的谱线。
另外,如果某一聚类中的测点数量过少,则可能会导致最终结果有所失真,过多的话则会降低噪声向量与信号向量的分离效果。此处应尽量令每个聚类中测点数量保持在1万个左右。当然,这也为了控制计算量,避免在SVD运算中内存溢出。
1.2 构造噪声调整矩阵
对于每个聚类,设原始谱线矩阵为A,是一个n行m列的矩阵,其中m为谱线道数,n为测点数。设1≤i≤n,1≤j≤m,A(i,j)即为第i个测点的第j道计数。将所有测点的谱线求和得到和谱线向量Sum,Sum(j)为该向量的第j道计数。和谱线元素:
将单测点的总计数除以整个聚类的总计数,得到单位归一化的测点向量P,P(j)为该向量的第j个测点的归一化计数。单位归一化测点:
求二者的外积,得到估计矩阵:
将原始谱线矩阵中的所有元素A(i,j)除以估计矩阵相应元素Aest(i,j)的算术平方根,得到噪声调整后的矩阵:
1.3 奇异值分解
对于一般的奇异值分解,可以写成:
其中:U是左奇异向量,包含各测点与特征向量的对应关系;S是一个对角阵,对角元素即是奇异值;V是特征向量构成的矩阵。
对于聚类前的谱线矩阵,所有有效信息基本都包含在分解后的前8个特征向量中,聚类后的谱线矩阵一般需要的含有有效信息的特征向量不超过4个。所以我们并不需要保留全部m个特征向量,那式(5)可以改写成
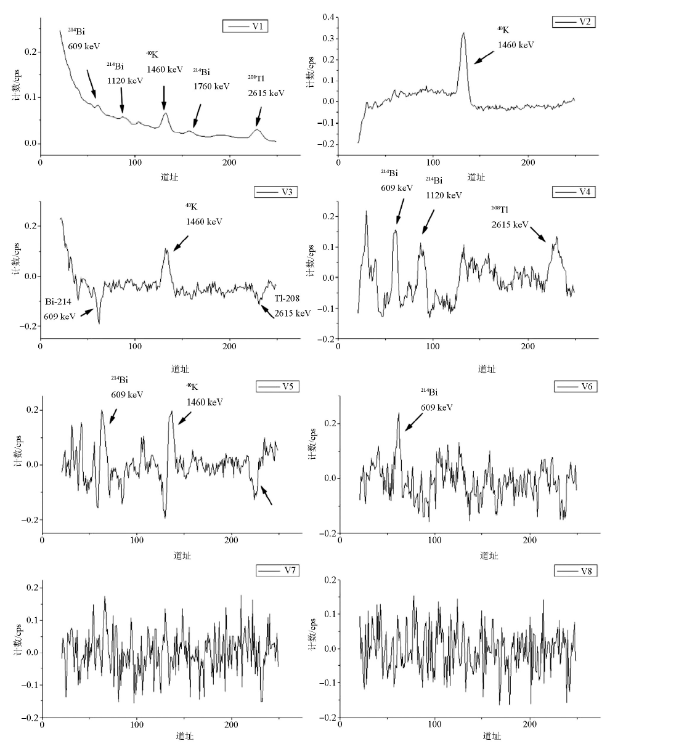
其中:Δ就是被分离出来的噪声,r是根据特征向量谱线形态保留的特征向量个数。在图1中,V1是平均谱线,直到第6个特征向量依然可以看到214Bi 的609 keV峰,但第6个特征向量之后,各特征峰就已无从分辨。此处计算中使用目前最普遍的零位移QR迭代法。
图1
2 实际测区数据处理结果
2.1 实际测区基本信息
选取近年来3个测区的数据,用聚类NASVD方法进行了处理。这些测区的数据采集中,使用的仪器为GR-820多道航空γ能谱仪,仪器设置基本相同,采样率为1 s-1,飞行速度在100~150 km/h之间。
其中测区A位于中高山区,地形落差极大(表1);测区B位于中山区;测区C位于湖区。A区测线中平均飞行高度的标准差远高于其他测区,C区地形较为平坦,飞行高度分布比较均匀。
2.2 聚类NASVD降噪实例
在这些测区的处理中,根据钍窗与钾窗的计数率比例关系、钍窗与铀窗的计数率比例关系,以及康普顿峰的计数率(主要由高度和总体辐射水平来决定)这3个要素来进行聚类。虽然这3个要素并不能完全决定谱线形态,但聚类后信号与噪声在奇异谱分解中也已经十分明显。
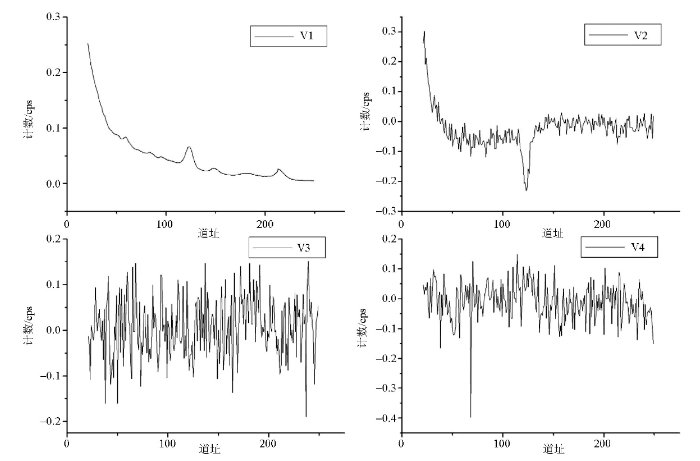
在图2中,奇异谱分解后得到的V1是该聚类的平均谱线;V2是因为聚类后,钾窗计数率的变化依然大于其余各道计数率的变化;V3和V4中,各自然衰变谱均已淹没于噪声之中。所以在这个聚类中,V2之后的所有特征向量基本都是由噪声构成的,为了保险起见,保留前4个特征向量。另外,第四组特征向量V4的第67道附近有明显的尖刺噪声,返回到原始数据中,可以找到某测点的第67道的一处孤立尖刺噪声。所以,我们在通过奇异谱分解降低固有噪声的同时,也能通过这种方法来寻找测量中的错误点。
图2
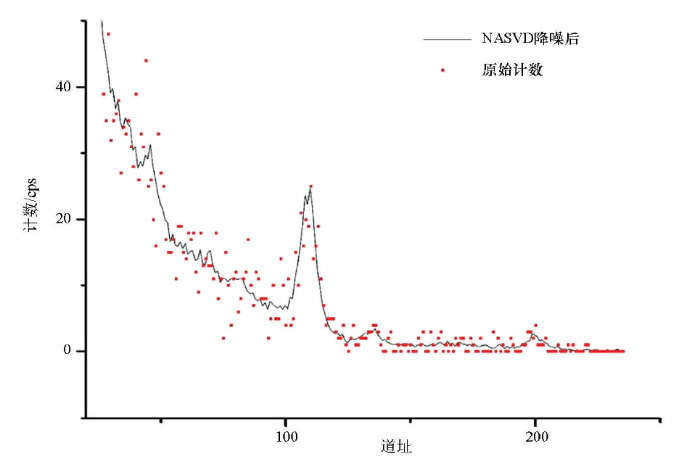
处理后,每一个测点的谱线均如图3一样被重构。不仅钾、铀、钍峰更加清晰,氡的两个特征峰(609 keV和1 120 keV)也显现了出来。降噪后各窗计数率可以从重构后的谱线中计得。
图3
2.3 测线降噪效果
为了说明NASVD法的噪声抑制效果,在对C测区全区数据进行处理后,截取了一段宽阔湖面上方70 s的数据(图4)。这一段数据的飞行高度保持在150±2.2 m,且时间较短,可以认为大气氡、宇宙线都没有发生变化,所有的计数噪声都是由统计涨落引起的。各窗数据在处理后均得到了显著改善,钾、铀、钍计数率的标准差分别降低了34.9%、50%和73.3%。
图4
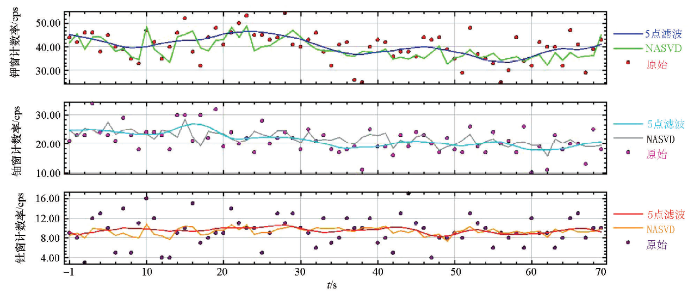
表2 水面上方150 m测线各窗平均计数率在使用NASVD方法处理前后的噪声对比
| 窗口 | 处理后计数率 | 原始计数率 | 改善率 |
|---|---|---|---|
| 钾 | 39.1±4.1 | 40.1±6.3 | 34.9% |
| 铀 | 22.0±2.3 | 21.3±4.6 | 50% |
| 钍 | 9.3±0.8 | 9.5±3.0 | 73.3% |
各窗计数率均值都发生了一些偏移,在实际测量数据中,很难认定哪个数据更接近“真实”值,以及使用NASVD方法的过程中产生的偏移量是多少。Minty等[3]为此进行了蒙特卡洛模拟,并提出了一种引入理论谱线“打补丁”来降低偏移量的方法,本文中并未使用。
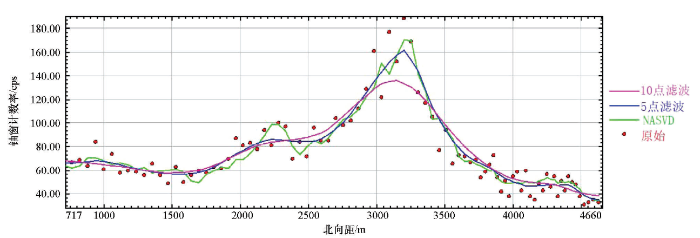
在有效降低噪声的同时,NASVD法对地质信息有很大程度的保留。我们在A测区截取一段4.6 km长,方向为0°的测线(图5),分别采用算术平均法和NASVD算法处理。NASVD法处理后的剖面不仅比算术平均滤波算法保留了更高的主异常峰值,同时在北向距2 000~2 500 m处保留了被算术平均算法过滤掉的一些地质细节。
图5
定量分析实际测区的信噪比十分困难,因为在实际航空γ能谱测量中,不存在将信号与噪声彻底分离的方法。在我们作为例子的3个测区中,由于各窗的计数率根据实际飞行高度和地质条件而变化,所以简单的使用计数率标准差来衡量噪声水平并不十分合适。这里将原始计数率的五点算术平均滤波结果作为基准值来估计各测区的平均相对噪声变化情况(表3)。
表3 各测区处理后全区平均估算噪声改善情况
| 测区A | 测区B | 测区C | ||
|---|---|---|---|---|
| 钾 | 原始计数率/% | 5.9 | 5.7 | 6.7 |
| NASVD处理后/% | 4.1 | 4.4 | 5.0 | |
| 改善率/% | 30.5 | 22.8 | 25.4 | |
| 铀 | 原始计数率/% | 10.2 | 10.9 | 12.0 |
| NASVD处理后/% | 3.1 | 3.0 | 4.2 | |
| 改善率/% | 69.6 | 72.5 | 65.0 | |
| 钍 | 原始计数率/% | 10.0 | 10.2 | 15.4 |
| NASVD处理后/% | 3.3 | 3.2 | 4.6 | |
| 改善率/% | 67.0 | 68.6 | 70.1 |
从表3来看,由于在聚类过程中考虑到了高度因素,使用NASVD算法降噪后,虽然测量高度差较大,但A区的降噪效果与B、C两区差别不大。
2.4 平面阴影图效果
图6
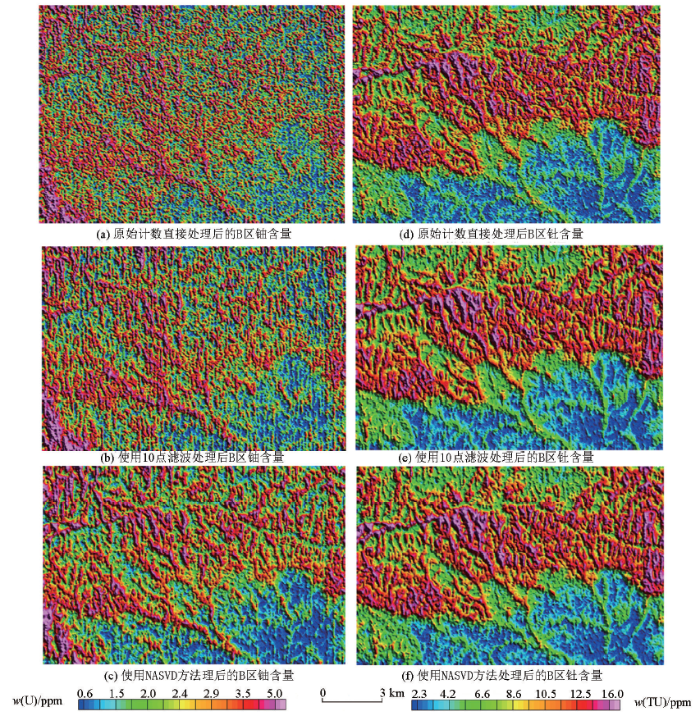
图7
对于γ射线这样浅层地质信号的成图来说,飞行高度100 m左右时得到的各窗计数,绝大多数来自于距离测点水平距离200 m以内的地表,所以对于线间距500 m以上的测区,相邻测线测量值的相关性远低于线间距100 m的测区。这就导致在线间距500 m的测区,很多在单根测线反应出来的异常在平面图上看起来像是噪声。
3 结论
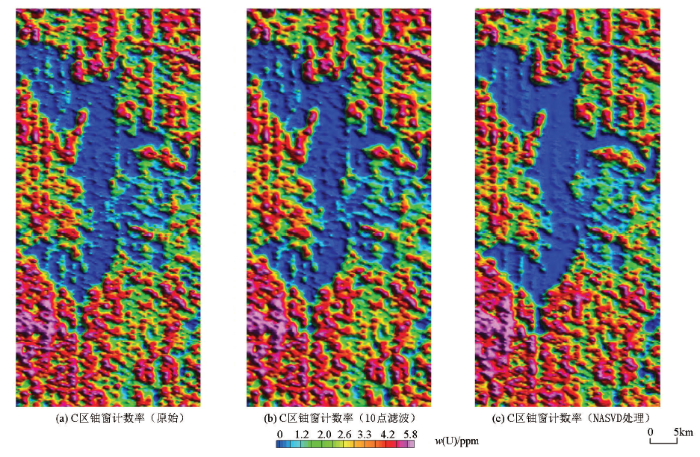
NASVD算法在不破坏异常形态的前提下,对铀、钍窗均有显著的降噪效果,对窗口计数率较低的铀窗来说效果尤其明显。而对于测量比例尺较小的测区来说,虽然测线噪声的改善效果与大比例尺测区并无区别,但平面阴影图没有达到相应的效果。
对于小比例尺、低高度的测量飞行,将地表植被及土壤水分的不均匀分布导致的计数率起伏误认为是噪声的情况十分常见。因此,用NASVD方法降低了50%的仪器固有噪声后,也并未能令各窗的平面阴影图有太大的改观。这个时候将噪声源归咎于仪器十分不可取。
参考文献
Utilising multichannel airborne gamma-ray spectra
[J].
DOI:10.1139/e81-167
URL
[本文引用: 1]

Abstract Experimental studies using a large-volume sodium iodide detector system show how the potassium, uranium, and thorium gamma-ray spectra vary with altitude above the ground. The shapes of the spectra were derived from measurements on large radioactive concrete calibration slabs using plywood sheets to simulate the absorption of the gamma radiation in the air. A mathematical analysis of the data showed that within the range covered by the experiment (0–112 m of air) the spectra of each of the three radioelements are made up essentially of two spectral components, whose proportions vary with the amount of absorbing material between the source and the detector. With this knowledge, it is shown how all the basic information relating to source–detector distance and source concentration may be extracted from the airborne gamma-ray spectrum.
The analysis of multichannel airborne gamma-ray spectra
[J].
DOI:10.1190/1.1441886
URL
[本文引用: 1]
Experimental potassium, uranium, and thorium gamma‐ray spectra covering a range of equivalent aircraft altitudes from 0 to 112 m were derived from measurements on large radioactive concrete calibration pads using plywood sheets to simulate the absorption effects of the air. A mathematical analysis of all three radioelement spectra showed they are composed of two basic spectral components which are added in different proportions dependent on the altitude of the aircraft above the ground. Above an energy of 0.662 MeV, the two‐component spectral model represented accurately the observed gamma‐ray spectrum from the ground. Below this particular energy, cesium-137 from atomic weapons fallout was found to contribute significantly to the airborne spectra. A theoretical analysis of the calculated spectrum from typical crustal material showed that by multispectral fitting above the cesium-137 energy, the thorium and uranium concentration errors could be reduced by approximately 25 percent compared to the standard ...
Airborne gamma-ray spectrometric background estimation using full spectrum analysis
[J].DOI:10.1190/1.1443241 URL [本文引用: 2]
A new processing technique for airborne gamma-ray spectrometer data (Noise adjusted singular value decomposition)
[C]//
Reducing statistical noise in airborne gamma-ray data through spectral component analysis
[C]//
Improved NASVD smoothing of airborne gamma-ray spectra
DOI:10.1071/eg998516
URL
[本文引用: 1]
Noise-adjusted singular value decomposition (NASVD) is a spectral component analysis procedure for the removal of noise from gamma-ray spectra. The procedure transforms observed spectra into orthogonal spectral components. The lower-order components represent the signal in the original observed spectra, and the higher-order components represent uncorrelated noise. Noise is removed from the observed spectra by rejecting noise components and reconstructing the spectra from lower-order components. A synthetic dataset has been used to obtain new insights into the NASVD method. The dataset is based on an airborne survey over the Jemalong Plains area, NSW. The estimated ground concentrations of potassium (K), uranium (U) and thorium (Th) were spatially filtered and then used to synthesise airborne spectra using simulated Poisson noise. These spectra include a background component based on typical aircraft and cosmic background, and a simple model of the distribution of atmospheric radon. The application of NASVD smoothing to this dataset gives a much greater reduction in U concentration errors than that normally experienced. Careful investigation suggests that the reason for this is that the Jemalong Plains dataset exhibits high correlation between U and Th, and because the survey was flown on a day of low and near constant atmospheric radon concentration. If the dataset is modified by either adding spectra derived from an anomalous U/Th source, or by including atmospheric radon variations typical of most airborne surveys, then the large reductions in U concentration error are no longer achieved. Tests on the synthetic data suggest that the smaller the variation in spectral shape within the input signal, the greater the noise reduction. This is used to develop an improved implementation of the NASVD method that can be applied to large survey datasets. Instead of processing the survey data by flight, the entire survey database is sorted into clusters on the basis of similarity in spectral shape, and the NASVD method is applied to these clusters. This typically halves the K, U and Th fractional errors compared with those obtained when the data are processed according to flight. This increases the amount of geological information that can be extracted from enhanced images of the processed data.
Accurate noise reduction for airborne gamma-ray spectrometry
DOI:10.1071/eg03207
URL
[本文引用: 1]
Three hypotheses are tested for the pre-conditioning of airborne gamma-ray spectra to improve the accuracy of principal component-type (PC) spectral noise-reduction methods. First, I show that the distribution of the input variables (channel count rates) has little effect on the accuracy of the noise-reduction methods. Second, if there are insufficient spectra of a particular shape to form a statistically significant sample, then this shape will not be resolved by the noise-reduction methods, and will be removed as noise. However, by padding the data space with spectra exhibiting the full range of possible spectral shapes, an improvement in accuracy can be achieved. Third, the low signal-to-noise ratio in raw gamma-ray spectra limits the effectiveness of PC methods for removing the noise. If the signal-to-noise ratio in the input spectra is improved, the PC methods better remove the noise. Along-line summing of spectra improves the signal-to-noise ratio by exploiting the high correlation in signal between successive airborne gamma-ray spectra along each flight line. Summing spectra to optimum channels also improves the signal-to-noise ratio, but at the expense of spectral resolution. In both cases, spectral summing prior to the application of PC-type noise reduction results in a significant improvement in the accuracy of the noise-reduced spectra.
卡尔曼滤波在航空γ能谱勘查系统自动稳谱中的应用
[J].
新一代航空多道伽马能谱仪的引进和初步应用
[J].
DOI:10.3969/j.issn.1000-8918.2002.04.019
URL
GR-820集优秀的稳谱技术、数字可视化设计和实时谱图显示于一身,提供了更为精确的伽马能谱测量。文中简要地介绍了GR-820的工作原理、性能和应用效果等几方面的内容,供读者了解当今航空伽马能谱仪的发展状况。
航空多道伽玛能谱仪系统的升级改造研究报告[R]
GR-820标定方法的研究报告[R]
GR-820飞行方法的研究报告[R]
GR-820消化吸收研究报告[R]
航空伽玛能谱仪标定质量评价
C]//我国开展航空伽玛能谱测量虽然已经有20多年的历史,测量系统的标定却一直是借鉴国际原子能机构提供的航空伽玛能谱测量技术报告(323)作为测量规范,没有开展系统的质量评价研究.为了了解航空伽玛能谱测量的误差水平,2002年中国地质调查局开展了该项研究工作.
数字技术在航空伽马能谱仪中的应用
[J].基于峰值采样保持的模拟能谱仪无法满足大尺寸多晶体高计数率的航空能谱测量。本系统采用了Y/U双通道数控增益放大器实现了谱漂的双16位分辨率调节范围,通过高速ADC与CPLD实现数字化能谱仪,在CPLD内部用VHDL语言编程实现基线恢复与峰高数据采集,保证了能量分辨率。结果表明:计数最大通过率大于100k/s,1 024道分辨率137Cs峰谱漂±1道,能量起始阈20 keV。实验证明本系统功耗低,性能可靠,体积小,可应用于航空能谱测量的场合。
航空数字γ能谱测量系统的研制
[J].航空数字化γ能谱测量系统以NaI(T1)晶体(10 inm×10 minx40 mm)和光电倍增管构成的闪烁计数器为丫射线探测器,采用4条下测晶体和1条上测晶体组合成航空γ能谱测量系统的探头,设计了温度传感器、电流反馈型前置放大器和低纹波高压供电电路,实现了γ光子与核信号的转换;采用Y/U双通道数控增益放大器、双回路自动稳谱电路和算法实现了谱漂的精细调节和自动稳谱,通过高速ADC与CPLD实现模拟核信号的数字化.该系统可接入NaI(T1)闪烁计数器γ探测器数20条,可探测能量范围0.02-10.0 MeV,采样周期0.5-1s,最大计数通过率>100 k/s,1024道谱漂<±1道.
航空伽玛能谱测量系统标定技术与标定程序
[J].
DOI:10.3969/j.issn.0258-0934.2014.05.010
URL
航空伽玛能谱测量是直接寻找铀矿和进行区域地质调查的重要技术手段,在地质勘探、环境辐射评价、核应急和军控核查等方面具有重要作用。航空伽玛能谱仪探测K、U、Th核素衰变系列的伽玛射线窗口计数,要将测量计数率换算成地面放射性核素含量就需要对航空伽玛能谱测量系统进行标定,系统标定是航空伽玛能谱测量中最为复杂的程序,也是航空伽玛能谱测量的一项关键技术。论文系统介绍了目前中国国土资源航空物探遥感中心实施的航空伽玛能谱测量系统标定技术及相应的标定程序,这对理解航空伽玛能谱测量及资料应用具有实际意义。
航空伽马能谱测量方法技术现状与展望
[J].
