基于深度学习的变差函数自动拟合方法研究
An automatic fitting method for a variogram based on deep learning
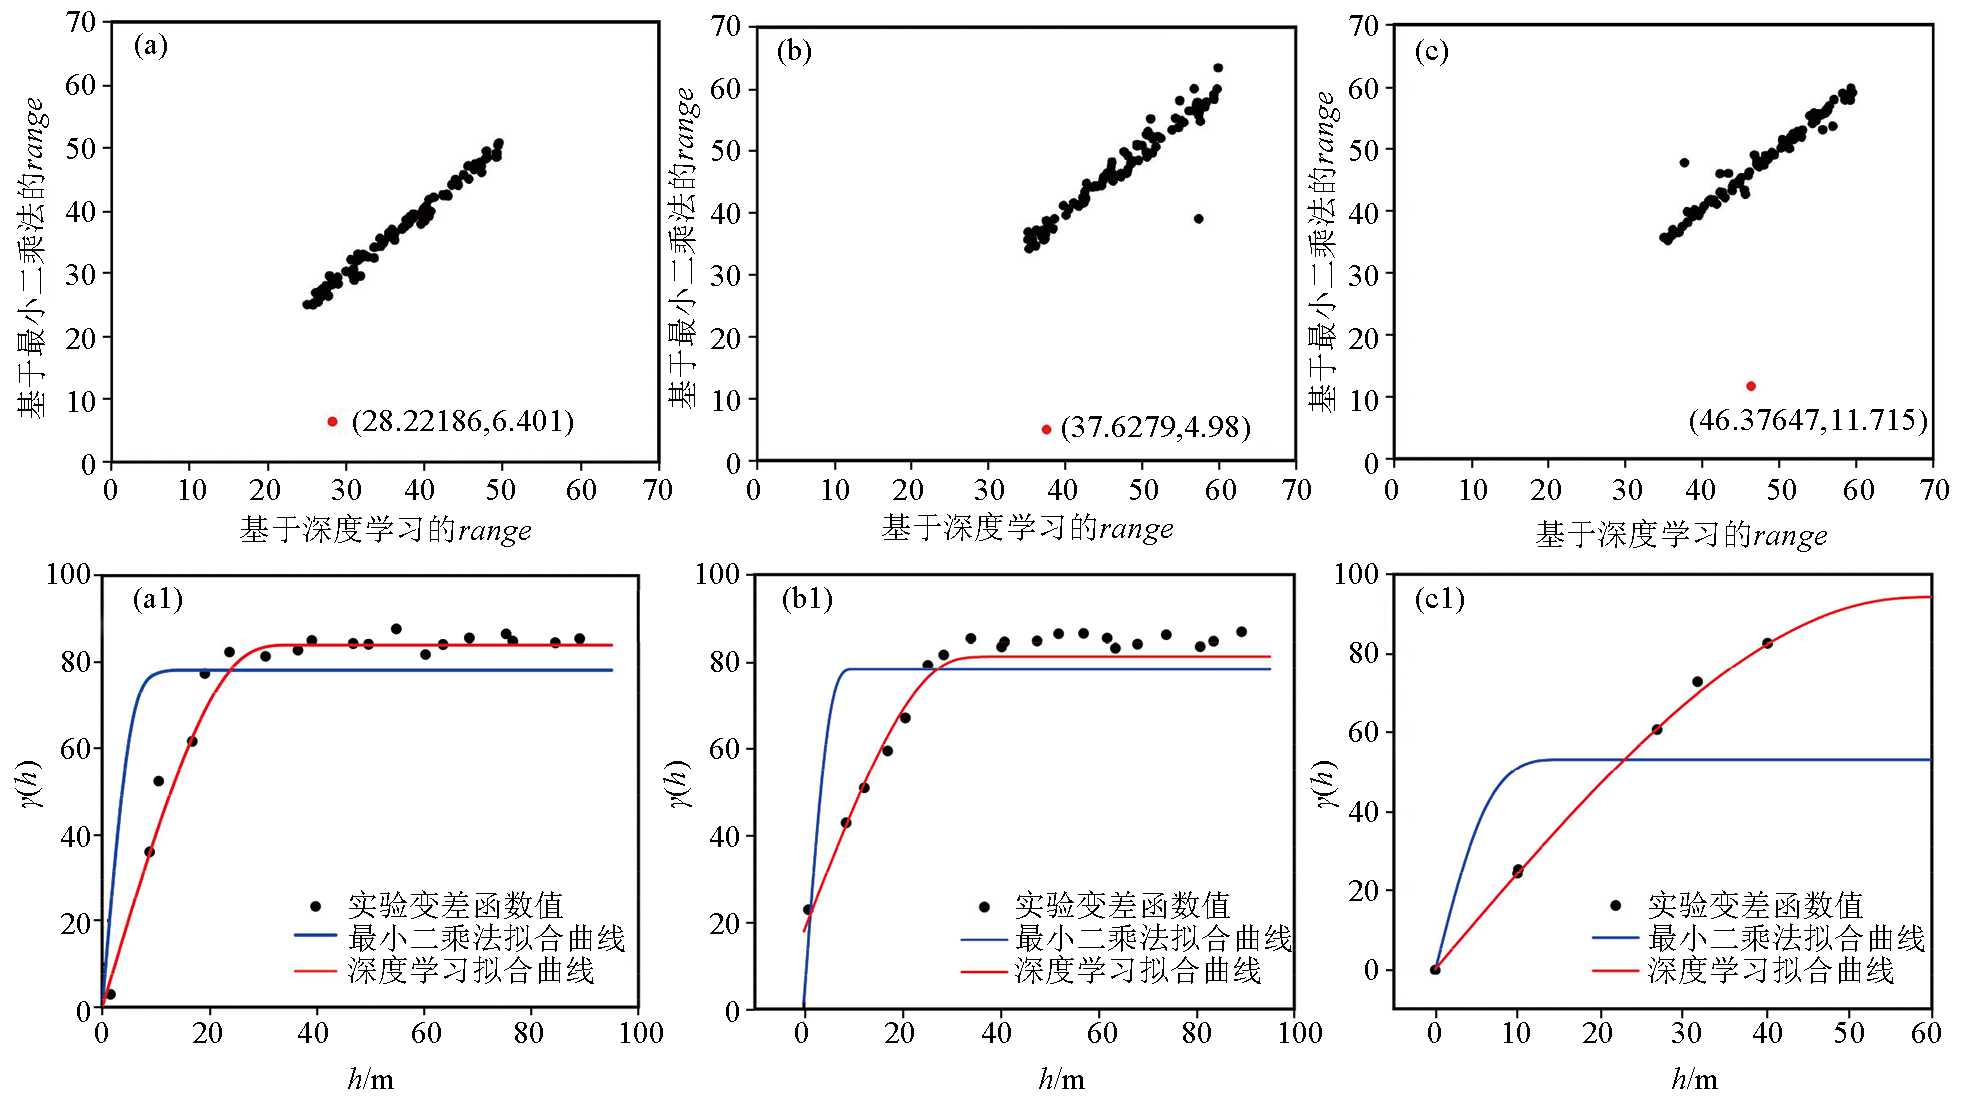
a—变差函数的range范围为25~50时最小二乘法和深度学习法range映射关系,红色点为异常点;b—变差函数的range范围为35~60时最小二乘法和深度学习法range映射关系,红色点为异常点;c—变差函数的range范围为35~60时最小二乘法和深度学习法range映射关系,红色点为异常点;a1—对应a红色异常点横纵坐标分别对应最小二乘法拟合曲线和深度学习曲线变程;b1—对应b红色异常点横纵坐标分别对应最小二乘法拟合曲线和深度学习曲线变程;c1—对应c红色异常点横纵坐标分别对应最小二乘法拟合曲线和深度学习曲线变程
a—range mapping relationship between the least squares method and the deep learning method when the variogram function's range is 25~50, with red points indicating outliers; b—range mapping relationship between the least squares method and the deep learning method when the variogram function's range is 35~60, with red points indicating outliers; c—range mapping relationship between the least squares method and the deep learning method when the variogram function's range is 35~60, with red points indicating outliers; a1—the x and y coordinates of the red outliers in a correspond to the values of the least squares fitting curve and the deep learning curve, respectively; b1—the x and y coordinates of the red outliers in b correspond to the range values of the least squares fitting curve and the deep learning curve, respectively; c1—the x and y coordinates of the red outliers in c correspond to the range values of the least squares fitting curve and the deep learning curve, respectively