基于U-Net网络的FWI地震低频恢复方法
王莉利1,2( ), 杜功鑫1, 高新成3, 王宁4, 王维红4
), 杜功鑫1, 高新成3, 王宁4, 王维红4
FWI seismic low frequency recovery method based on the U-Net
WANG Li-Li1,2(), DU Gong-Xin1, GAO Xin-Cheng3, WANG Ning4, WANG Wei-Hong4
), DU Gong-Xin1, GAO Xin-Cheng3, WANG Ning4, WANG Wei-Hong4
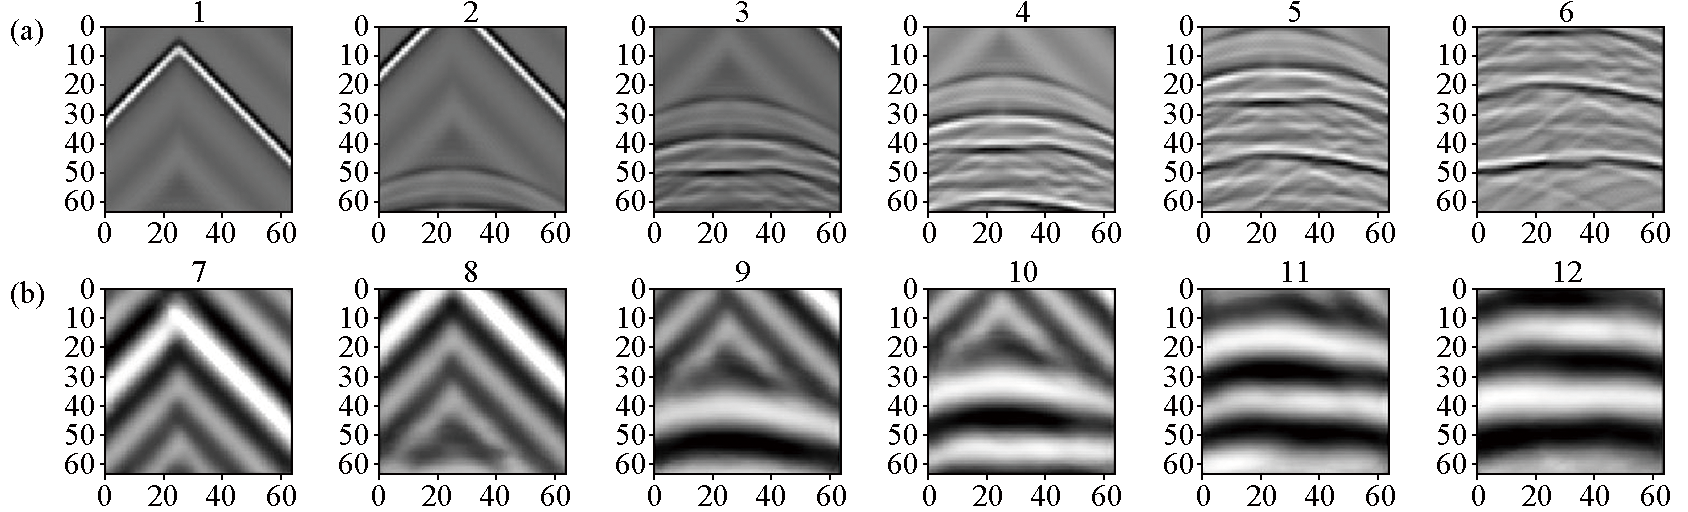
图9. 测试集高频数据与对应预测低频结果可视化展示
a—6张大小为64×64的测试高频数据;b—图a中数据对应预测低频数据
Fig.9. Visual display of test high frequency set and prediction results
a—6 pieces of test high frequency data with the size of 64×64;b—fig. a prediction of low frequency data from test data